Category Archives: Weekly/After Stock Market Review Archives

Every Sunday evening a full market review is sent to members of SelfInvestors.com which provides commentary on the technical and economic picture, a review of the SelfInvestors Model Portfolio, the best/worst performing industries and ETF’s for the week, IPOs to watch, upcoming economic reports as well as notable earnings reports. In addition, on days when the market makes a significant move I’ll highlight the technical action discussing price/volume movements and support/resistance levels, industries/sectors leading and lagging the market as well as a Stock of the Day. In the past these were sent in the middle of the trading day but I’ve since begun publishing them and sending them to members after the market closes. These reports will be archived here as well.

Solar Whacked, Medical Showing Strength, GE Reports Friday

I’m trying to take a bit of time off this weekend so won’t have a detailed look at the market this week but will have an update once normal trading volumes return towards the middle of the week. 

::: Model Portfolio :::

** This section will now appear as a separate report about every other Wednesday. 

The Self Investors Model Portolio wrapped up 2006 with a gain of 27.6%, 2007 with a gain of 30.2% and is more than 10% ahead of the S&P in a very difficult 2008.  This is a REAL portfolio with position sizing and features annualized returns of 24%.

Would you like to receive buy and sell alerts in the Model Portfolio within minutes (NEW! now get them via instant messaging in near real time) of each transaction?  You can receive these along with ALL of the tracking tools and video reports with the very popular Gold membership.  Don’t delay, get started today and join me for many more highly profitable months here at SelfInvestors.com.

::: Best/Worst Performers :::

– Top 10 Performing Industries For the Week –

1. Drug Manufacturers – Major: 4.40%
2. Biotechnology: 3.65%
3. Discount – Variety Stores: 1.85%
4. Auto Parts Wholesale: 1.85%
5. Gold: 1.70%
6. Education & Training Services: 1.65%
7. Long Distance Carriers:  1.60%
8. Drug Manufacturers – Other: 1.35%
9. Medical Instruments & Supplies: 1.10%
10. Telecom Services – Foreign: 1.05%

– Top 10 Worst Performing Industries For the Week –

1. Resorts & Casinos: -16.30%
2. Internet Service Providers: -14.15%
3. Major Airlines: -13.15%
4. Publishing – Periodicals: -13.10%
5. Semiconductor – Memory Chips: -12.75%
6. Auto Dealerships: -11.75%
7. Mortgage Investment: -11.30%
8. Long Term Care Facilities: -11.05%
9. Home Furnishings & Fixtures: -11.05%
10. Semiconductor – Specialized: -10.20%

– Top 5 Best Performing ETFs For the Week –

1. iShares Silver (SLV) 5.75% 
2. HLDRS Biotech (BBH) 4.15%
3. Central Fund of Canada (CEF) 3.80%
4. US Oil Fund (USO) 3.25%
5. SPDR Biotech (XBI) 2.70%

– Worst 5 Performing ETF’s –

1.Claymore Global Solar Energy (TAN) -15.20%
2. Turkish Invest Fund (TKF) -13.60%
3. Greater China Fund (GCH) -13.15%
4. PowerShares Clean Energy (PBW)  -12.15%
5. Market Vectors Coal (KOL) -12.05%

::: Upcoming Economic Reports (7/7/2008- 7/11/2008) :::

Monday:        None
Tuesday:       Wholesale Inventories, Consumer Credit
Wednesday:  Crude Inventories
Thursday:      Initial Claims
Friday:           Export/Import Prices, Trade Balance, Mich Sentiment (prelim), Treasury Budget

::: Earnings I’m Watching This Week :::

Tuesday: Alcoa (AA)

Wednesday: Acergy (ACGY), Shaw Group (SGR)

Friday: General Electric (GE)

Market Carving Out Double Bottom? Need a Spike in VIX

I have to admit, today’s move caught me a bit off guard.  I was looking for some kind of dead cat bounce from oversold levels and a big washout once earnings began pouring in and traders returned from the July 4th holiday.  The market awaits nobody!  I mentioned to members last night that you can throw out the trading action on the day of the Fed.  It’s in the day or two after the announcement that is most important as traders digest the words of the Fed and construct their trading strategies for the month ahead.  Apparently, the consensus strategy was to sell, sell, sell!

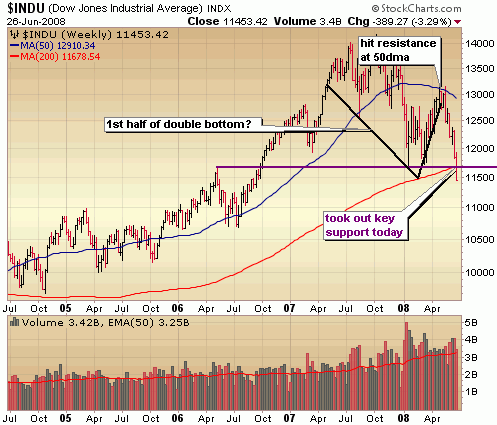
Today was a defining move particularly for the Dow, which busted through the March lows which also happens to be support at the old all time highs.  I know, I know.. here come the emails that say the Dow doesn’t matter.  Yes, it’s not a good representative of the market, BUT it is a HEADLINE number.  It’s the number that Joe Schmo sees when he comes home from work on the evening news, so it does matter.  Hopefully Joe Schmo has heeded my advice this year to stay the heck out of this market or be fully hedged.  Either way, you my friend are sitting darn purdy here.. flush with cash and ready to pounce when a new bull market emerges.

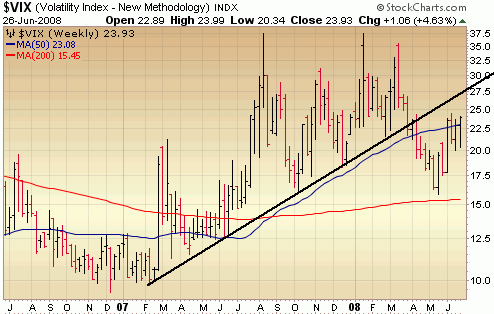
Ah but first things first.  This is a big, bad bear market with not a bull in sight.  Let’s take a look at the charts to get a sense of where we might be headed next… but before I do let me be very clear:  this is no time to be a knife catcher nor a hero trying to pick a bottom.  Before that can happen we need a spike in the volatility index (VIX) followed by massive capitulation.  Here’s a look at the VIX which could hit resistance around 28 and market a bottom.  You see it broke the up trend of 2007 following that March low, so could be settling down.  Watch the VIX (potentially tomorrow) should it test what is now resistance of that up trend line around 28 – 30.

62608_volatilityVIX

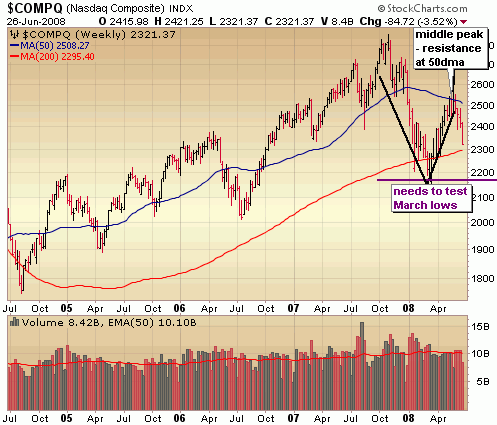
The Nasdaq could get a snap back rally after touching 2300, but ultimately it will need to come down and test those March lows, potentially carving out the 2nd leg down of a double bottom base. 

62608_nasdaq1

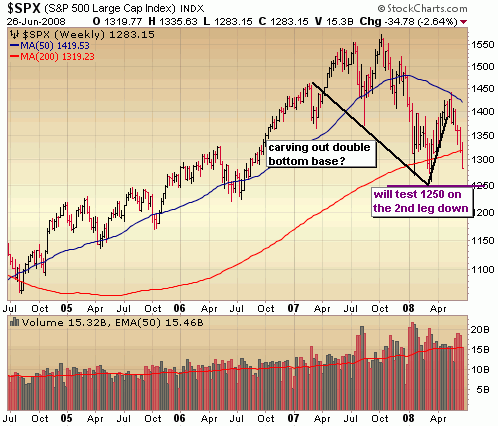
Note the potential for a double bottom base in the S&P as well but remember that the 2nd leg down often undercuts the first leg down, shaking out the last of the weak holders.  So, while 1250 – 1260 is strong support around the March lows, it may take a breach of that level to really drive the fear and get the VIX up in 30 range. 

62608_sp5001

I didn’t annotate it out in the S&P and Naz but if you’re new to chart reading or believe the charts don’t matter I want you to take a look at the rise off the March bottom and run to that 50 day moving average in blue on all the indices.  It’s absolutely no coincidence that the market failed at that point.  Zero, zilch.  Now think about all the "professionals" on CNBC or other entertainment (I mean news..) outlets that said the economy isn’t so bad and now is a great time to buy.  If just one person reads this report tonight, begins to turn off Cramer and think for themselves based on simple chart analysis then I’m happy.

62608_dow1

Please continue to be careful out there.  My recommendation remains the same.. stay on the sidelines or fully hedged.   Although fully hedged is becoming more of a risk down here, so moving more to cash is the best option right now.  Good night and good trading.

Due for a Rally, But Bears Still In Control

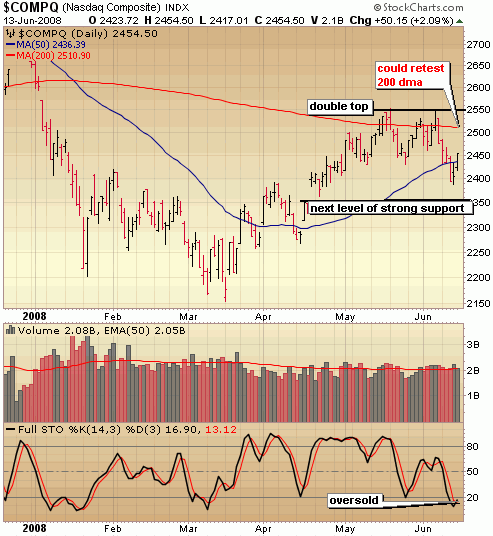
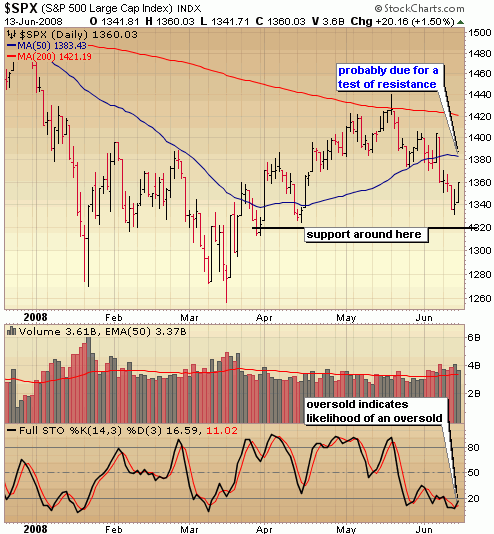
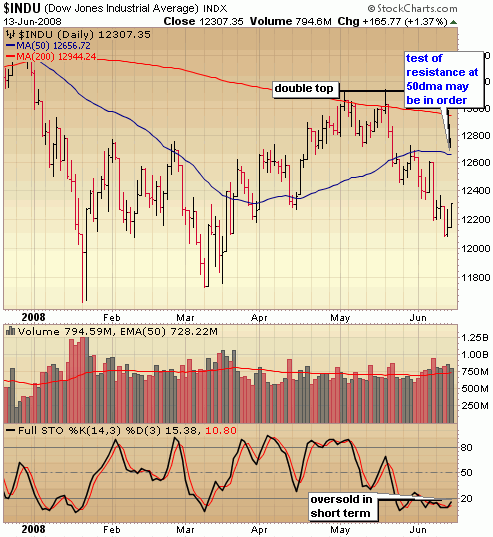
I’m gonna keep it real short this week and stick to the meat and potatoes of the technicals.  After all, it is Father’s Day and the US Open is winding down.. :)  Hope you’re all enjoying a little BBQ.  The market continued to deteriorate last week with distribution still going on, but this market is due for some kind of short term oversold bounce as indicated by stochastics.  Of course no indicator is perfect by itself and stochastics can remain in oversold territory for quite awhile, but the odds are there for a bit of a spike next week.  However, bears are still in control and outside of some short term trading opportunities on the long side, it’s probably best for most people to sit on the sidelines for a bit longer.  Keep an eye out for a rally in the indices to test resistance levels (Nasdaq – 200dma, Dow and S&P – 50 day moving averages). 

61508_nasdaq

61508_sp500

61508_dow


::: Model Portfolio :::

** This section will now appear as a separate report about every other Wednesday. 

The Self Investors Model Portolio wrapped up 2007 with a 30.2% gain and features annualized returns of 24%.  This is a REAL portfolio with position sizing and NOT the "hypothetical" portfolios you see with many stock trading services.

Would you like to receive buy and sell alerts within minutes (NEW! now get them via instant messaging in near real time) of each transaction in the portfolio?  You can receive these along with ALL of the tracking tools and video reports with the very popular Gold membership.  Don’t delay, get started today and join me for many more highly profitable months here at SelfInvestors.com.

::: Best/Worst Performers :::

– Top 10 Performing Industries For the Week –

1. Investment Brokerage: 5.35%
2. Major Airlines: 4.45%
3. Regional Airlines: 4.35%
4. Home Improvement Stores: 3.95%
5. Investment Brokerage: 3.90%
6. Appliances: 3.80%
7. Electronic Stores:  3.80%
8. Education & Training Services: 3.75%
9. Machine Tools & Accessories: 3.75%
10. Security Software & Services: 3.70%

– Top 10 Worst Performing Industries For the Week –

1. Beverages – Soft Drinks: -4.75%
2. Banks – Midwest: -1.75%
3. Farm Products: -1.55%
4. Banks – SE: -1.50%
5. Meat Products: -1.40%
6. Medical Practitioners: -1.35%
7. Beverages- Brewers: -.95%
8. Banks – Pacific: -.85%
9. Banks – Mid Atlantic: -.85%
10. Cigarettes: -.60%

– Top 5 Best Performing ETFs For the Week –

1. Ishares Broker/Dealers (IAI) 5.70% 
2. Japan Small Cap (JOF) 5.60%
3. SPDR  Metals & Mining (XME) 3.70%
4. Ishares Home Construction (ITB) 3.35%
5. HLDRS Semis (SMH) 3.30%

– Worst 5 Performing ETF’s –

1. KBW Banking (KRE) -1.90%
2. US Oil Fund (USO) -1.90%
3. Asa Limited Gold (ASA) -1.70%
4. US Natural Gas (UNG)  -1.30%
5. iShares Commodities (GSG) -1.20%

::: Upcoming Economic Reports (6/16/2008- 6/20/2008) :::

Monday:        NY Empire State Index, Net Foreign Purchases
Tuesday:       Building Permits, PPI, Housing Starts, Capacity Utilization, Industrial Production
Wednesday:  Crude Inventories
Thursday:      Initial Claims, Leading Indicators, Philly Fed
Friday:           None

::: Earnings I’m Watching This Week :::

Monday:
Adobe Systems (ADBE), Lehman Bros (LEH), Titan Machinery (TITN)

Tuesday:
Goldman Sachs (GS)

Wednesday:
Casella Waste Systems (CWST), FedEx (FDX), Lindsay Corp (LNN)

Nasdaq, a Double Top in the Making; Bears Firmly in Control

In any market, there will be differences of opinion but certainly at market tops and bottoms, the predictions become more bold.  I was reading a few articles over at Seeking Alpha and came across one guy (who manages money for a living by the  way) exclaiming that Thursday’s move was huge! He was  as bullish as could be just as many of the so called professionals on CNBC have been.  There is nothing wrong with having an opinion and the courage of your convictions, but where is the "money management"?  Where is the preservation of capital?  I don’t have the all answers but one thing I do have is a sense of when it’s time to ease up and err on the side of caution.  I realize there is incentive for Wall St to keep their clients invested, so you won’t hear the call to move to cash very often, but at the same time they fail to realize how just a little bit of integrity can go a long way. 

My approach is that the bulls are going to have to prove me wrong every time.  After all, down is the path of least resistance.  When the overall market takes out major long term trends lines in the first few months of the year, carves out a bear market rally and hits key resistance in the process, you damn well better believe I’m going to be cautious and recommend moving to cash or hedging your bets until the bulls can prove themselves.  It’s been the theme of late here at SelfInvestors and that didn’t change last week.

On Monday, I sent the following to members:
(you may receive my "almost" nightly market notes by registering at the top left)

Be in Cash or Be Hedged

"It had been relatively quiet in the financials ever since the Bear
Stearns debacle and the capitulation surrounding that certainly
created a bottoming process and paved the way for a run in the
indices which is where we sit now.  However, the magnitude of the
problems in housing and in skyrocketing oil prices don’t get sorted
out in a few months time.  Sure, you could argue that the economic
numbers haven’t been all that bad and the trend of weak, but better
than expected economic numbers certainly does continue.  Today the
ISM Manufacturing Index came in a bit weak and continued to indicate
some contraction, but came in better than expected and higher than
the previous month at 49.6.  BUT, how long can it last?  The US
economy is incredibly resilient as it proved after the tech bust and
Septemeber 11 attack but how much can it bend without breaking?  That
certainly remains to be seen and all predications are just
..predictions.  One thing is for certain though.  The indices are
indicating intermediate topping action following this healthy spring
rally.  As I mentioned in my weekend report, why not lock in some of
that hard earned profit and sit tight for a couple weeks and let the
economic data flow and the indices give us a better indication of
where it’s headed next?

On the technical side of things, the action in the indices could have
been far worse than where we closed.  Down 200 in the Dow at one
point, you got the feeling that maybe we’d get one of those big 300
– 400 point swoons.. something we haven’t seen in some time.
However, I was impressed by the way the market held it together and
staged a little rally at the end of the day.  Volume was not heavy
today and indicated fairly healthy profit taking following last week’s
advance.  The Nasdaq took out support of the 200 day moving average
again, but the S&P was able to hold above the 50 day moving average..
a somewhat remarkable feat considering the financial headlines today.

If you’re able to keep fairly close tabs on the market each day,
there are some good  trading opportunities out there on the long side
but I recommend hedging those with some short plays or simply buying
put options.  If you don’t have time to watch this market closely
right now, are an inexperienced trader and/or are accustomed to
longer hold times, I feel the best strategy is to sit on the
sidelines for a couple weeks to see how this pull back shakes out."

The following day, the selling was more severe and the following was sent to members:

Dow and S&P Have April Lows in Sight

"Today’s technical action was significantly more severe than
yesterday as sell volume came in above average indicating
institutional distribution.  It sets us up for further deterioration
in the coming days.  The S&P finally penetrated that 50 day moving
average which could be preparation for a move down to the April lows
at 1325.  The Nasdaq remains submerged below the 200 day moving
average and in all likelihood will test the 50 day moving average
around 2400.  The Dow is having the most difficulty and has taken out
both key support levels of the moving averages and will most likely
test the April lows in the 12200 range in the coming days."

Then we  got that out of blue move on Thursday, pushing the Nasdaq right to the brink of a potential breakout move.  There was some momentum behind it so I had to respect it to some degree, but still wary of a potential double top in the Nasdaq given the bearish signals of the previous days.  I sent the following to members Thursday night:

Nasdaq Within Striking Distance

"I have to admit, today’s move took me completely by surprise and the
action kind of reminded me of the irrational trading in the latter
half of 07 when it seemed the technicals didn’t matter much.
Earlier this week, we got significant distribution as the indices
slid further from important resistance areas.  The Dow looked down
right ugly.  Then bammo! A nearly 2% surge in the indices with a
little momentum behind it as the market seemed to ignore the
financial turmoil (a cut in ratings for Ambac & MBIA) that it had
sold off on just earlier in the week.  The trend of "better than
expected" economic numbers continued today with a decline in weekly
jobless claims and decent May retail numbers which some expect to be
strong again in June due to the stimulus of rebate checks.  Rather
than hurting the market today, a $5 surge in crude ignited the market
with energy leading the way with a more than 4% advance. 

So where does it leave us?  You know I’ve been mentioning that it’s
best to be cautious up here and I still think that is the best
strategy until proven otherwise
.   While this one day of trading does
negate some of the bearishness in the technicals recently, it
doesn’t signal that the coast is clear.  It’s still just one day of
trading likely fueled in large part by short covering.  I said that
if I was wrong and the indices broke out to new all time highs, than
I’d simply adjust my strategy and get more aggressive long.  With
today’s surge, the Nasdaq is sitting right on the May high which is
a significant source of resistance.  The S&P reclaimed support of the
50 day moving average and it just may hold that level.  As for the
Dow, it’s got significant technical damage to repair and today’s move was
a good start towards that.  For me to get increasingly long, I want
to see the Nasdaq take out that May high and close above it, then
pull back in an orderly fashion.  When the Dow re-tested its May high
on May 19th , it quickly sold off 700 points in a couple weeks so we
have to be mindful of a double top in the Nasdaq as well.
"

The Nasdaq wouldn’t come close to a breakout attempt on Friday as the unemployment rate spiked higher than expectations and crude soaring yet again to record highs with $150/barrel in sight.  The big surprise to me on Friday?  That the average work week came in at 33.7.. who the heck works less than 40 hrs anymore?  The action on Friday as downright ugly with institutions clearly dumping large positions.  Let’s take a look at the major indices below.

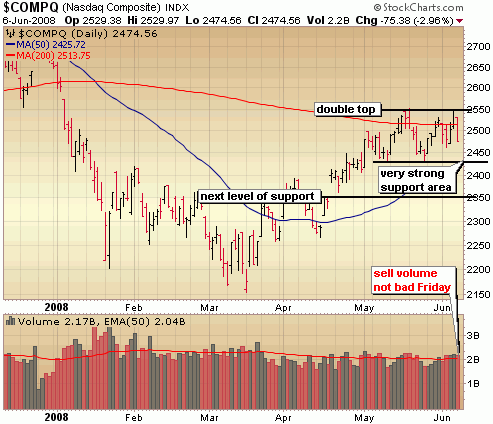
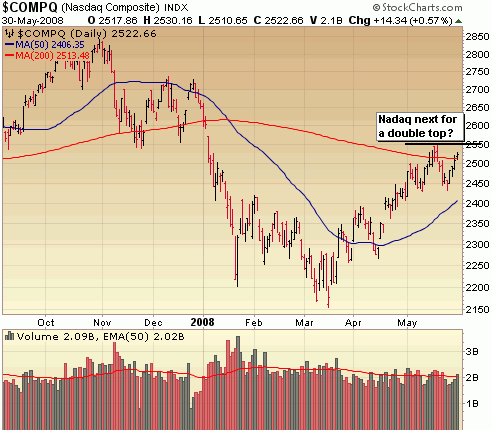
The Nasdaq is without a doubt leading the way and is actually in relatively decent shape up here, but I still think it needs to come back and test where the May lows and 50 day moving average converge around 2425.  It wouldn’t mind seeing it bounce around in this range for another month or two, setting it up for a breakout attempt above 2550.  Volume was not particularly intense on Friday which is encouraging.  Note the double top in the making at 2550.

 6708_nasdaq

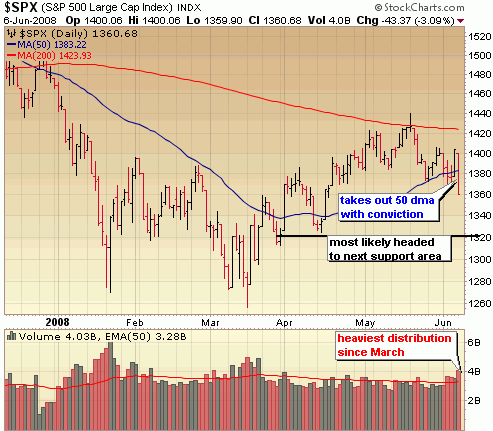
It’s a much different story in the S&P, which took out the June and May lows (and the 50 dma yet again) with big time conviction.  We could certainly see a bit of a bounce to come back and test what is now resistance of the 50 dma before testing the next level of support around 1320, but I wouldn’t bet on it. 

6708_sp500

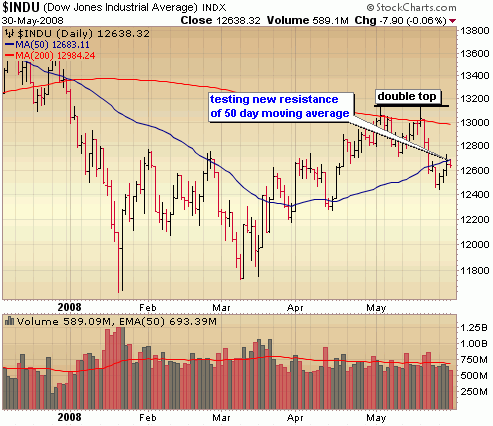
It gets even uglier in the Dow which has been sliding for weeks now, following a double top of its own up around 13200.  It’s sitting on some minor support area right now but given the fact it was down 400 on Friday with absolutely no buy interest throughout the day, it is just a matter of time before it starts trading down around those March lows. 

6708_dow

::: Model Portfolio :::

** This section will now appear as a separate report about every other Wednesday. 

The Self Investors Model Portolio wrapped up 2007 with a 30.2% gain and features annualized returns of 24%.  Would you like to receive buy and sell alerts within minutes (NEW! now get them via instant messaging in near real time) of each transaction in the portfolio?  You can receive these along with ALL of the tracking tools and reports with the very popular Gold membership.  Don’t delay, get started today and join me for many more highly profitable months here at SelfInvestors.com.

::: Best/Worst Performers :::

– Top 10 Performing Industries For the Week –

1. Agricultural Chemicals: 6.05%
2. Music & Video Stores: 3.60%
3. Healthcare Info: 2.90%
4. Independent Oil & Gas: 2.75%
5. Regional Airlines: 2.40%
6. Electronics Wholesale: 2.10%
7. Long Distance Carriers:  1.80%
8. Oil & Gas Equipment & Services: 1.50%
9. Wholesale – Other: 1.45%
10. Printed Circuit Boards: 1.40%

– Top 10 Worst Performing Industries For the Week –

1. Meat Productss: -10.60%
2. Banks – SE: -10.50%
3. Surety & Title Insurance: -10.10%
4. Advertising Agencies: -9.40%
5. Aerospace/Defense: -9.10%
6. Residential Construction: -8.50%
7. Auto Parts Wholesale: -7.90%
8. Banks – MidAtlantic: -7.75%
9. Jewelry Stores: -7.30%
10. Foreign Regional Banks: -7.20%

– Top 5 Best Performing ETFs For the Week –

1. Greater China Fund (GCH) 5.70% 
2. Turkish Invest (TKF) 5.60%
3. HLDRS Internet Architecture (IAH) 5.40%
4. Japan Small Cap (JOF) 5.20%
5. HLDRS Broadband (BDH) 4.65%

– Worst 5 Performing ETF’s –

1. iShares Silver (SLV) -6.25%
2. Thai Fund (TTf) -6.15%
3. Asa Limited Gold (ASA) -4.60%
4. Market Vectors Gold Miners (GDX)  -4.50%
5. iShares Gold (IAU) -3.90%

::: Upcoming Economic Reports (6/9/2008- 6/13/2008) :::

Monday:        Pending Home Sales
Tuesday:       Trade Balance
Wednesday:  Fed Beige Book, Treasury Budget, Crude Inventories
Thursday:      Export/Import Prices, Initial Claims, Retail Sales, Business Inventories
Friday:           CPI

::: Earnings I’m Watching This Week :::

Monday:
Exide (XIDE)

Tuesday:
Quality Systems (QSII)

Thursday:
China Medical Technologies (CMED)

Stock Market Offers Another Chance To Lock In Gains

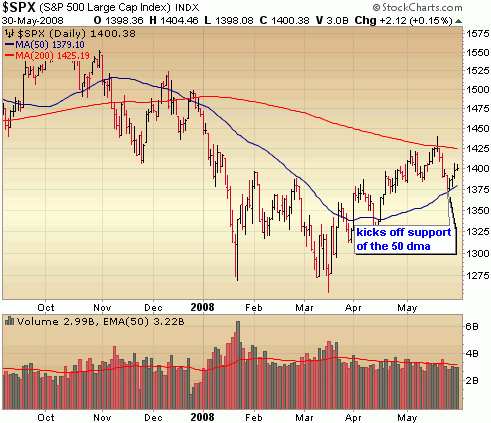
Lots of intraday swings in both the overall equities market and crude prices, with the end result at the end of the week being a small pull back in crude with a decent recovery in stock prices, following a dismal week of distribution.  With the S&P bouncing off the 50 day moving average and the Nasdaq reclaiming support of the 200 day moving average it’s time buy, buy, buy right?  Wrong!  I still believe we’re seeing some intermediate topping action in the indices and last week’s move up was just an oversold retracement of a bearish move.  If you didn’t lock in hard earned gains off that March bottom in mid May, now is your chance.  What if I’m wrong and the indices blow through their May highs with volume?  In the off chance that happens, then you just get back in with very little lost in potential on the long side.  Not much potential reward to give up for taking significant risk off the table in my opinion.

6108_nasdaq  

6108_sp500

6108_dow

::: Model Portfolio :::

** This section will now appear as a separate report about every other Wednesday. 

The Self Investors Model Portolio wrapped up 2007 with a 30.2% gain and features annualized returns of 24%.  Would you like to receive buy and sell alerts within minutes (NEW! now get them via instant messaging in near real time) of each transaction in the portfolio?  You can receive these along with ALL of the tracking tools and reports with the very popular Gold membership.  Don’t delay, get started today and join me for many more highly profitable months here at SelfInvestors.com.

::: Best/Worst Performers :::

– Top 10 Performing Industries For the Week –

1. Pollution & Treatment Controls: 8.10%
2. Personal Computers: 7.85%
3. Major Airlines: 7.60%
4. Consumer Services: 6.60%
5. General Contractors: 6.30%
6. Semiconductor – Integrated Circuit: 6.05%
7. Long Distance Carriers:  6.00%
8. Technical & System Software: 6.00%
9. Sporting Goods Stores: 5.45%
10. Textile – Apparel Clothing: 5.40%

– Top 10 Worst Performing Industries For the Week –

1. Gold: -4.80%
2. Banks – Mid Atlantic: -4.20%
3. Banks – SE: -4.10%
4. Cement: -4.05%
5. Silver: -4.05%
6. Tobacco Products: -4.00%
7. Dairy Products: -4.00%
8. Surety & Title Insurance: -3.75%
9. Industrial Metals & Minerals: -3.65%
10. Entertainment – Diversified: -3.20%

– Top 5 Best Performing ETFs For the Week –

1. Greater China Fund (GCH) 5.70% 
2. Turkish Invest (TKF) 5.60%
3. HLDRS Internet Architecture (IAH) 5.40%
4. Japan Small Cap (JOF) 5.20%
5. HLDRS Broadband (BDH) 4.65%

– Worst 5 Performing ETF’s –

1. iShares Silver (SLV) -6.25%
2. Thai Fund (TTf) -6.15%
3. Asa Limited Gold (ASA) -4.60%
4. Market Vectors Gold Miners (GDX)  -4.50%
5. iShares Gold (IAU) -3.90%

::: Upcoming Economic Reports (6/2/2008- 6/6/2008) :::

Monday:        Construction Spending, ISM Index
Tuesday:       Auto/Truck Sales, Factory Orders
Wednesday:  Productivity, ISM Services,  Crude Inventories
Thursday:      Initial Claims
Friday:           Nonfarm Payrolls, Unemployment Rate, Wholesale Inventories, Consumer Credit

::: Earnings I’m Watching This Week :::

Tuesday:
Layne Christensen (LAYN)

Wednesday:
Comtech Telecommunications (CMTL), Greif Brothers (GEF), Hovanian (HOV), Vimpel Comm (VIP)

Thursday:
Bio Reference Labs (BRLI), Ciena (CIEN), Focus Media (FMCN)

Friday:
A-Power Energy Generation Systems (APWR)

Nasdaq and S&P500 to Test Key Support As GDP Approaches

THANK YOU TO ALL THE BRAVE MEN AND WOMEN WHO HAVE MADE GREAT SACRIFICES FOR THIS GREAT NATION.  WE SALUTE YOU NOT JUST ON THIS MEMORIAL DAY, BUT EVERY DAY.

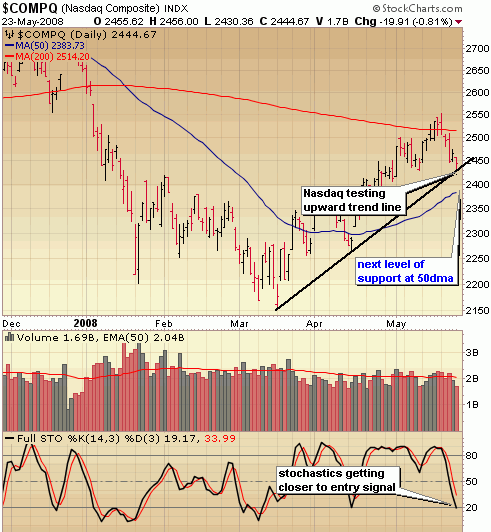
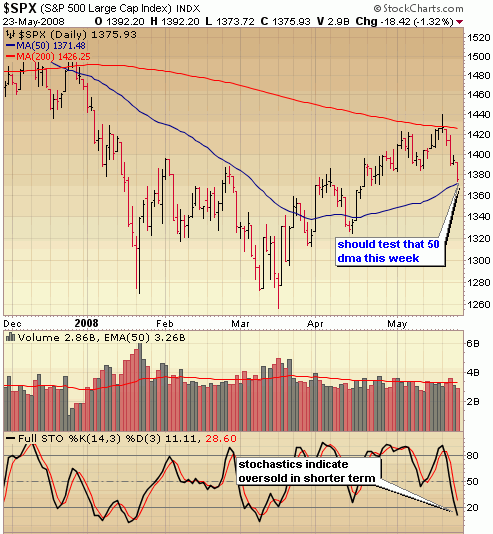
Last week we saw the indices take a much needed breather after an impressive run off those March lows and as expected the next level of key support levels are in the process of being tested – I’m referring to the upward trend line of the Nasdaq (see below) as well as the 50 day moving average of the S&P (see below).  At this point, the selling of last week doesn’t indicate anything other than significant profit taking and while there was distribution going on, I don’t think it’s enough at this point to completely derail the rally and take us back to the March lows.  What would be more of a concern is if the S&P and Nasdaq join the Dow in taking out their 50 day moving averages.  A breach of this area with high volume selling would in my opinion set us up for the possibility of a retest of those March lows.  We’ll just have to see how traders respond later in the week as they file in from a long weekend and ponder the GDP report on Thursday.  Taking a look at stochastics reveals the market is nearing oversold levels in the short term and likely due for some kind of bounce very soon.  I would not bite on that and get too aggressive too quickly.  I just think it’s really difficult to be aggressive on either side of the market right now and the best place to be is in cash. 

52608_naz

52608_sp500

::: Model Portfolio :::

** This section will now appear as a separate report about every other Wednesday. 

The Self Investors Model Portolio wrapped up 2007 with a 30.2% gain and features annualized returns of 24%.  Would you like to receive buy and sell alerts within minutes (NEW! now get them via instant messaging in near real time) of each transaction in the portfolio?  You can receive these along with ALL of the tracking tools and reports with the very popular Gold membership.  Don’t delay, get started today and join me for many more highly profitable months here at SelfInvestors.com.

::: Best/Worst Performers :::

– Top 10 Performing Industries For the Week –

1. Health Care Plans: 5.21%
2. Drugs – Generic: 3.10%
3. Medical Appliances & Equipment: 1.90%
4. Long Term Care Facilities: 1.40%
5. Oil & Gas Refining & Marketing: 1.30%
6. Home Health Care: .70%
7. Drug Related Products:  .55%
8. Music & Video Stores: .40%
9. Gold: .40%
10. Waste Management: .20%

– Top 10 Worst Performing Industries For the Week –

1. Major Airlines: -23.50%
2. Sporting Goods Stores: -12.40%
3. Residential Construction: -12.25%
4. Resorts & Casinos: -8.80%
5. Investment Brokerage – Regional: -8.70%
6. Semiconductor – Memory: -8.50%
7. Department Stores: -8.10%
8. Regional Airlines: -8.10%
9. Home Furnishing Stores: -8.10%
10. Surety & Title Insurance: -7.90%

– Top 5 Best Performing ETFs For the Week –

1. Ishares Silver (SLV)  7.60%
2. Market Vectors Nuclear Energy (NLR) 6.10%
3. US Natural Gas (UNG) 5.90%
4. United States Oil (USO) 4.60%
5. Central Fund of Canada (CEF) 4.00%

– Worst 5 Performing ETF’s –

1. SPDR Homebuilders (XHB) -12.60%
2. iShares Home Construction (ITB) -12.55%
3. Morgan Stanley China (CAF) -9.95%
4. Claymore China Real Estate (TAO)  -7.50%
5. iPath India (INP) -7.40%

:::  IPO’s Worth Watching for This Week :::

This section will now appear as a separate post on Mondays.

While 2008 should be a much slower year for IPO’s considering the deterioration of the market, there will continue to be some good companies coming to market here and there.  I’ll be highlighting the best IPO’s every Monday.

::: Upcoming Economic Reports (5/26/2008- 5/30/2008) :::

Monday:        None – Holiday
Tuesday:       Consumer Confidence, New Home Sales
Wednesday:  Durable Orders, Crude Inventories
Thursday:      GDP (prelim), Initial Claims
Friday:           Personal Income/Spending, PCE Core Inflation, Chicago PMI

::: Earnings I’m Watching This Week :::

Tuesday:
Donaldson (DCI), Shanda Interactive (SNDA), Wuxi Pharma Tech (WX)

Wednesday:
Jinpan (JST),  Synovis Life Technologies (SYNO), Esterline (ESL),

Thursday:
Caraco Pharmaceutical (CPD), Costco (COST), Netezza (NZ)

Friday:
China Finance Online (JRJC)

Tune Into the Charts, Tune Out the Talking Heads

How many times over the past couple weeks have you heard the so-called "experts" declare that now is a great time be adding stocks, despite the fact we had just run up more than 10% off a bottom created as a result of a severe correction.  Despite the fact that technical indicators were flashing overbought signals and most importantly, despite the fact that the character of the market was changing as traders looked for any nugget of bad news to lock in hard earned profits over the past couple months. 

As an independent self investor myself, part of what I try and do here at SelfInvestors.com is remind new traders that thinking for themselves is of utmost importance to successful trading.  By tuning out the talking heads and focusing on the technicals (price and volume, support and resistance, stochastics and MACD) of the major indices, it is possible to come very close to timing the market with great accuracy.  Will you always get in at the bottom and out at the top?  Absolutely not… but you can get a very good sense of when the market is beginning to turn.

I’ve talked a lot about the character change of this market recently and the slow shift to a more bearish tone.  All that was needed was a clear technical indication that a top was being put in.  The first technical red flag took place on Monday as the market reversed sharply off the lows.  In an email to my premium members I said:

"It’s been quite awhile since we’ve seen such a wild reversal
intraday and the action is somewhat significant.  I say somewhat
because although we had a dramatic end of day reversal in which the
S&P closed below important resistance of the 200 day moving average,
volume was not heavy.  Dramatic, high volume reversals indicate
topping action but this wasn’t quite the drama I was looking for to
indicate a top to this run and the Dow remains above the 200 day
moving average while the Nasdaq sits right on the mendoza line.  It
will be interesting to see if sellers can continue the momentum
tomorrow with more conviction. At any rate I still think this market
is tiring and caution is urged."

I was a bit hesitant in calling an absolute top to this run due to the lack of volume and wanted to see some continuation of the selling momentum the following day.  That’s exactly what we got which was confirmation that indeed we were topping.  Last night I sent the following to premium members:

"Following yesterday’s sharp end of day reversal in the major
indices, the market was primed and ready for a big, sustained move
down.  With inflation coming in a bit hot, a bearish outlook from an
Openheimer analyst of the banking sector and poor results out of Home
Depot and Target, today was the day that bears were finally able to
exert some strength.

I do think yesterday’s reversal and  today’s confirmation mark an
intermediary top.  It’s difficult to say just how far we pull back
at this point, but one thing is for certain -  remain extremely
cautious on the long side here.  I’ve finished production on a new
video review of the Model Portfolio and take a look at the major
indices as well…."

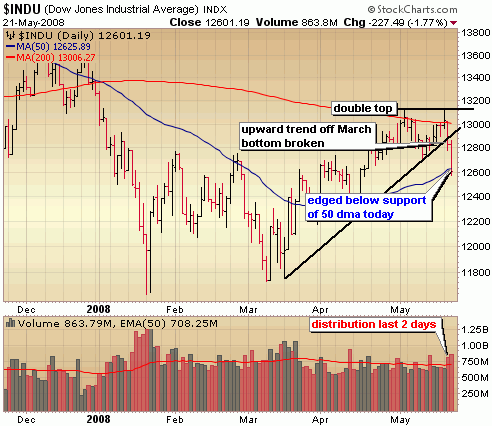
The selling didn’t let up at all today and the conviction on the sell side was considerably stronger than yesterday.  The Nasdaq and S&P appear to be well on their way to  testing the 50 day moving averages (an area where I might look to add a new long trade or two) and the Dow actually took out this important level of support today.  Given the magnitude of the selling over the past two days we’re probably due for a little bounce, but do not get sucked in.  This is significant technical damage over the past 2 days and will most likely lead to further deterioration in the coming days.

Let’s take a quick look at the charts:

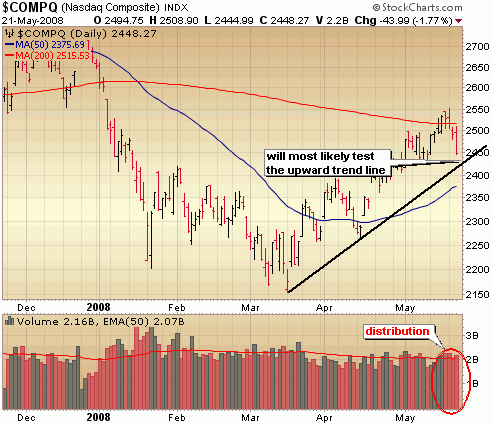
An ugly move in the Nasdaq today with a test of that upward trend line around 2425 almost certain.  If we take out that level of support, a test of the 50 day moving average becomes likely. 

52108_naz

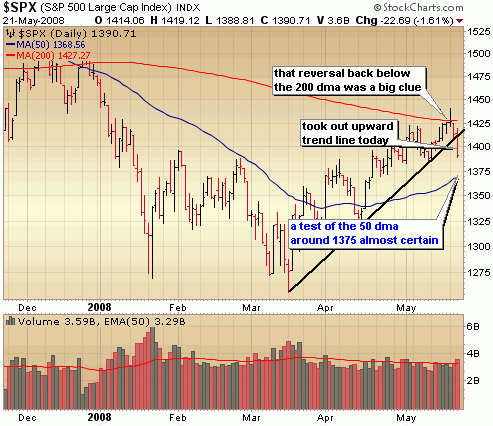
The S&P took out that upward trend line today with significant selling volume behind it.  The next major level of support around the 50 day moving average is  the next target.

52108_sp500

Note the double top in the Dow, followed by slicing and dicing of support levels – a breach of the 200 day moving average, then the upward trend line and today the 50 day moving average..  Given the magnitude of the selling over the past couple days, we could see a short term oversold bounce, but that should be short lived.  The doom and gloomers might begin calling for a test of those March lows, but I don’t think we’ll get that far.  More deterioration is ahead and staying away from the long side is still the best strategy, but the good news is that big opportunities will be created for those that missed this rally.

52108_dow

Selling in May Is Not a Bad Strategy

I’ve been talking quite a bit about the formiddable resistance areas the indices are now testing and not much has changed there, so I’ll keep it brief and just throw up the charts.  Actually, the real reason is that it’s Sunday and a real beauty in Seattle where I’m visiting for the weekend.  The last thing I want to be doing is discussing the market. 

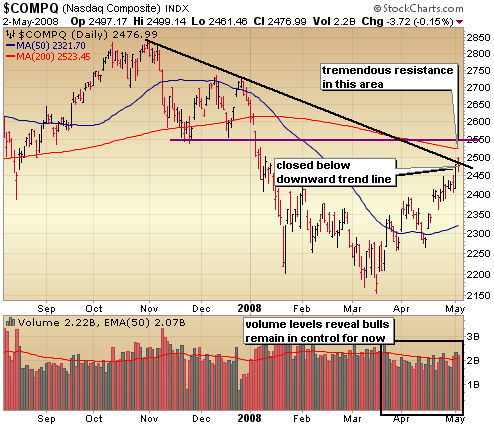
The Nasdaq briefly took out the downward trend line on Friday but ultimately closed below this important level of resistance.  While volume levels still indicate that bulls are in control, the market is currently very much oversold and facing formiddable resistance levels.  I think we could get another 2% out of this run, but I’ve already begun paring back long positions.  Be on the lookout for distribution or churn days to signal that this run has fully run its course.  We haven’t seen this yet, but it should happen soon.

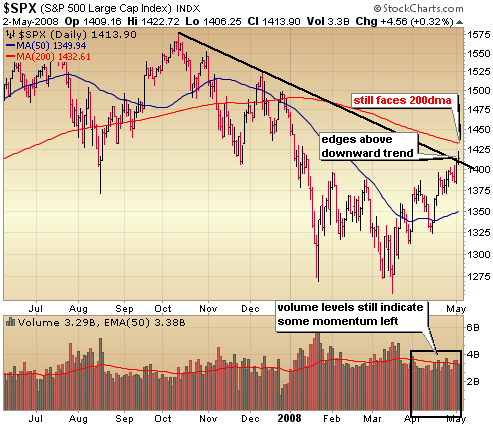
The S&P cleared and held above the downward trend line on Friday, clearing the way for a potential test of the next level of resistance around the 200 day moving average.  There appears to be some momentum left in this market which should carry the S&P up to this level, but as I said above be on the lookout for distribution.  That will signal the beginning of the end for this rally.

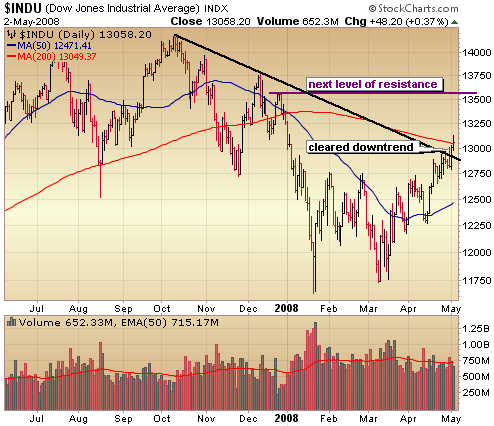
I mentioned in the last report that I thought it would be difficult for the Dow to get above the downward trend line and if so it would still have to face tough resistance of the 200 day moving average.  Well, it’s cleared the downtrend and briefly nudged above the 200 day moving average.  An impressive showing for the Dow for sure and if distribution doesn’t show up soon it could very well test the next level of resistance just above 13500. 

The bottom line is that this market has come quite far, quite fast as the indices negotiate tough resistance levels heading into what is notoriously a very difficult month for the market.  Beginning a month ago, I was adding positions on the pull backs but now I’m selling into rallies rather then waiting for a big day of distribution.  Essentially I’m getting much more conservative after locking in some big profits over the past few weeks and will stick to very short term trading over the next several weeks to capitalize on any additional strength.  If you’re not a short term trader, it probably makes sense to move a big portion to cash over the next month or so. 

::: Model Portfolio :::

** This section will now appear as a separate report about every other Wednesday. 

The Self Investors Model Portolio wrapped up 2007 with a 30.2% gain.  Would you like to receive buy and sell alerts within minutes (NEW! now get them via instant messaging in near real time) of each transaction in the portfolio?  You can receive these along with ALL of the tracking tools and reports with the very popular Gold membership.  Don’t delay, get started today and join me for many more highly profitable months here at SelfInvestors.com.

::: Best/Worst Performers :::

– Top 10 Performing Industries For the Week –

1. Major Airlines: 13.05%
2. Confectioners: 12.65%
3. Credit Services: 8.85%
4. Asset Management: 8.65%
5. Regional Airlines: 8.20%
6. Education & Training Services: 7.80%
7. Long Term Care Facilities:  7.45%
8. Food Wholesale: 7.20%
9. Toy & Hobby Store: 6.90%
10. Grocery Stores: 6.70%

– Top 10 Worst Performing Industries For the Week –

1. Heavy Construction: -7.40%
2. Farm Products: -6.85%
3. Music & Video Stores: -6.30%
4. Nonmetallic Mineral & Mining: -6.20%
5. Silver: -6.05%
6. Cigarettes: -5.20%
7. Copper: -5.00%
8. Packaging & Containers: -4.95%
9. Agricultural Chemicals: -4.90%
10. Medical Practitioners: -6.00%

– Top 5 Best Performing ETFs For the Week –

1. Greater China Fund (GCH)  11.30%
2. Morgan Stanley China (CAF) 11.20%
3. Japan Small Cap (JOF) 7.20%
4. iShares Brazil (EWZ) 6.60%
5. Morgan Stanley (IIF) 5.40%

– Worst 5 Performing ETF’s –

1. Market Vectors Agribusiness (MOO) -5.20%
2. Market Vectors Gold Miners (GDX) -4.75%
3. Asa Gold (ASA) -4.60%
4. SPDR Materials (XLB)  -3.35%
5. Malaysia Fund (MAY) -3.30%

:::  IPO’s Worth Watching for This Week :::

This section will now appear as a separate post on Mondays.

While 2008 should be a much slower year for IPO’s considering the deterioration of the market, there will continue to be some good companies coming to market here and there.  I’ll be highlighting the best IPO’s every Monday.

::: Upcoming Economic Reports (5/4/2008- 5/9/2008) :::

Monday:        ISM Services 
Tuesday:       None
Wednesday:  Productivity, Pending Home Sales, Consumer Credit, Crude Inventories
Thursday:      Initial Claims, Wholesale Inventories
Friday:           Trade Balance

::: Earnings I’m Watching This Week :::

Monday: 
Alpha Natural Resources (ANR), Cleveland Cliffs (CLF), Continental Resources (CLR), eResearch (ERES), Gafisa (GFA), Partner Communications (PTNR), Tidewater (TDW), Vulcan Materials (VMC)

Tuesday:
Banco Itau (ITU), Blue Nile (NILE), Cisco (CSCO), Corrections Corp (CXW), DR Horton (DHI), Henry Schein (HSIC), NYSE Euronext (NYX), Simcere Pharma (SCR), Sun Hydraulics (SNHY), Synchronoss Tech (SNCR), Ultra Petroleum (UPL)

Wednesday:
AirMedia (AMCN), Allis Chalmers (ALY), American Oriental (AOB), Clean Harbors (CLHB), Credicorp (BAP), Crocs (CROX), Devon Energy (DVN), Expeditors Intl (EXPD), Foster Wheeler (FWLT), FTI Consulting (FTI), Hansen Natural (HANS), Mindray Medical (MR), Perini Corp (PCR), T3 Energy Services (TTES), Yamana Gold (AUY), Transocean (RIG)

Thursday:
Aecom (ACM), Akeena Solar (AKNS), Arena Resources (ARD), Balchem (BCPC), Ceco Environmental (CECE), Dawson Geophysical (DWSN), Delta Petroleum (DPTR), Flotek (FTK), Global Industries (GLBL), Koppers Holdings (KOP), NGAS Resources (NGAS), Nvidia (NVDA), Pioneer Drilling (PDC), Priceline.com (PCLN), Ricks Cabaret (RICK), NASDAQ Group (NDAQ), Toyota Motor (TM), Unibanco (UBB), Watson Wyatt (WW)

Friday:
Rosetta Resources (ROSE), US Global Investors (GROW)

::: In Case You Missed It – SelfInvestors Blog Entries of the Past Week :::

1. Barry Hot on the Heels of the Plunge Protection Plunge Team

2. Visa (V) Vs. Mastercard (MA): Earnings Results

3. Peak Oil, Peak Water.. We’re All Gonna Die

4. Buying International Stocks


Beware ‘O Major Resistance in Indices

I’ll keep it fairly short this week.  The indices haven’t done much since my last analysis and still look considerably bullish but that could change in a hurry as major resistance of the downward trends loom.  As mentioned in the last analysis, where is the leadership going to come from if the oil and the ags continue to deteriorate?  Is tech ready to finally step up in a big way?  I don’t think it’s quite ready to do that. 

After a more than 10% rise off those March lows I believe it’s time to begin getting more conservative and taking some profit off the table, especially if a big distribution day appears which we haven’t seen in quite some time.  Let’s have a look at the indices.

You see that the volume levels still look good as buy volume continues to outweigh sell volume.  There is certainly enough momentum to push us higher but keep a very close eye on that big resistance area of the downtrend.  I think we’re going to have a heck of a time getting above that. . and if we do?  Resistance of the 50 day moving average is not far behind. 
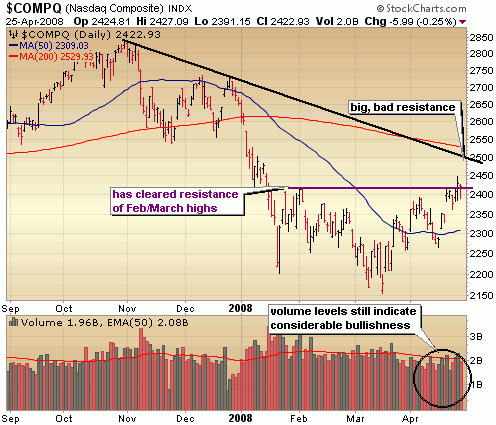
42708_naz

The S&P edged up just a bit above resistance of the Feb highs and it too has some life left in it.  I do think we’ll test that major resistance area of the downward trend at some point fairly soon.  When we do, it’s time to take some chips off the table.  Keep an eye out for a big, high volume reversal day which
often signals topping action.

42708_sp500

Well how about the Dow! It’s already testing this major source of resistance.  The battle between buyers and sellers should be mighty interesting next week.  I mentioned the high volume reversal as a signal of topping action.  Also keep an eye out for churning which is a higher volume day than the day before with very little price progress.  That’s an indication that institutions are selling into rallies.
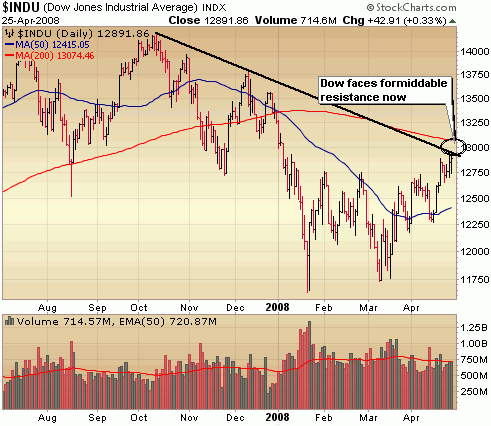
42708_dow

::: Model Portfolio :::

** This section will now appear as a separate report about every other Wednesday. 

The Self Investors Model Portolio wrapped up 2007 with a 30.2% gain.  Would you like to receive buy and sell alerts within minutes (NEW! now get them via instant messaging in near real time) of each transaction in the portfolio?  You can receive these along with ALL of the tracking tools and reports with the very popular Gold membership.  Don’t delay, get started today and join me for many more highly profitable months here at SelfInvestors.com.

::: Best/Worst Performers :::

– Top 10 Performing Industries For the Week –

1. Toy & Hobby Stores: 13.15%
2. Hospitals: 11.55%
3. Processing Systems & Products: 8.75%
4. Education & Training Services: 8.70%
5. Consumer Services: 6.70%
6. Investment Brokerage: 6.50%
7. Networking & Comm Devices:  6.30%
8. Research Services: 5.70%
9. Technical & System Software: 5.35%
10. Personal Services: 5.10%

– Top 10 Worst Performing Industries For the Week –

1. Computer Based Systems: -11.45%
2. Surety & Title Insurance: -10.55%
3. Silver: -10.20%
4. Major Airlines: -9.50%
5. Aluminum: -7.65%
6. Electronics Wholesale: -7.65%
7. Gold: -7.35%
8. General Entertainment: -7.00%
9. Music & Video Stores: -6.35%
10. Specialty Eateries: -6.00%

– Top 5 Best Performing ETFs For the Week –

1. MorganStanley China (CAF)  17.10%
2. SPDR China (GXC) 8.00%
3. Greater China Fund (GCH) 7.60%
4. Claymore China Real Estate (TAO) 7.45%
5. Ishares China (FXI) 7.40%

– Worst 5 Performing ETF’s –

1. Market Vectors Gold Miners (GDX) -8.05%
2. Asa Gold (ASA) -6.90%
3. iShares Silver (SLV) -5.60%
4. Powershares Agriculture (DBA)  -5.25%
5. Central Fund of Canada (CEF) -4.90%

:::  IPO’s Worth Watching for This Week :::

This section will now appear as a separate post on Mondays.

While 2008 should be a much slower year for IPO’s considering the deterioration of the market, there will continue to be some good companies coming to market here and there.  I’ll be highlighting the best IPO’s every Monday.

::: Upcoming Economic Reports (4/28/2008- 5/2/2008) :::

Monday:        None
Tuesday:       Consumer Confidence
Wednesday:  Fed Rate Decision, GDP, Chicago PMI, Crude Inventories
Thursday:      Auto/Truck Sales, Initial Claims, Personal Income/Spending, PCE Core Inflation
                      Construction Spending, ISM Index
Friday:           Nonfarm Payrolls, Unemployment Rate, Factory Orders


::: Earnings I’m Watching This Week :::

Monday: 
Authentec (AUTH), BE Aerospace (BEAV), CDC Corp (CHINA), China National Offshore (CEO), Flowserve (FLS), FMC Technologies (FTI), Gen-Probe (GPRO), GFI Group (GFIG), Integral Systems (ISYS), Interactive Intelligence (ININ), Manitowac (MTW), Mastercard (MA), Portfolio Recovery Associates (PRAA), SOHU.com (SOHU), Southern Peru Copper (PCU), Titan Machinery (TITN), Visa (V)

Tuesday:
American Ecology (ECOL), American Medical Systems (AMMD), Archer Daniels Midland (ADM), Banco Bradesco (BBD), Compania de Minas Buenaventura (BVN), Countrywide Financial (CFC), Cybersource (CYBS), Express Scripts (ESRX), General Cable (BGC), Genesee & Wyoming (GWR), Monolithic Power Systems (MPWR), Open Text (OTEX), Ritchie Bros (RBA), Santander Central Hispano (STD), TheStreet.com (TSCM), Under Armour (UA), VistaPrint (VPRT)

Wednesday:
Centex (CTX), Central European (CEDC), Central European Media (CETV), Chicago Bridge & Iron (CBI), Concur Tech (CNQR), Cummins (CMI), First Solar (FSLR), Garmin (GRMN), Intellon (ITLN), Oceaneering (OII), Omniture (OMTR), Proctor & Gamble (PG), Psychiatric Solutions (PSYS), Strayer Education (STRA), Tetra Tech (TTEK)

Thursday:
Bankrate (RATE), Cameron (CAM), Chart Industries (GTLS), Chesapeake Energy (CHK), Comcast (CMCSA), ExxonMobil (XOM), Green Mountain Coffee Roasters (GMCR), Hologic (HOLX), Hornbeck Offshore (HOS), Investools (SWIM), Natus Medical (BABY), Noble Energy (NBL), Novamed (NOVA), Pride Intl (PDE), Rowan Companies (RDC)

Friday:
Agrium (AGU), Chevron (CVX), Intercontinental Exchange (ICE)

::: In Case You Missed It – SelfInvestors Blog Entries of the Past Week :::

1. Google Catalyst for Big Break, But Big Resistance Remains

2. Hot IPO’s: Intrepid Potash (IPI) & American Water Works (AWK)