Apologies for not getting the weekly report out this Sunday. With a major move in the works for me and scrambling to get caught up after a few weeks off, it’s going to take a few more days to get back into full swing. My priorities will change a bit this year as well. No more all nighters getting blog posts up, updating databases, researching, etc.
First and foremost, my health and time with friends and family will come first. I’ve made many sacrifices over the past four years to create this site and it’s now getting much closer to the point where I’m happy with it. That’s not to say I won’t continue to work hard and present profitable ideas here, it’s just that at times posting here may be a bit on the the light side. Helping fill out the blog in 2008 will be the insights of 3 great bloggers, two of which you may have read late last year – Robert Williams (oil industry reports) and Barry Brush (options extraordinaire). This year, I think you’ll also enjoy reading articles from Lance Chastain, a serial entrepreneur bursting with insights and knowledge on personal and business success. It will be a great contrast to the trading talk.
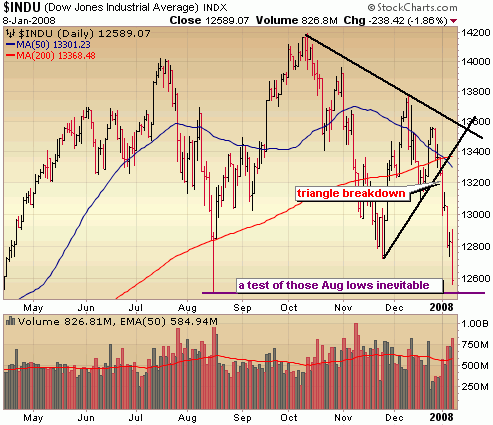
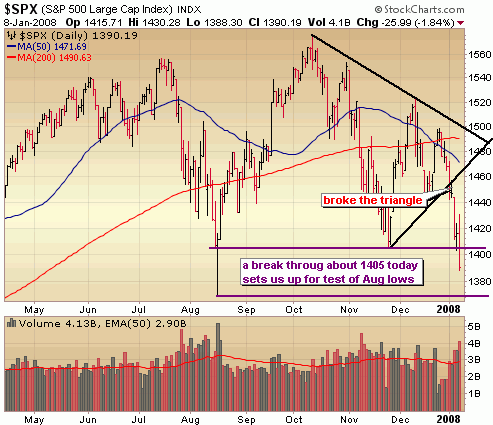
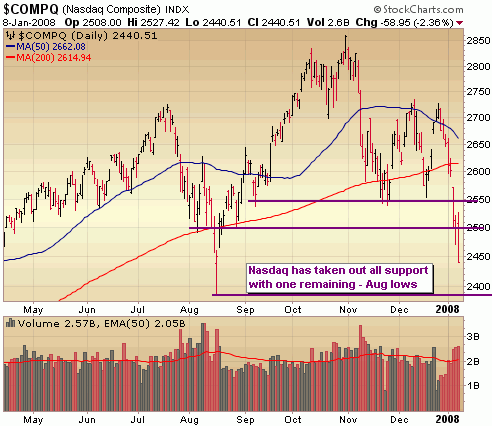
What a week to start 08 though! With today’s loss, it marks the worst start to the S&P ever. Yikes. The Nasdaq is already down 8% this year. In my last market report I mentioned that the bulls and bears had drawn the lines in the sand, with the Dow and S&P carving out triangle formations and the Nasdaq holding above key support around 1550. A break down below those levels in the Dow and S&P last Wednesday was warning signal number 1 and on Friday when the Nasdaq took out key support, that was warning signal number 2. The lines were drawn out in the charts and the bears have won. There isn’t any other way to say it. Yes, this is officially a bear market.. for the most part. More on that below.
Having said that we are reaching oversold conditions in the short term and there will be some great trading opportunities on the long side very soon. It looked as if today we might begin a weak oversold bounce following yesterdays minor reversal off the lows. However, rumor of a Countrywide Financial (CFC) bankruptcy filing later this week took the wind out of a mid day rally and just as the market began to recover, the AT&T CEO mentioned at a conference that the company faces softness from the consumer and that the company is disconnecting more home-phone and high-speed Internet customers for failing to pay their bills. This isn’t earth shattering news but indicates the market was looking for an excuse to sell. It was a dramatic reversal in the last 2 hours of trading today and volume was heavy indicating an exodus by the institutions.
The daily charts below show the breakdown out of the triangle formations in the Dow and S&P and the setup for a test of those August lows. I’ll be looking for some kind of capitulation below those August lows as an entry point to get fairly aggressive on the long side for a few weeks.
.. and in the Nasdaq, it’s break after break of support over the past several days setting up a showdown at the August lows around 2400. Again, looking for some panic selling around this area and resulting capitulation as a signal to get long.
Bear Market Emerges
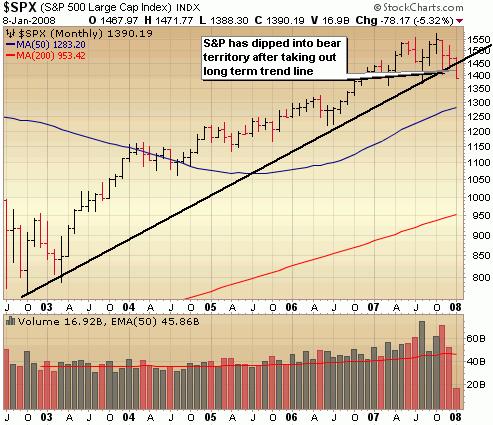
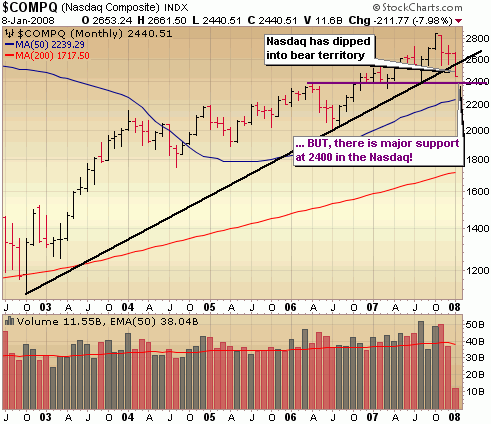
While the Dow sits right on the bear/bull mendoza line, both the S&P and Nasdaq have crossed over to the grizzly side by taking out long term trend lines. Taking a look at the monthly charts you see the break of the trends but with major support levels close by.
Dow 12500, just 89 points aways is a critical support level. Remember that it’s highly possible we dip below that level which could trigger some panic selling. The important thing is how the market closes. I wouldn’t mind seeing a big flush of sellers tomorrow. Down another couple hundred more intraday, followed my some massive end of day buying. That’s my signal to get back in with more aggression on the long side.
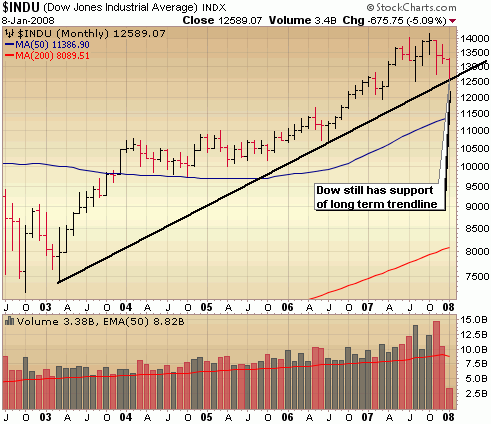
The break below of the trend line that has defined the bull market over the past nearly 5 years signals a bear market in my opinion. While we’re oversold in the short term and sizable rally will provide more short opportunities. New major resistance around 1450.
The Nasdaq has also signaled a bear market with a breach of the long term trend line. Look for a drop to major support around 2400 as an opportunity to trade on the long side for a bit, but ultimately this is a bear market and short positions should play a major role in your portfolio this year.
::: Model Portfolio :::
** This section will now appear as a separate report to be published on Wednesdays. I’ll have a special end of year 2007 review of the Model Portfolio up tomorrow night or Thursday morning.
Would you like to receive buy and sell alerts within minutes of each transaction of the Model Portfolio? You can receive these along with ALL of the tracking tools and reports with the very popular Gold membership. Don’t delay, get started today and join me for many more highly profitable months here at SelfInvestors.com.
::: Best/Worst Performers :::
– Top 10 Performing Industries For the Week –
1. Gold: 9.55%
2. Drug Manufacturers – Major: 3.85%
3. Research Services: 2.30%
4. Beverages – Soft Drinks: 1.75%
5. Cigarettes: 1.65%
6. Health Care Plans: 1.50%
7. Farm Products: 1.45%
8. Specialized Health Products: 1.45%
9. Drugs Manufacturers – Other: 1.00%
10. Building Materials Wholesale: .95%
– Top 10 Worst Performing Industries For the Week –
1. Mortgage Investment: -19.15%
2. Residential Construction: -18.30%
3. Major Airlines: -16.25%
4. Surety & Title Insurance: -16.00%
5. Banks – SE: -15.25%
6. Semiconductors – Integrated Circuit: -14.50%
7. Personal Computers: -14.15%
8. Recreational Vehicles: -13.85%
9. Semiconductors – Broadline: -12.95%
10. Resorts & Casinos: -12.85%
– Top 5 Best Performing ETFs For the Week –
1. Market Vectors Gold Miners (GDX) 10.85%
2. Asa Limited Gold (ASA) 8.65%
3. Central Fund of Canada (CEF) 6.10%
4. Ishares Silver (SLV) 6.05%
5. US Natural Gas (UNG) 5.90%
– Worst 5 Performing ETF’s –
1.
2. SPDR Home Builders (XHB) -16.80%
3. Powershares Dynamic Semis (PSI) -14.00%
4. Thai Fund (TTF) -13.40%
5.
::: IPO’s Worth Watching for This Week :::
This section will now appear as a separate report on Mondays, however with the beginning of a new year and the market struggling there are no IPO’s expected to begin trading over the next few weeks. It might not be until February until we get new IPO’s coming to market.
::: Upcoming Economic Reports (
Monday: None
Tuesday: Pending Home Sales, Consumer Credit
Wednesday: None
Thursday: Initial Claims, Wholesale Inventories, Crude Inventories
Friday: Export/Import Prices, Trade Balance, Treasury Budget
::: Upcoming Notable Earnings Reports :::
Earnings season doesn’t begin ramping up until next week!