What is the General Market?
Dow Jones Industrial Average
Consists of 30 larger, cyclical and industrial issues
S&P 500
Broader, more modern representation of the Dow
Nasdaq Composite
More relevant to the growth investor; comprised of younger, faster growing companies
S&P 600, Russell 2000
Indexes comprised of much smaller companies than Nasdaq; the majority of the stocks I follow
These are the indices that will be watched for confirmation of a new bull market or signs that the bull has run its course and the bear will soon be in charge. The links above provide you with a chart of the index. Each day, it’s important to look at the price and volume action as well as support and resistance areas on the chart.
Market Cycle: Bulls Vs. Bears
Market cycles tend to follow the health of the economy, but keep in mind that the market always looks several months into the future. In other words, bear markets end while the economy is still struggling and bull markets end before recession hits. Bear markets are necessary to clean up prior excesses and the clear the way for a new bull market with new leaders. The frenzied stock buying of the late 90’s and the subsequent crash thereafter is a great example of "the greater the rise, the greater the fall".
- Bull markets average around two years, while average bear markets run their course in around nine months.
- Stock open strong and finish weak in bear markets, open weak and finish strong in bull markets
Is It a Bull or a Bear?
OK, so how do you time the market so that you are fully invested long in a bull market while staying in cash and/or shorting the market in a bear market? There are clues you can look for to help you determine the direction of the market. The price and volume action of the market and leading stocks are of primary importance.
Price and Volume Action of the Market
This is perhaps the most important of the indicators and should be watched closely. During a bull market, the action in the market indices should be watched for evidence of a market top.
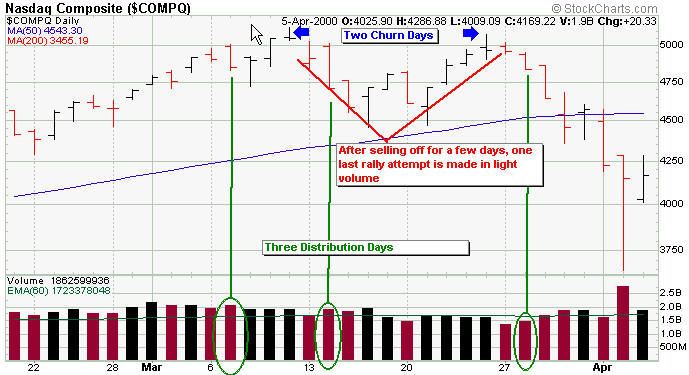
Characteristics of a Market Top
-
Churning
Increasing volume but no price progress -
Distribution
Price closes lower than the day before on higher volume than the day before. -
Reversal Days
The index closes at the low point of the day on higher volume than the day before
| NOTE: Add the number of churning, distribution and reversal days together. If you get 3-5 over the course of 1-3 weeks, the market may be topping |
- After the first selling near the market top, the market averages will sell off for a few days on lower volume and then attempt to rally to near the previous high before beginning to fold under heavy volume (an indication that more investors are catching on to the weakness). The idea is to get out before the market reaches this point!
Example: the chart below shows the distribution and churning at the top of the market in March of 2000.. right before the big crash.
- The Dow and Nasdaq may move in opposite directions, signaling weakness. You like to see a broad market rally.
Characteristics of a Market Bottom: Signaling a New Bull Market
Rules for confirming a new rally are as follows:
1. A rally attempt begins on a day when the market closes higher
2. On the 4th – 7th day from the initial increase in the market look for a follow through (a 2% or more gain on heavier volume than the day before.. preferably above average). A follow through may occur on any of the three indices to qualify as a rally confirmation.
| IMPORTANT: A follow through later than day 7 indicates a weak uptrend and a follow through before day 4 may indicate short covering. A confirmation in days 4-7 indicates real buying by institutions. |
The following chart shows the confirmation of a rally on March 17, 2003 that kicked off the new bull market)
The Action of Leading Stocks
A second very important indicator is the action of leading stocks. Every bull market needs leading stocks breaking out to new highs from sound bases. As a few of these leaders start to break down, the general market may not be far behind. Here are the signs a leader is running out of gas:
Confirming a New Bull With Leading Stocks
-
After you have confirmed a new rally it’s very important to watch the action of leading stocks to see if they can break out. Don’t buy stocks with reckless abandon at this point because you’re not sure if a new bull market is on the horizon. Maybe buy half your position and set your stop loss level at 5% instead of the usual 8% (see selling for more on preserving capital).
| IMPORTANT: Not all confirmed rallies lead to a new bull market, but no new bull market can begin without one |
-
If in fact, new leaders are breaking out of sound bases to new highs it is now OK to become fully invested.
Leading Stocks Provide Clues to Market Top
As the bull run comes to an end, the action of leading stocks may provide clues for you to get out before the rest of the market tanks. Some clues to look for
-
3rd and 4th Stage Bases
As a stock begins to form a 3rd stage base, more people are catching on to the strength of the market, so it becomes less likely there will be enough buyers left to propel the stock out of the base to further gains. Carving out a fourth stage base rarely happens… it’s around this time that you’ll begin to start hearing stock recommendations from your Uncle Larry. Time to sell!
Rules For Counting Bases
1. Start counting your bases after the stock reaches $10/share (before splits)
2. To qualify as a base it needs to occur after a prior uptrend of at least 30%
3. Bases must be at least 7 weeks in length
4. The base must be a correction of more than 20% to qualify
5. In order to reset the count, the stock must undercut the lows of its most recent base and remain there for a considerable period
Example: The chart below highlights the three bases formed and the subsequent failure after the third base in Teva Pharmaceuticals. Notice the break below the 200 Day Moving Avg (Red Line) on high volume for the first time in nearly two years. If the failed breakout didn’t entice you to sell, this red flag should have been your final clue!
- The Big Frenzied Runup: A Climax Top
Some leaders will exhibit what’s called a climax top. The hype surrounding the stock and/or the market can create a surge in buying where a stock will increase 20%, 30%,40% in a very short time. At this time, just about everyone, including uncle Larry owns the stock. It’s probably been featured in several investment magazines. After the climax top you may see churning or a sharp reversal in price which would be the final indication that the run is over.
Example: You can see the frenzied buying occurred on December 29, when the stock surges $32/share on 3X the normal volume on an Exhaustion Gap (the stock opens higher than the previous close due to buying in the after hours market). The very next day you see a major gap up, before a Sharp Price Reversal. (Sell Signal #1). Two days later, there was another large gap open, followed by another Sharp Price Reversal (Sell Signal #2).
- Not Making Money
If you haven’t made a dime on your last five purchases it may be a sign that the market isn’t healthy..… or that you need to study this tutorial a few more times!
-
A Shift To Defensive Stocks
Look for a shift to utilities, foods, tobaccos, etc. as a sign that a weaker market may be ahead.
Investor Psychology
Gauging the feelings of investors about the market is also important in determining the health of the market. The reason for this is fairly simple. If the majority of investors are bullish, there are few buyers left to power the market higher. There is only one place for the market to go… down, as the sellers return. If the majority is bearish, there are few sellers left to send the market down further. Bargain hunters begin to smell an opportunity. As more and more money builds on the sidelines, a positive shift in perceptions will usher in a flood of cash and lead to a new bull market.
In any sustained bull market, it’s necessary to have people concerned about the economy, interest rates or stock valuations. These people sitting on the sidelines and/or shorting stocks provide a lot of capital down the road when they are finally convinced that the bull market is for real. When they do, it’s at this time that you may have the makings of a climax top, tempting the pros to sell. You should be selling too.
The following indicators help to gauge the feelings of investors about the market (however, keep in mind that these indicators are of secondary importance). The price/volume action of the market, the action of leading stocks and interest rates are of primary importance.
Gauging the Herd Mentality
-
Put/Call Ratio
When investors buy calls they are betting that the market will move higher. If they buy puts, they are betting that the market will move lower. If the Put-to-Call Ratio is greater than 1, more investors are betting the market will head lower. Since the majority is usually wrong, a spike up in the ratio may signal a market bottom. -
Advisory Newsletters
The newsletters are generally bearish at the bottom and bullish at the top… the majority is usually wrong! -
Short-Interest Ratio
Measures the total number of shares being shorted vs. the NYSE’s average daily volume. A value of 3 indicates 3 days of short interest… the larger the number, the more shares are being shorted as investors become bearish. A few spikes in the short interest during a bear market could indicate a bull is just around the corner. The crowd is usually wrong! -
Public/NYSE Specialist Short Sales
Another short indicator measuring the ratio of public selling short to NYSE Specialists selling short. A spike in this ratio may indicate the bottom of the market… once again, the crowd is usually wrong!