Category Archives: Weekly/After Stock Market Review Archives

Every Sunday evening a full market review is sent to members of SelfInvestors.com which provides commentary on the technical and economic picture, a review of the SelfInvestors Model Portfolio, the best/worst performing industries and ETF’s for the week, IPOs to watch, upcoming economic reports as well as notable earnings reports. In addition, on days when the market makes a significant move I’ll highlight the technical action discussing price/volume movements and support/resistance levels, industries/sectors leading and lagging the market as well as a Stock of the Day. In the past these were sent in the middle of the trading day but I’ve since begun publishing them and sending them to members after the market closes. These reports will be archived here as well.

Another Great Depression Stock Market?

Much has been made of the similarities between current times and the Great Depression.  The first leg down of each crash creating fear that a complete financial collapse was imminent, only to be averted by massive liquidity fueling hope and optimism, at least for a short time.  If history does indeed repeat itself (and it often does in the stock market), then there is reason for Great concern. 

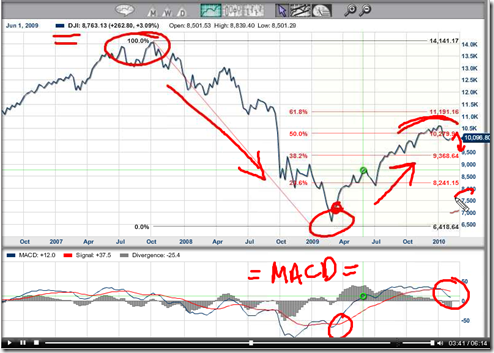
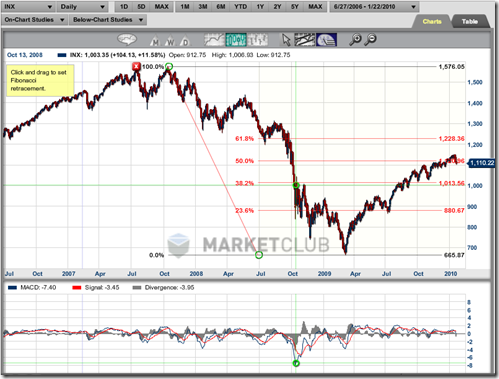
We’ve now completed the first big crash (in the latter half of 2008), followed by the first big retracement of around 50%.  Now, just like then, there are many that feel we’re out of the woods with some talking heads even calling for a new bull market.  A 50% retracement rally in less than a year will do that.  Nobody knows how all this plays out, but with the growing debt issues, the coming increase in taxes, growing government control and the and the fear of skyrocketing inflation down the road, it’s not exactly conducive to a rip roaring economy. .. and you can’t ignore the similarities to 1929.  At the very least, we’ve got an extremely bumpy road ahead and it’s going to pay to be extremely cautious in the coming years.

Below is a great video done by Adam Hewison of Market Club taking a look at the stock market in 1929 vs 2010 through the Dow.  He brings up a good point that many baby boomers have already been hit hard once, recovered much of losses and will likely do anything to protect what’s left of their nest egg which includes exiting the stock market completely.  Perhaps that’s a train that can’t stopped no matter how much money the government throws at it.

Click to view the video

dow-stock-market-crash-great-depression

Video: S&P Indicates Institutions Heading For The Exits

As I mentioned in the last market health blog post, the market has turned to the bearish side and I have two videos for you taking a look at this important index.  One video is from me, taking a look at all the important support and resistance levels on the weekly, daily and hourly time frames of the SPY (S&P tracking ETF) and the other is from Adam Hewison of Market Club taking a look at the S&P 500.  He highlights the fibonacci retracement as well as his proprietary trade triangle technology to determine how to play this market in the coming weeks.  We both come to the same conclusion.

Click the image to view Adam’s video

S&Pino12310

Click the image to view my video

spytelechart12310

Bulls Run Out Of Gas As S&P, Dow Take Out Key Support

The following was a note sent to my premium members tonight and wanted to pass it along to my blog readers: 

It’s safe to say the bulls have run out of gas.  It’s always interesting how the market begins to show signs of deterioration in certain leaders and sectors before the big plunge takes place.  Over the past couple weeks, we witnessed the China plays begin to crack.. it began with the high flying water plays, moved to the solar names and today it was the wind energy stocks.  In hindsight, I regret a bit not taking more off the table in the China names.  I thought increasing the hedge with FXP would be enough.. not quite enough.  I still have a longer term view of these stocks and they will all benefit big time as China pours billions into green energy.  However, I may look to ease up if I can get some decent bounces back to resistance levels. 

As you know, I have been increasing overall short exposure in the past week as those distribution days began to pile up.  Today was the fourth in less than two weeks which culminated in the Dow taking out key support levels of the 50 day moving average and the upward trend off the March lows.  Today was the most significant day of selling I’ve seen since the end of October.  I certainly thought the market was topping out then, so I could certainly be wrong again, but when I see this kind of distribution I will play accordingly and adjust if I’m proven wrong.  Along with the Dow taking out the 50 day moving average with heavy volume, the S&P has taken out an important level of support of the upward trend line off the July lows.  It still has support of its 50 day moving average, but downward momentum would indicate that it probably wants to test that 1100 level in the coming days. 

So, in light of the moves of the past two days, the strategy of the portfolio has shifted and that is to get more aggressive with short exposure into the rallies.

You can see the Dow taking out minor support around 10500 today and major support of the 50 day moving average with heavy sell volume.  More Dow analysis here.

12110_dow   

The S&P is still holding its 50 day moving average but probably not for long considering today’s downside momentum.  More analysis of the S&P here.

12110_sp

A Summer Hiatus Begins..

It’s been more than five years now running Self Investors and it’s time for me to reflect and revitalize.  Blogging, researching and trading the markets can be incredibly demanding at times, particularly over the past two years and quite frankly, I’m exhausted and need a break.  I’m not breaking 100%, but am scaling back for a stretch, so likely no posts here at the Self Investors blog until after Labor Day.  Until then, good trading!

Head Fake Head And Shoulders Top, Indices Break Out

Wow, now that’s what I call an oversold bounce.  I was expecting some retracement of the selling off oversold conditions last week, but not of that magnitude.  The recovery was such that the much discussed head and shoulders top has failed as all the indices broke out from 4 week long down trends.  Of course, those that dismiss chart reading as voodoo are using the move as proof that technical analysis doesn’t work.  What they forget to include in their argument is that technical analysis is used as a probability tool to increase your odds of success.  The patterns don’t always work and some work better than others.  In this case there may have been so many people calling this top (myself included), that it was setup for failure.  After all, the market generally moves against the herd. Just about every hour over the past couple weeks, the H&S top was discussed on CNBC.  It’s something I discussed last week and was a bit concerned about, but the move of last week still surprised me.  That was some serious resistance to work through and the market sliced through with ease as shorts scrambled to cover positions.   

The move of last week is a game changer with bulls now back in control, especially if this jolt higher is digested in an orderly manner.  Let’s keep in mind that we moved from oversold to overbought quickly last week with the market looking a bit tired Friday, so probably setting up for some kind of pull back. That would provide an opportunity to continue to lighten the load on the short side and add high quality breakout stocks on the long side. 

Continue reading Head Fake Head And Shoulders Top, Indices Break Out

S&P, Dow Confirm Head & Shoulders; Nasdaq Close To Confirming Double Top

It’s official.  I’ve been highlighting the possibility of a head and shoulders top confirmation on the Dow and S&P for several weeks and now we have confirmation of those formations as both broke through the neck lines this week.  While we’re oversold and could see a minor bounce, the momentum and trend is clearly down until proven otherwise. 

It’s interesting to see all the discussion about the head and shoulders formation on CNBC, who seem to be paying more attention to technical analysis.  Even Jim Cramer is turning to the dark side and displaying charts on his show.  It wasn’t long ago that charting was ridiculed and dismissed as voodoo by the mainstream media.

Let’s turn to the voodoo and take a look at the Nasdaq,

Continue reading S&P, Dow Confirm Head & Shoulders; Nasdaq Close To Confirming Double Top

Market Divergence Remains – Nasdaq Strong, S&P Head & Shoulders Top Potential

I’m short on time this week, so will move right into the charts.  Basically not much change in my analysis from last week as the indices continue to diverge with Nasdaq strength and S&P weakness.  The Nasdaq actually broke out of its two week consolidation on Thursday, closing the week above the 20 day moving average yet again.  Amazing.  I don’t think too many would have predicted the Nasdaq would close above the 20 by the end of the week after plunging Monday and Tuesday to test the 50 day moving average.  Support at 1800 is back in play, with 1750 now shaping up as strong support as well. 

62809_naz 

Continue reading Market Divergence Remains – Nasdaq Strong, S&P Head & Shoulders Top Potential

S&P500 and Dow Breaking Down, Nasdaq Remains Strong

The indices are down but not out.  That was the theme of last week as the indices broke down out of tight, short trading ranges and are in the process of testing some key resistance levels which could soon tell us whether the rally will continue or enter a prolonged retracement.  Last week, I discussed the developing head and shoulders formations, but it’s much too soon to tell whether those topping formations will confirm.  For now, the Nasdaq remains remarkably strong and continues to trade above its 20 day moving average and actually looks poised to continue moving higher.  Contrast that with the Dow and S&P which closed the week below their 20 day moving averages for the first  time since the rally began in March.. so certainly some divergences and contradictions taking place that makes the current market a bit difficult to read.  I am leaning to the cautious side.  Tech and commodities have been the backbone of the rally and with commodities showing signs of cracking last week, perhaps they lead the market to the downside.  Let’s take a look at some key support and resistance levels I’ll be watching on the major indices next week.

Continue reading S&P500 and Dow Breaking Down, Nasdaq Remains Strong

Nasdaq Flashes The Golden Cross; Coiling The Spring For Another Rally?

I’m short on time this weekend so will keep the commentary to a minimum and just focus on the chart of the Nasdaq and what it might be telling us about where we’re headed.  The market is definitely showing some signs of fatigue recently but continues to digest gains in a very health manner and could very well be coiling the spring for another push higher, quite possibly to the next level of major resistance which in the the case of the Nasdaq is in the 1900 – 1947 range.  Note that the 50 day moving average has now crossed above the 200 day moving average, forming “the golden cross” which is a decent indicator of a bullish market. I still think we’re probably setting up for one last push of a few percent which would market the top of this leg up before entering a significant retracement phase. 

Continue reading Nasdaq Flashes The Golden Cross; Coiling The Spring For Another Rally?