I’m short on time this week, so will move right into the charts. Basically not much change in my analysis from last week as the indices continue to diverge with Nasdaq strength and S&P weakness. The Nasdaq actually broke out of its two week consolidation on Thursday, closing the week above the 20 day moving average yet again. Amazing. I don’t think too many would have predicted the Nasdaq would close above the 20 by the end of the week after plunging Monday and Tuesday to test the 50 day moving average. Support at 1800 is back in play, with 1750 now shaping up as strong support as well.

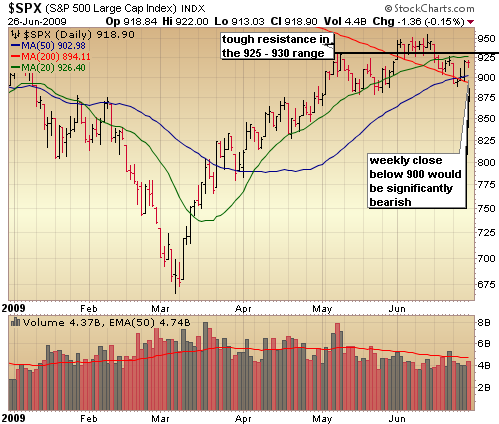
Contrast the strength of the Naz with the deterioration in the S&P and potential head and shoulders top. We’re right back to where we closed the previous week around the 920 level with significant resistance in the 925 – 930 range. Another test of that level may just carve out the right shoulder of the topping formation for the S&P, so we need to watch this level closely. The 900 level remains critical on the support side. A weekly close below that level would be significantly bearish.
While we have some important economic data coming out this week along with the unemployment figures on Thursday, I doubt this market will make a meaningful move ahead of the July 4th weekend.
:::::::::::::::::::::::::::::::::::::::::::
Isn’t Time You Took Control of Your Financial Future?
Get Your Self Investors Gold Membership Today!
The Self Investors Model Portfolio wrapped up 2006 with a gain of 27.6%, 2007 with a gain of 30.2%, finished nearly 35% ahead of the S&P in a very difficult 2008 and is off to a good start here in 2009, outperforming the S&P by 5%. This is a REAL portfolio with position sizing and not based on extrapolated hypothetical gains for each trade. On average, it beats the S&P by 20% per year. The result?
* Putting $100K into an S&P tracking index at the beginning of 2004 and you’re down more than $20K.
* The Self Investors Model in the same time period would have more than doubled your money. That’s the power of not buying and holding!
When comparing the Self Investor Model Portfolio to the 535 Model Portfolios tracked by Hulbert Digest for annualized returns over the past 5 years, just four model portfolios produced better results and none of those used diversified approaches.
1. Cabot China & Emerging Markets: 22.2%
2. No Load Portfolios (Gold/Cash: 19.%
2. No Load Portfolios (Gold/Shorting): 19.9%
4. Outstanding Investments: 18.2%
(focuses on oil & precious metals – did extremely well until it was crushed in the market crash)
::: >> 5. Self Investors Model Portfolio: 17.5%
(The SI portfolio isn’t currently tracked by Hulbert (and I’ve never looked into it) but every trade alert is sent via IM and email as well as tracked in a database which includes trade notes, position size and entry price)
** Astonishing fact #1: About a 1/3 of all model portfolios tracked by Hulbert Digest have not made a dime over the past 5 years!
** Astonishing fact #2: Just 6% of the model portfolios tracked have annualized returns over 5 years of 10% or more!
Would you like to receive buy and sell alerts in the Model Portfolio within minutes (NEW! now get them via instant messaging in near real time) of each transaction? You can receive these along with ALL of the tracking tools and video reports with the very popular Gold membership. Don’t delay, get started today and join me for many more market beating months here at SelfInvestors.com.
Get Your Self Investors Gold Membership Today!
::: Best/Worst Performers :::
– Top 10 Performing Industries For the Week –
1. Medical Practitioners: 13.50%
2. Home Furnishing Stores: 8.75%
3. Computer Based Systems: 5.90%
4. Office Supplies: 5.75%
5. Dairy Products: 5.50%
6. Property Management: 5.45%
7. Silver: 5.35%
8. Consumer Services: 5.15%
9. Drug Related Products: 3.90%
10. Building Materials Wholesale: 3.85%
– Top 10 Worst Performing Industries For the Week –
1. Aerospace/Defense: -9.40%
2. Toy & Hobby Stores: -5.75%
3. Sporting Goods Stores: -5.30%
4. Metal Fabrication: -4.65%
5. Long Term Care Facilities: -4.05%
6. Banks – Pacifiic: -4.00%
7. Textile Manufacturing: -4.00%
8. General Entertainment: -3.90%
9. Diagnostic Substances: -3.30%
10. Movie Production – Theaters: -3.30%
– Top 5 Best Performing ETFs For the Week –
(excluding leveraged ETFs)
1. Claymore China Real Estate (TAO) 8.80%
2. India Fund (IFN) 5.20%
3. iShares Taiwan (EWT) 4.35%
4. iShares Hong Kong (EWH) 4.00%
5. SPDR Emerging Middle East & Africa (GAF) 3.85%
– Worst 5 Performing ETF’s –
1. SPDR Oil & Gas Exploration (XOP) -4.75%
2. Templeton Russia & E Europe (TRF) -4.60%
3. Claymore Global Solar (TAN) -4.60%
4. iShares Global Energy (IXC) -3.95%
5. iShares France (EWQ) -3.85%
::: Upcoming Economic Reports (6/29/2009- 7/3/2009) :::
Monday: None
Tuesday: Consumer Confidence, Case-Shiller Home Price Index, Chicago PMI
Wednesday: ADP Employment Change, Construction Spending, Pending Home Sales, ISM Index, Crude Inventories
Thursday: Nonfarm Payrolls, Unemployment Rate, Initial Claims, Factory Orders
Friday: None
::: Earnings I’m Watching This Week :::
Still slow for earnings.. the bulk of earnings will get going in a couple weeks
Monday: Apollo Group (APOL)