Category Archives: Gold/Silver

Gold Resting Before Push To 1500 Or About To Confirm Head & Shoulders Top?

It’s been awhile since I provide an update on gold, so I thought now would be a good time to take another look at the yellow stuff.  In my last report on gold the GLD was inching closer to $130 and I thought that level would present a very difficult level and be an area where gold would stage a correction. 

A few things to point out.  For one, gold didn’t really correct, but rather digested overbought conditions with more of a sideways move (actually head and shoulders pattern) and remains in a fairly tight range above the $130 level, so certainly gold has held its own up here and could be poised for a move to the next major resistance level up around the $150 level (another 10% or so from current levels).

Continue reading Gold Resting Before Push To 1500 Or About To Confirm Head & Shoulders Top?

Gold (GLD) Correction Is Near

Gold continues to run up nearly every day, enticing a growing number of johnny come lately’s to join the party.  You’ve seen the headlines.. Gold $2000, $4000/oz.  Could we see those kinds of numbers?  Maybe, but analysts that make those kinds of predictions are just looking to create publicity for themselves and publishers looking for a good headline. 

I like to take a different approach and analyze it from a supply/demand angle using technical analysis.  Late last year was my last detailed analysis of gold and I predicted that a top in gold could come at the 1200 – 1300 level.

“What I see happening is some kind of climactic run in gold over the course of a few months with  gains of 20 – 30%.  That’s not a number pulled out of a hat, but based on previous runs from previous bases.  Notice how the farther up you get into the rally, the returns diminish as the base quality deteriorates.  Take a look at any big move in a stock and you’ll see this similar pattern.  It’s reasonable to assume that the returns from this breakout will be less than what we saw with the 2007 breakout.. so somewhere around 20 – 30%.  If the price of gold gets into that 1200 – 1300/oz area I’d be looking for some major topping action!  A climax run in gold over the next few months followed by massive selling on the part of institutions may be the end of a nearly 10 year bull run in gold.” 

I expected gold would reach that level a bit earlier than it has, but we’re darn close to 1300 which happens to the next big level of resistance for gold and an area where a correction will likely take place.  It’s much too soon to call $1300 a major top in gold and we could certainly take out $1300 at some point, but now is no time to be adding to gold and for many not a bad place to take some profits off the table.

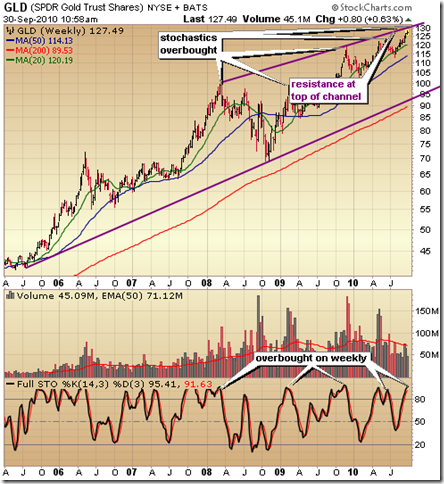
Here’s a look at the current chart of the SPDR Gold ETF (GLD).  Two important aspects of the chart to point out.  One is the fact that GLD is overbought on the weekly  chart once again.  Take a look and see what happened to GLD the last four times we hit overbought on the weekly chart.  The first time it led to a major correction of 30% in 2008 and three minor corrections since.  We’re overbought again up around the 1300 level and it’s not out of the realm of possibility to see another 30% correction to test the bottom of the channel around 95 – 100.  The second important component of this chart is that the 130 level coincides with resistance at the top of the channel (purple line)

===> You can get a free daily technical analysis of GLD here

gold_gld_9302010

Gold Correction.. How Far? (GLD)

Everybody wants to know where gold is headed and it remains one of the most talked about trades.  More recently I’ve begun to hear family and friends discuss purchasing gold stocks and the actual metal itself.  That usually doesn’t bode well for any trade especially after the run gold has had.  So where might it be headed in the coming weeks and months?

As always, I turn to the charts for some clues and Adam from Market Club gives us a video analysis as well.  While he uses some different indicators, we both arrive at about the same conclusion.. that gold is still undergoing a correction and the best strategy is to step aside until a new buy signal is provided. 

Below is a chart of the SPDR Gold Trust (GLD) which seeks to track the price of gold.  You’ll notice the parabolic move at the end of last, followed by a 20% correction and return to test the all time highs.  While gold held up at those lofty levels for nearly two months, it has since taken out support at the 2009 highs and is in the process of a correction. 

Continue reading Gold Correction.. How Far? (GLD)

Final Run Before Major Top In Gold Price By Early 2010: SPDR Gold ETF (GLD)

With gold breaking out of a 1.5 year base in recent weeks, it’s certainly been the focus of much discussion once again.  How high will it go?  Are we about to enter a mania phase?  What’s the best way to play the sector?  I thought I’d enter the fray and tackle some of these questions, primarily from a technical perspective.  In this article I take a look at the SPDR Gold Trust ETF (GLD) in order to get an overview of where gold has been and where it might be headed.  In Part II, which I’ll post towards the middle of the week, I’ll take a look at a few gold stocks that I think represent a good leadership group.  That is, companies that are profitable and in some cases growing quickly. To close out the series, I’ll post another article later in the week or next weekend taking a look at several speculative gold plays based purely on momentum.  These are trades that carry considerable more risk and potentially much greater reward. 

With that, let’s jump into a couple charts of GLD which I think are quite revealing. 

Continue reading Final Run Before Major Top In Gold Price By Early 2010: SPDR Gold ETF (GLD)

Trading the DB Gold Double Long ETN (DGP)

Over the past 9 months or so I’ve been trading in and out of gold using the leveraged double long ETN (DGP), adding positions on breakouts (or oversold conditions) and taking profits on overbought conditions.  In my opinion, the time is now to begin adding gold again.  Yeah I’m a bit concerned about all the talk about getting into gold (haha.. what timing! a goldline commercial just appeared on the tube), so it is a bit crowded and may need to consolidate some more, but I think the odds are very good for a run to $1000/oz and beyond in the coming months.

I first began trading DGP last summer and on June 16th, 2008 I told my premium members:

“My analysis is indicating that gold and silver is offering an initial entry point today by breaking out of downtrends and subsequently, bullish wedge formations.  This could be the beginning of another run in gold and silver over the next few months.  Entry at 21.16.”

::: >> (oh no, another gold commercial!)

One month later on July 15th, I locked in the 17% profit at 25.22 as DGP became very overbought. (see chart below)

Continue reading Trading the DB Gold Double Long ETN (DGP)

Gold & Silver Breaking Out?: Leverage with Double Long Gold ETN (DGP)

The following is analysis provided by TheCorrectCall.com exclusive to readers of SelfInvestors.  I completely agree with this analysis.  Breaking of bullish wedge formations/downtrends are taking place in the Gold & Silver ETFs.  Great post!

:::::::::::::::::::::::::

In our daily screens of stock charts exhibiting positive and negative MACD crossovers, The Correct Call recognized a trend too large to ignore. Our heads turned when we saw at least 25% of the upside candidates were Gold/Silver stocks and ETFs. As we have noted many times before, we are big believers in confirmation. When we see a disproportionate number of companies in the same sector all presenting the same "buy signal", we feel it is safe to say something is happening.

In these turbulent times it nice to find some water in the desert.

Investors worried about mounting losses can possibly stem the tide by adding Gold to their portfolio. According to a study titled "Is Gold a Hedge or a Safe Haven? An Analysis of Stocks, Bonds and Gold" by Dirk G. Baur and Brian M. Lucey, gold is an "ideal venue to park money during periods of uncertainty." Their analysis found that in the US, Gold and stock returns are negatively correlated and that Gold acts as a hedge at all times. That means when stocks go down, Gold usually goes up.

That’s good news for investors.

All of the Gold/Silver stock & ETF charts we reviewed look this iShares COMEX Gold Trust (IAU). Each has roughly a 6 week narrow trading range with yesterday’s MACD breakout.

Conservative investors should buy IAU, streetTRACKS Gold Trust (GLD) or iShares Silver Trust (SLV).

More aggressive investors might consider owning individual stocks or DB Gold Double Long ETN (DGP). DGP’s objective is to give its owners twice the return of Gold’s price changes. That means if Gold moves up 5%, investors can expect see a return of 10%.

The precious metal stocks with charts pointing the way up include:

    Barrick Gold Corp. (ABX) Apollo Gold Corp. (AGT) Pan American Silver Corp. (PAAS)

If we have made The Correct Call, we would expect investors to profit by 10% or more in the next 3-to-6 months owning Gold/Silver stocks and ETFs. (double that for DGP.)