Now that we’ve narrowed down our list of companies to those that are exhibiting superior fundamentals, outpacing the market, showing positive insider action and have the support of institutions, we are ready to take a look at the technical side by looking at the daily and weekly charts of these companies. There are three areas of importance to us when looking at the chart. A proper base formation, the price/volume action, and support/resistance areas.
Before we delve into the types and characteristics of bases it’s important to be able to recognize the underlying strength of a particular stock by studying the price and volume movements, as well as support and resistance levels. The strength of any stock depends on the action of institutions as 75% of the move in a stock is the result of institutional buying and selling. If you can get a read on the buying and selling habits of institutions for a particular stock, your ability to predict the future price of the stock will increase dramatically.
Price and Volume Action
The absolute best way to track the buying and selling habits of institutions is to study the volume and price action of the stock by looking at the weekly and daily charts.
General Volume & Price Action
- Look for volume to increase on days and weeks when the price rises and volume to decrease in days and weeks where the price falls
Tight Price Action
- Wild price swings indicate that too many people are watching the stock, which increases the risk of a faulty breakout (more on breakouts in a bit). Stocks will perform much better when they are flying under the radar of most investors.
- Tight intraday price ranges also indicate that institutions are supporting the stock at current price levels.. a sign of strength.
Relative Strength
The relative strength of a stock is one of the most important components of a winning stock. Just about every highly successful investment strategy requires choosing stocks that are outperforming the market and making new highs.
- Relative Strength is a measurement of how a stock is doing compared to the market (usually, the S&P 500). A stock that is outperforming all other stocks will have the highest rating. Ideally, you want to keep your stock selections to those companies that are in the top 20-30% in terms of performance relative to the S&P 500
- Another good way to judge the strength of a stock on a short term basis is by taking note of how each of your stocks fared on days when the market performed poorly. If they were flat or up, you know you have stock exhibiting great strength. Stocks that are flat or down on days when the market is performing well should be watched closely for a possible sell point.
- It’s been proven that stocks making new highs will often go higher, while stocks making new lows will continue to drop further. Don’t fight the momentum
- Stocks making new highs no longer have to contend with overhead resistance (more on this in the technical section)
Reversal Days
- A stock that starts the day down significantly, but reverses course and ends the day at the upper portion of the intraday range is showing strength. On the other hand, if a stock starts the day up significantly, but ends in the lower end of its intraday trading range, it’s a sign of weakness.
Support and Resistance
A key ingredient to being a successful investor is knowing at all times where levels of support and resistance are.
Resistance is the area at which price progress has halted due to a decrease in buying and an increase in selling. It often occurs at levels where investors feel the stock is overpriced, but can also occur at previous highs as investors who bought at the previous high look to sell in order to break even.
Support is the area where buyers have begun to outnumber sellers, reversing the downward trend. Support areas indicate where investors have begun to feel the the stock is a good value.
Of course, resistance and support levels are not absolute as stocks will often break through resistance and plummet through support. I like to think of these areas as “tests” for the strength of a stock. Stocks that bounce off support and break through resistance are showing great strength and should be considered for purchase, while stocks that retreat at resistance and plummet through support are showing weakness and should probably be sold. Support and resistance become a self fulfilling prophecy as professional traders keep tabs on these important areas and make buy and sell decisions based on the action of the stock as it reaches support and resistance. You should be doing the same!
Common areas of support and resistance are presented below.
Moving Averages
-
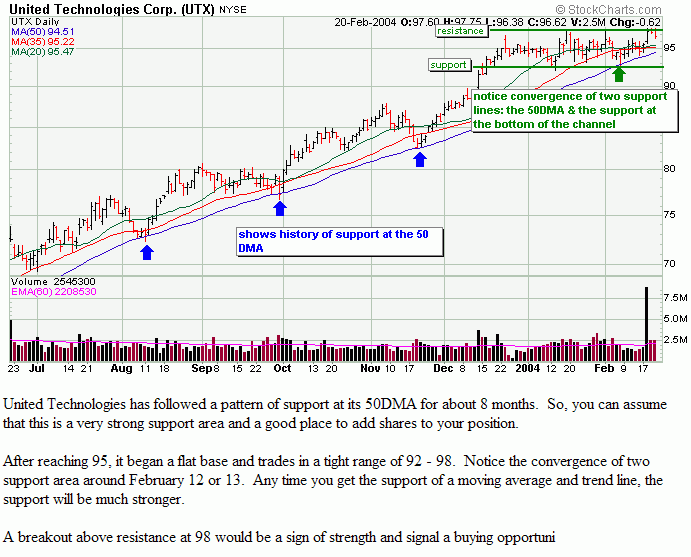
Moving averages are important support and resistance areas to keep an eye on, specifically the 50 Day Moving Average. Many times, institutions and professional traders will add shares to their position at this point. However, a drop below this important line on heavy volume can signal further selling is ahead for the stock. Other important moving averages are the 20DMA, 35DMA and the 200DMA.
Trend Lines
-
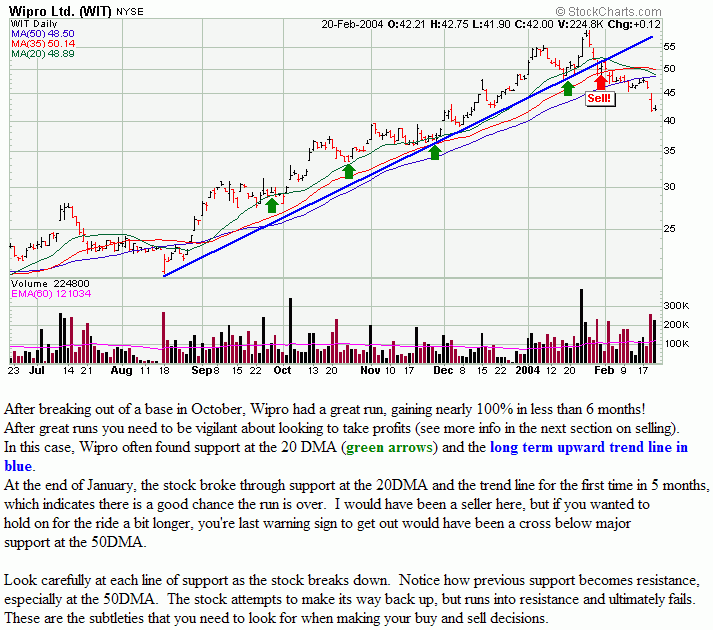
Trend lines are also very important support and resistance areas and can be drawn in order to see where investors may buy or sell shares
-
To draw trend lines, connect support points to support points and resistance points to resistance points. A positive slope indicates and upward trend (higher highs and lows) while a negative slope would indicate a downward trend (lower highs and lows). Channel trends occur when there is no slope.
Whole Numbers (psychological support & resistance)
-
Support and resistance can occur at round numbers because traders tend to think in these terms when making buy and sell decisions. If a stock is purchased at 7 and makes its way past 8, then 9… they may say “if it gets to 10 I will sell”. With higher priced stocks multiples of 5 become more important. These become psychological resistance levels.
-
You see these psychological support and resistance levels mentioned in the news or magazines often. “Dow breaks 10,000!” or “NASDAQ needs to find support at 2000”
Gauging the Strength of Support & Resistance
-
Look at the history of the stock. Has it found support at a trend line or moving average in the past? How many times? If it has a history of showing support at a certain level, you can bet there is a good chance it will be supported there again. If it breaks the habit and is no longer supported there, look out! A deeper correction is most likely ahead.
Role Reversal
-
When a stock breaks support, that support line becomes resistance. Often times, a stock will break below major support and try and make its way back, only to be turned away by the new source of resistance. Why? Investors who purchased at support, only to have the stock plunge below quickly realize they made a mistake. If the stock makes its way back to the support area, they usually jump at the chance to get out without a loss. The opposite is also true. After a stock powers through resistance, that becomes a support area where traders are often willing to add shares. Investors who missed the initial move will often look to purchase if it makes its way back to the resistance area, creating support there.
| Ex: Finding Support | Ex: Breaking Support |
Learning The Bases
Stocks form bases in step with the market. As the market begins to tumble or consolidate, leading stocks will begin to carve a base, setting up for the next advance. A base starts when a stock begins to correct off its high as sellers take advantage of investor greed. This will generally occur when a stock extends far from its prior base and/or releases a poor earnings report or negative news. Proper bases are required to adjust for the previous price uptrend and get rid of weak shareholders. Once the weak shareholders are eliminated, the stock has a chance to really move once the base is completed.
Characteristics of All Great Bases
-
A stock that sinks less severely during a market correction is outperforming its peers and is a sign of strength. It may be one of the first out of the gate as the market begins to rally.
-
An upward price reversal at the bottom of the base with heavy volume indicating major support by institutions (this process may happen over the course of a few days and can be seen in a weekly chart).
-
A long base, giving it a greater chance of a sustained breakout
-
Volume dry up (decreasing selling volume) at the bottom of the base and in the handle
-
Low volatility in the base and handle. An occasional shakeout is fine, but you want to see at least a few weeks of tight, quiet price action indicating a lack of speculators and a load of steady long term shareholders. A stock with a wide and loose base indicates that is in the public eye too much and calls attention to itself. Remember that stocks tend to shoot up to new highs when most people aren’t paying attention
-
A high volume gap up on the right side (for cup with handle and double bottom bases – see below)
-
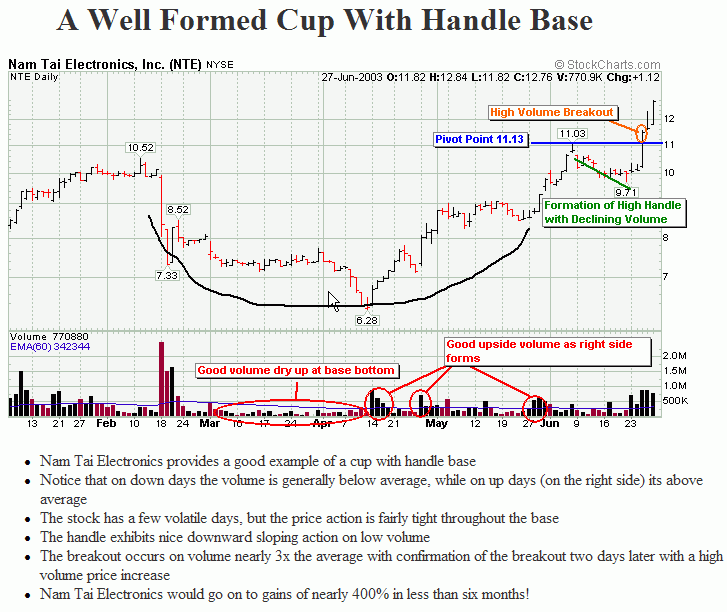
A handle that slopes downward (5-15%) with declining volume and tight price ranges. This handle should form in the upper half of the base (applicable to cup and double bottom bases).
-
Volume on the breakout day at least 50% higher than the average and trading volume for that week higher than the previous week. (NOTE: Average volume on the breakout may be OK as long as the volume on days following the breakout begins to increase as institutions begin to build their positions in the stock.
-
Relative strength is at a 52 week high at the breakout
-
Confirmation after the breakout. You should see a few high volume advances within a week or two of the breakout to confirm that institutions are building positions in the stock.
Types of Bases
1. The Cup/Saucer With Handle (the most common)
- The saucer is a shallower base that usually bases for a longer period of time.
- For a proper cup or saucer base to begin, there needs to have been a prior uptrend of at least 30%
- The base forms due to a market correction, poor earnings report, negative news
- The bottom forms as institutions begin to support the stock, stabilizing the price
- The decline from top to bottom should not be more that 35%. During a severe bear market, a decline of 35-50% may be acceptable if the stock had a huge prior advance.
- As the market improves and investor optimism for the stock increases, the base begins to form the right side
- Base should be a minimum of 7-8 weeks and can be as long as 1.5 years
- At this time, some investors who purchased the stock near the old high are willing to sell in order to break even (overhead resistance). It’s this selling and the selling by investors tired of waiting for the big move that form the downward sloping handle. The number of sellers should decline as the handle forms which is reflected in the decrease selling volume.
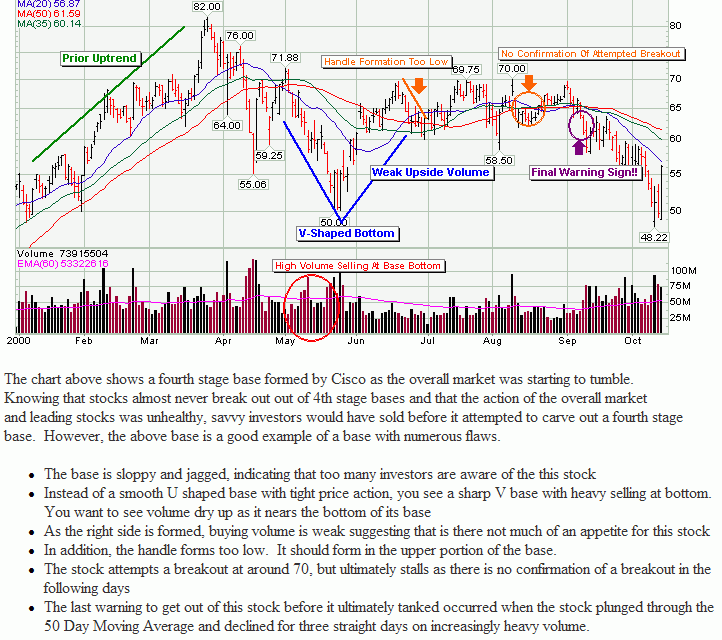
- There will be times when no handle will form (usually during a powerful market rally, positive earnings report or news). In this case the pivot point is the previous high (the beginning of the cup formation). A word of caution: cups without handles have a higher rate of failure, so insist on perfection in other areas.
- Once the last of the weak holders are removed during the handle formation, the stock is set up for a breakout as buyers are ready to move in with little resistance from sellers. A proper buy point is offered when the stock clears the top of the handle formation (called the pivot) with great volume.
|
Ex: Good Cup |
Ex: Faulty Cup |
2. The Double Bottom Base
-
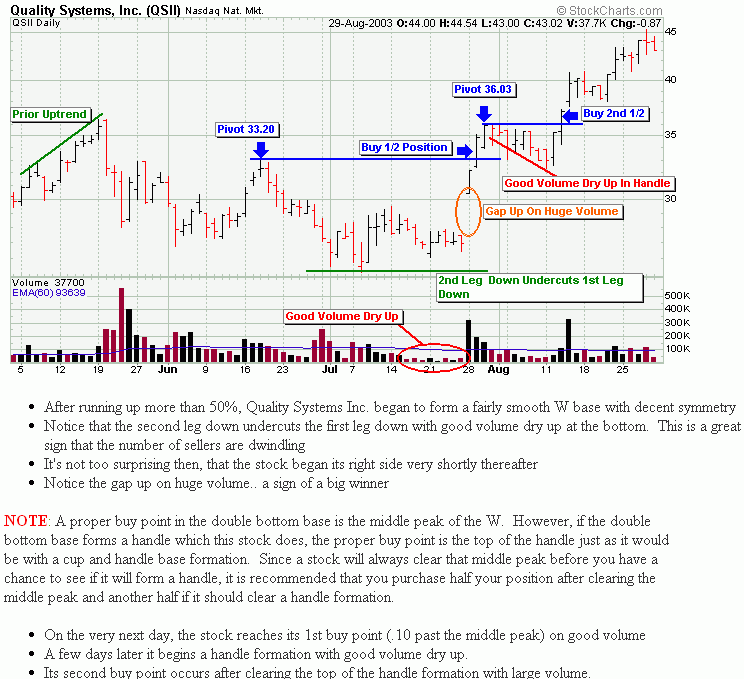
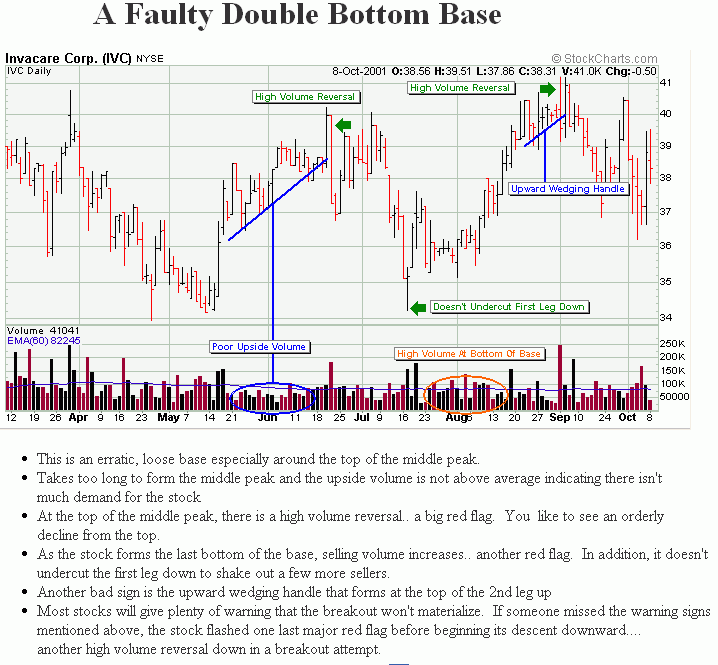
The double bottom base differs from the cup with handle in shape and the placing of the pivot point. This base occurs less frequently and may be less sound since it falls back twice before recovering.
-
A double bottom forms creating a W shape that should be fairly smooth and symmetrical. Ideally, the second bottom will undercut the first, shaking out the last of the weak holders.
-
The pivot point in the W base is at the top of the middle peak and this point should be below the old high (the start of the base). However, if a handle forms, the pivot is the top of the handle just like a cup with handle formation.
-
Ex: Good Double
Ex: Faulty Double
3. The Flat Base (my personal favorite)
This is a personal favorite as I believe it is the base which provides the highest success rate. This is a base that tends to break out when you least expect it, which is probably why it’s so successful. You can get an idea of when a stock may break out of a cup or double bottom base, but it’s difficult to know with the flat base. It could break out after five weeks, 8 weeks or 12 weeks. It lulls you to sleep and just when you think it will never break out.. it does. Find those flat bases and set your alerts, so you’ll be ready when they break!
- This base usually forms right after a cup with handle or double bottom base, but can also form after large run ups
- This is a base that should fluctuate no more than 15% from the peak to the low of the base
The minimum length requirement is five weeks - The proper buy point occurs .10 above the pivot point which is the price peak of the flat base
Example of Flat Base
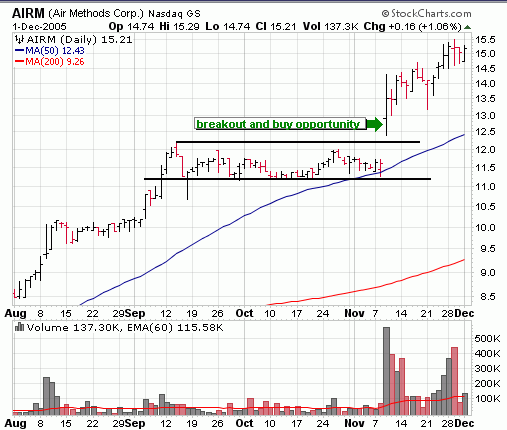
The above of AIRM is a good example of a well formed flat base – tight price action throughout, fairly light trading volume and not fluctuating from top to bottom more than 15%. The stock gapped up out of the base and went on to skyrocket 50% in just 6 weeks.
4. The Ascending Base
- The ascending base is quite rare, but could be a sign of great strength in a stock. Instead of succumbing to market weakness and falling back into a base correction, the stock will undergo a series of minor corrections. The pattern resembles steps leading to a surge as the market finally begins to take off.
- Like the flat base, this base usually occurs after a stock has broken out of a cup or double bottom base
- This base usually forms in three gradual steps… stepping up and pulling back 10-20% three times before finally breaking out for good when the market perks up.
The entire process usually takes 9-16 weeks - The final phase of the breakout occurs after the stock clears the 3rd consolidation, but it is OK to purchase shares as the stock breaks out of each consolidation
Ex: Ascending Base 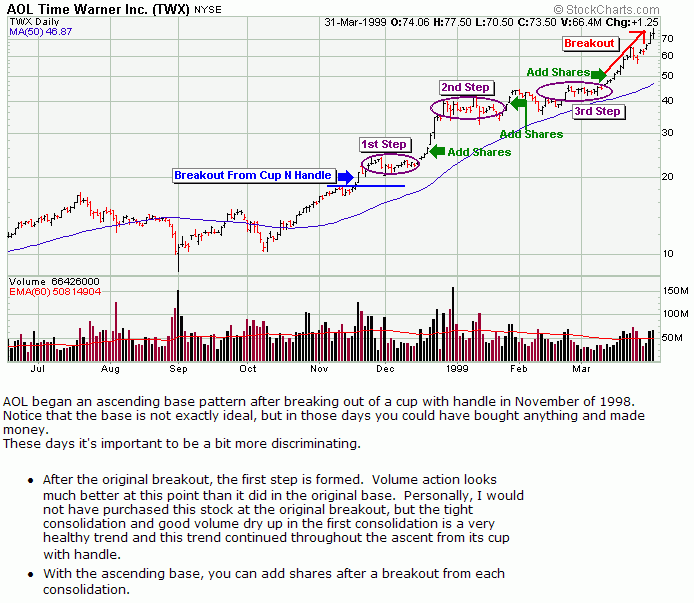
5. Base On Base
-
This is a rare occurrence too, but there are times at the end of a bear market when a breakout drops back into another base before resuming its advance. Often times, it’s these stocks that are first to break out when the bear market ends and the bull takes over and can lead to big gains.
-
This base occurs before the original breakout has a chance to breakout more than 30%
-
Rather than a series of shallow mini bases forming after an original breakout, the base on base pattern is characterized by the formation of one full sized base.
-
Breakout occurs when the stock clears the pivot of the second base
Ex: Base on Base 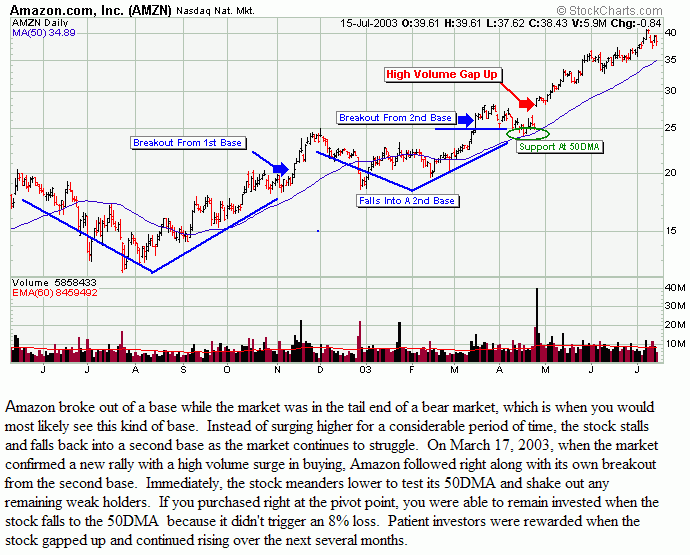
Continue On to Buying Stocks::::: >
