About six weeks ago I mentioned that you might want to look for a BIG head and shoulders formation in indices just days after the infamous “flash crash” day. About one month later, the right neck line was complete after another test of the lows of the correction, kicking off a weak rally into resistance of the 50 day moving average and around the left shoulder. In the case of the Nasdaq which you see below, that was the area around 2326 – 2350. The Naz would ultimately fail around the 2340 level following a significant reversal day on June 21st. It should be noted that the Dow did fail at exactly the 50 day moving average on June 21st. That was signal to begin locking in profits and shorting the market if you’re a trader or offering another chance to raise significant cash if you’re more of an investor. I still don’t think it’s too late to do so.
Category Archives: State of the Stock Market
a thorough analysis of the health of the current stock market
The Case For Bear Vs Bull Market
I wanted to post an email I sent out to my members last night, going over the case for a bull vs bear market. Comments are welcome and appreciated!
What a yo yo couple of weeks it’s been with the market bouncing around in a fairly tight trading range. The market doesn’t know what it wants to do up here and that makes it difficult for a trader to know what to do as well. I still think the best strategy up here for most people is to move more to cash, lock in gains quickly if your playing momentum stocks and stick to dividend payers if you’re planning on holding for a longer time period.
The case could certainly be made on the bullish and the bearish side, but in my opinion when you make the case for both, you have to give the advantage to the bearish side up here. Let’s a take a look at both.
The Bull Case
– Market still trading up around the highs of the year despite quite a bit of bad news (ie the quick recovery off Dubai debt concern)
– entering a month that is historically a bullish time for the market
– liquidity, liquidity, liquidity.. this could really go under the bullish case and bearish case (are we creating another bubble fueled by excessive risk?)
– the recession is over! (ok, I say that with some sarcasm, because I don’t truly believe we’re out of the woods and I get sick of hearing the argument that the market will continue to move higher because the coast is now clear. It isn’t and most of the good news has been built into this market now)
– there must be a few more points to make the bullish case, but I’m not coming up with them. Send me your best bullish case and I’ll have a little something for you.
The Bear Case
I think we’re all aware of the economic concerns out there such as inflation (down the road), rising unemployment, BIG government, rising taxes, etc, so I’ll just discuss the technicals for the bear case
– trouble at key resistance levels around Dow 10500, Naz 2200 and S&P 1100
– S&P and Dow hitting big resistance of the downward trend line off the 2007 highs (I’ll draw out these charts at the blog soon)
– volume continues to diminish to the upside
– Dow, Naz, S&P back into overbought territory on the weekly charts
– small caps are broken as revealed by the break down in the Russell 2000
– US dollar stabilizing as it hits big support of 2008 lows (a rally could derail the market)
– the financials failed at key resistance today as revealed by the XLF (high volume reversal at 50 day moving average)
What do you think? Have I missed anything? Can you make a stronger case for the bull side? I’d like to hear your opinion and I’ll publish the best responses over at my blog.
As for the action today, we got some hefty selling there in the last few minutes of trading ahead of the jobs number in the morning. Is that move forecasting an awful jobs number in the morning? We’ll find out. The rumor this morning was the White House knows the report and unemployment ticked up. The White House denied the rumor and the market rallied a bit. We’ll get the truth in the morning.
The market just remains in a tight range right now with two straight days of failed break out moves, but still with lots of support below. I’ll be keeping a close eye on the resistance levels of the highs of today and the support levels of the 50 day moving averages – at Dow 10000, S&P 1080 and Nasdaq 2100.
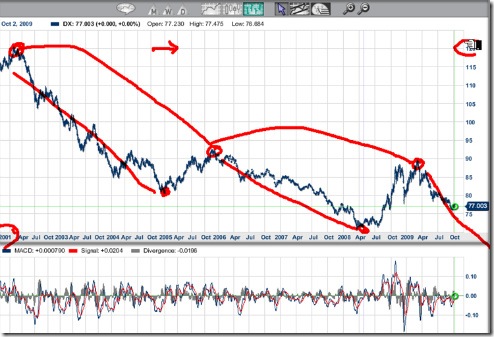
Where Is the Dollar, Gold & S&P500 Headed This Quarter?
Everybody is talking about the US dollar and how low it can go, about gold and how high it can go and most of all the market. Just when will a major correction take place in this market?
Of course there are no certainties in the market, but good technical analysis can give you probabilities and steer you in the direction of greater odds of success. Adam Hewison of Market Club just released a new video yesterday taking a look at the US Dollar, Gold and the S&P500. I have to agree with all the analysis in the video. You might be surprised to see the gold estimates and just how far the S&P could correct.
Video: see how to trade the big trends over the next couple of months.
Stock Market Sets Up for Further Declines; Garmin (GRMN) Still Shortable?
The following analysis is provided exclusively to readers of SelfInvestors via TheCorrectCall. Enjoy!
:::::::::
Yesterday’s selloff moved the Dow below a fairly major level of support at 12,200. In all likelihood, this violation will lead to more selling in the days ahead. The technical picture sets up almost too perfectly. According to what we see, the next stop is in the vicinity of the March 14th & 17th closing prices of 11,951-11,972.
From there, if our analysis holds to form, the next leg would follow along the angle of decent to converge at the end of the "T" formation; meaning a visit to the March 10 closing low of 11,740 sometime near the end of June-early July.
As you can see on the chart, this all looks too straightforward:
A stock that appears to be shortable during this downturn is Garmin, Ltd. (GRMN) which manufactures global positioning system (GPS)-enabled products and other related navigation, communications, and information products worldwide. It operates in four areas: Automotive/Mobile, Outdoor/Fitness, Marine, and Aviation.
The stock was one of Wall Street’s darlings for several years until it made a major top in late-2007. Since then GRMN has been a disaster and is off about 60% from its highs. Unfortunately for shareholders, the tough times could continue for quite some time.
There is brutal competition in the industry from the likes of TomTom and Navteq just to name a couple. Recently, Apple showed off navigation features on its iPhone, which lopped a few dollars off of GRMN’s stock due to competition fears. These fears might intensify as there is a lot of consolidation going on in the industry.
In late-April, the company said that earnings per share came in at 67 cents, below the consensus estimate of 75 cents. Revenues were also light by about $40 million. It is still up in the air as to whether or not this will be a trend, but most companies that miss like this tend to take longer than a quarter to turn it around.
Over the past two months, this year’s earnings estimates have fallen 48 cents to $3.94 per share. Analysts are only expecting single-digit growth for next year as well. The stock is not particularly expensive, but the momentum in both earnings and stock price point to lower prices in the near future. We see the stock testing its 52-low of $39.75 in the next few months.
Historically, Streaking Dow Forecasting Further Gains; Resistance in the Way
The following is an article from Daily Wealth, reprinted here with permission. It’s an interesting article that takes a look at the Dow’s recent 8 day winning streak and how the Dow has performed following similar streaks in the past. Based on historical trends, we can assume a better than 50/50 chance of further gains over varying time periods (chart below). It should be noted that if not for a down day in the Dow on April 23rd, we’d be looking at an 11 day winning streak (assuming today closes in the green). That has happened just 5 times. The recent winning streak creates excitement, but as the chart of the Dow below indicates, there is reason for caution at these levels. The Dow is hitting its upper trend line over a one year trend and above the upper trend line over a 3 year period.
When The Stock Market Does a "Joe DiMaggio"
By Ian Davis
April 26, 2007
Joe DiMaggio is sitting in his clubhouse sipping coffee and smoking a cigarette. The Yankees are in Washington to play a double header against the Senators. While DiMaggio relaxes between games, someone sneaks into the visitors’ dugout and steals his favorite bat…
This petty theft nearly ruins one of the greatest feats in baseball history.
You see, the date is June 24, 1941, and Joe DiMaggio is sitting on a 41-game hitting streak. He’s one game short of beating the record George Sisler set in 1922.
It’s only a "piece of wood" says DiMaggio, but in the second game of the double-header, he hasn’t had a hit in his first three at-bats. Finally, on his final walk to the plate, Tommy Henrich offers him his bat, and DiMaggio accepts.
Red Anderson’s first pitch nearly hits DiMaggio, almost ending his hitting streak. Then, on the second pitch DiMaggio connects, slapping a changeup pitch, into left field. Sisler’s record falls, and DiMaggio goes on to rack up the longest hitting streak to this day, 56 games.
The Dow equivalent of DiMaggio’s record hitting streak was its January 1987 run when it traded higher for 13 consecutive trading sessions. This is the largest streak of up-days in the history of the Dow (since 1928).
Recently, the Dow achieved a rare eight-day streak (between March 29 and April 10, 2007). Let’s take a look at how the Dow performed after these market rarities and if there is any way to profit from investing following these events.
Since 1928, the Dow has rallied for eight or more days only 48 times. This is few enough to make it a rare event, but sufficient to draw some meaningful conclusions. The following chart shows the number of Dow "hitting streaks" that lasted more than four days.
|
||||||||||||||||||||||
After the 13-day streak back in 1987, the stock market continued to perform exceptionally well for nine months after the streak ended. However, if you look a year forward, you see the Black Monday stock market crash, which would have erased your returns in one fell swoop.
The following chart shows the average performance one week, two weeks, one month, three months, six months, nine months, and one year after each of these hitting streaks. For most of these hitting streaks, the market continues to perform better than or on par with its long-term average. The only exceptions are the 10, 11, 12, and 13-day streaks. These exceptionally long streaks tend to lead to a period of market underperformance in the following 6-12 months.
Market Returns After Long Streches of Up Days
Since the Dow just underwent an eight-day hitting streak, let’s take a look at how the Dow may perform going forward by looking at past streaks.
The following table gives you a list of probabilities – based on previous occurrences – of the market posting a positive return and/or beating the market after a set period of time. I also tried to give you a sense of risk/reward by showing the ratio of the largest fall compared to the largest rally following these events.
|
For example, if you’d bought following every eight-day up streak since 1928, and held for three months, you would have achieved above-average returns more than 70% of the time. However you also would have experienced the most risk (the largest loss following this strategy was 1.74 times the size of the largest gain).
In conclusion, our hearts tell us that a long stretch of up-days is the mark of an overheating market, and we start to expect a correction. The statistics show otherwise.
Whether you invest for a week or a year, you are more likely to achieve better-than-average market returns by investing following long streaks of up days. The large downside risk of being wrong, however, probably nullifies this strategy.
Stock Chart Analysis – The Major Indices (S&P500, Dow, Nasdaq)
The most glaring thing I see in this chart is the severe V shaped base that has formed. Based on that alone, this market is very much due for some kind of pull back, or at the very least, a lengthy consoliation sideways. With the Dow breaking into new high territory we now have a new support level at the old highs around 12800. If it can consolidate quietly from here and hold at those all time highs, that would be mighty bullish action. I tend to think we’ll take out that support level at some point and test the short term upward trend line around 12700, possibly even the 50 day moving average around 125000. I don’t think we’ll test the lows of the correction below 12,000.
The S&P of course will look very similar to the Dow so not much to add here. Notice too it has a new level of support at the old multi year highs set back at the end of February. We’ll need to, at the very least, test that new level of support before heading higher.
I’ve highlighted the sharp V base in the Nasdaq. It is quite rare to see this kind of base in any chart, particularly a chart of the major indices. The Naz isn’t as bullish looking as the Dow and S&P and has not cleared resistance of the February highs (although it briefly peaked above that level on Friday). The Nasdaq is clearly due for some selling and retracing a large portion of this run up to around the 50 day moving average is not out of the question.
Don Worden (Telchart) On the Sell Off
The following are the thoughts Don Worden, founder of TCNet/TeleChart, a great real time chatting/charting application. It was written the evening after the market sell off. Don’s a great writer and always offers eloquent insights into the market action.
The Bravado Stage
"The market knows where it wants to go, but it needs an excuse to do it. When the excuse eventually develops, we call it a catalyst. A catalyst isn’t the reason for a significant market move. It is a helper and a detonator.
This market hasn’t been acting right for around three months. There are a lot of areas for concern: housing, sub-prime loans, the CPI, Alan’s clarinet dirge warning of a possible recession, energy, geopolitical tensions ranging from nuclear proliferation to the insurgency in Iraq to al-Qaeda rejuvenating in Pakistan, etc. The unrealistic time elapsed since a significant correction has itself developed into a sword of Damocles hanging over investors.
I believe the huge decline in the Chinese stock market was not the actual reason for today’s decline, but it proved to be the catalyst the market needed to detonate a significant correction based on other factors.
At the moment we are in the "bravado stage." The market was under a spell of belief that a nice gradual uptrend that had prevailed for almost eight months would never end. Even many people who knew better intellectually and by experience could not shake the feeling that Wall Street had lucked into a new kind of immortality. That was the "ecstasy stage," characterized by paralysis of the front lobe of the brain.
The eight-month Intermediate Uptrend has now turned negative for the Dow and SP-500. The Nasdaq Brothers are hanging on to an LA by their teeth. I could interpret Intermediate Downtrends for them, but I’ve decided to wait for a violation of the December lows. (Remember, the Trend Table is based on closing prices.)
The belief in the unearthly rally still lingers. This is why at least fifty guests on CNBC today proclaimed this an isolated event, and that there was no reason to be concerned. Many are pointing to the fact that stocks are cheaper today than they were yesterday, with the distinct implication that this is a buying opportunity. It will take an unknown amount of time for the "bravado stage" to vanish. If tomorrow’s follow-through approaches the magnitude of today’s decline, the "bravado stage" may disappear right there.
The point is, though, that the Intermediate Decline that has begun will persist at least until the bravado stage has floated away on a cloud.
The next stage is the "panicky stage," when investors turn hostile and feel they have been swindled. Why is this happening to me? Why was there no warning? Following this is the "give-up stage," which investors react to in a variety of individual ways. Some will simply cease to be investors. Some will start dumping stock, enabling the decline to feed on itself. But most will take it in stride without much faith in the integrity of the market, and without much confidence that they will be able to pick the bottom or have the courage to try. Some will, though, and will thrive again.
Actually, as Intermediate Declines go, this one may not be particularly bad. It may not develop into a primary bear market. But the danger that it will is great. Because violent dislocations of the type we saw today are generally followed by widening disturbances. Every now and then the market is entitled to a nervous breakdown."
Copyright © 2007 Worden Brothers, Inc. www.worden.com, Reprinted with permission
Looks Like the Beginning of a Market Correction
I’ve had a few requests from premium members to provide my thoughts on how to play this market right now. I thought I’d pass along with what I shared with them here..
I’ve had a few questions this morning about how best to tackle today’s sell off and wanted to give you my opinion on how best to proceed and how I’m going to proceed. First of all keep in mind that it wasn’t going to take much to send this market into a tail spin. Many traders most likely had tight stops in anticipating a correction. When all those stops get triggered at once it leads to a bit of a panic which leads to more selling, more stops triggered.. you get the idea. Yes, its important to protect your capital and unload your weakest positions. I personally don’t use stops because I’m able to watch the market closely during the day and don’t like getting stopped out based on price alone. I’d rather monitor both price and volume as well as overall market conditions when determining if I’m going to sell or not. If you are using stops, which many of you are that’s ok. You should be if you can’t pay attention to your stocks.
It’s easy to get wrapped up in the fear and panic on an open like we had today but it’s so important to sit tight and wait for the dust to settle then make a rational decision. The best time to do this is in the last few hours of trading which is when the institutions make their moves and the low liquidity high fliers aren’t swinging a few bucks in minutes. Fight the fear and make rational decisions.
You may be tempted to look for some of those high flyers that have sold off today. My recommendation is take your losses today, take your aspirin and sit tight for a few days at the very least. What this kind of selling does is create hesitancy. Hesitancy to the kind of speculation buying we’ve seen over the past few weeks (including in the Model Portfolio). At the very least, this market doesn’t go anywhere over the next several weeks. At the worst, we get a major meltdown. I think we get something in between.
As always, the most important part of today’s trading will occur in the last hour. Can the bulls make a stand and force a close above key support of the 50 day moving average? If so, we probably end up in more of a sideways pattern over the next few weeks. If this market closes below those support levels we’re headed much lower in the coming weeks.
I’ve been hedging my long positions with 10% of the portfolio in QID and will look to add more to this position soon. Stay tuned and be careful out there.
After Market Report – Despite Big Nasdaq Move There are Reasons to Be Cautious; Stock of Day – Life Time Fitness (LTM)
::: Today’s Market Action :::
 With a light economic calendar this week, earnings (see today’s earnings movers below) were once again the focus of traders. This time around strong earnings from some big tech names fueled a big Nasdaq bounce after a rough week of heavy selling. The trading action to begin the new year continues to be volatile and unpredictable. I’ll try and sort out the technical picture by weighing the positives and negatives.
Positives:
1. Dow and S&P continue to make new highs
2. Nasdaq still has support of the 50dma which it bounced from today
Negatives:
1. Dow and S&P broke to new highs on lighter volume than the day before; overall volume continues to wane as price moves forward indicating buyers are becoming less enthusiastic up at these levels
2. Nasdaq has logged 2 big distribution days in the past week
3. Semiconductors breaking down
After weighing the technical positives and negatives I’ll conclude that the bulls are still in charge for now but showing signs of tiring. There isn’t any reason to move to large cash positions or short this market heavily just yet, but the time may come soon. It’s wise to remain a bit cautious despite today’s move.
::: Major Indices Performance – The Numbers :::
(Note: volume averages are based on the average over the past 50 days)
Data as of 4:00EST – End of Day Jan 24th 2007
Nasdaq: UP 1.43% today with volume 13% ABOVE average
Nasdaq ETF (QQQQ) UP 1.65%, volume 5% ABOVE average
Dow: UP .70%, volume 27% ABOVE the average
Dow ETF (DIA): UP .59%, volume 27% ABOVE the average
S&P ETF (SPY): UP .81%, volume 16% BELOW the average
Russell Small Cap ETF (IWM): UP 1.09%, volume 39% BELOW the average
::: SelflInvestors Leading Stocks :::
The Self Investors Leading Stocks Index is comprised of stocks in the Breakout Tracker, which is a database of the fastest growing companies near a breakout or having already broken out of a base. Leading stocks did well today, but not as well as the Nasdaq. In a strong market I like to see leading stocks outperform all of the major indices
Summary:
* Advancers led Decliners 335 to 74.
* Advancers were up an average of 1.77% today, with volume 6% ABOVE average
* Decliners were down an average of .92% with volume 27% ABOVE average
* The total SI Leading Stocks Index was UP 1.28% today with volume 10% ABOVE the average
::: Today’s Earning’s Movers :::
Note:
* fundamental rank in brackets does not include latest earnings results
* earnings movers included here only include those stocks in the SelfInvestors.com Breakout Tracker database so often won’t include stocks in a downard trend or significantly below major moving averages – most will be market leading stocks.
UP
- EZCorp (EZPW) Specialty Retail, fundamental rank [27/30], up 12%, continues to surge off support of the 200 day moving average; will most likely continue carving out a base from here
- Ametek (AME) Industrial Electrical Equipment, fundamental rank [26/30], up 6%, broke out of a base to a new all time high today
DOWN
- Norfolk Southern (NSC) Railroads, fundamental rank [26/30], down 6%, working on the right side of a base; still looking OK despite today’s selling
::: Where’s the Money Flowing :::
Many investing websites provide leading industries based on price performance alone. However, without accompanying volume levels, this can sometimes be misleading. The only way that I know of to gauge industry/sector strength WITH volume levels is through the analysis of ETF’s. A couple years ago this was not possible, but as more traders/investors use ETF’s they become a much better tool for guaging the health of the market and seeing where the money is flowing (or not flowing). Using the proprietary SelfInvestors Demand Indicator score which measures price and volume movements, I’m able to quickly see which sectors/industries are seeing the greatest inflows of cash. For a detailed look at how I go about gauging sector/industry strength please see the following post: http://investing.typepad.com/tradingstocks/2006/09/wheres_the_big_.html
* Current Leading Sectors/Industries (over last 30 trading days):
Technology, Aerospace/Defense, Broker/Dealer, Retail, Biotech
[Aerospace/Defense making first appearance in this list]
* Current Lagging Sectors/Industries (over last 30 trading days):
Oil, Oil Services, Commodities, Semis
* Today’s Market Moving Industries/Sectors (UP):
Tech surged today – Internet, Broadband, Broker/Dealers, Technology, REITs
* Today’s Market Moving Industries/Sectors (DOWN):
Global Dividend Plays
::: Stocks :::
The stocks section will be an area where I highlight one stock selected from a group of stocks moving up with volume well above average and most likely breaking out of a base or consolidation. There were quite a few high quality companies moving today, but one in particular stood out and it’s a company I’ve liked for some time and have owned personally (I don’t currently) – Life Time Fitness (LTM)
ABOUT: Life Time Fitness, Inc. operates sports and athletic, professional fitness, family recreation and resort/spa centers under the LIFE TIME FITNESS brand. The Company designs and develops its own centers, and it focuses on providing its members and customers with products and services in the areas of exercise, education and nutrition. In addition to traditional health club offerings, most of its centers include an selection of amenities and services, such as indoor swimming pools with water slides, basketball and racquet courts, interactive and entertaining child centers, full-service spas and dining services and, in many cases, climbing walls and outdoor swimming pools. As of March 1, 2006, the Company operated 48 centers primarily in residential locations across nine states.
FUNDAMENTALS: Life Time Fitness is really a company that didn’t begin to hit its stride until 2003 when it posted earnings of .72/share versus just .02 in 2002. While growth hasn’t been any near those levels, this is a company that consistently posts earnings and sales growth of 20 – 30% which is expected to continue. Net margins isn’t outstanding but in an industry with low margins it’s impressive. Return on Equity is very good at 15% and management owns a good portion of the company (17%). All in all, this is a well run company that should continue to do well as people continue to become more health conscious . The company reports earnings on February 15th.
TECHNICAL: The technical picture remains outstanding. The stock has trended along the 200 day moving average since its IPO in 2004 and is currently breaking out of a base to a new all time high with very good volume indicating institutions are still initiating positions.
SELFINVESTORS RATING: With a total score of 52/60 (26/30 for fundamentals, 26/30 for technical), LTM is currently a top 10 Self Investors break out stock.
Full Disclosure/Disclaimer: The stock of the day is by no means a buy recommendation. Please do your own research and make a personal decision based on your own tolerance for risk. I currently don’t hold a position in LTM but am considering a position in the next several days.