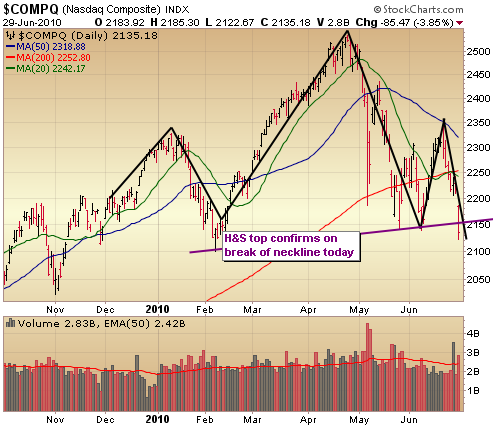
About six weeks ago I mentioned that you might want to look for a BIG head and shoulders formation in indices just days after the infamous “flash crash” day. About one month later, the right neck line was complete after another test of the lows of the correction, kicking off a weak rally into resistance of the 50 day moving average and around the left shoulder. In the case of the Nasdaq which you see below, that was the area around 2326 – 2350. The Naz would ultimately fail around the 2340 level following a significant reversal day on June 21st. It should be noted that the Dow did fail at exactly the 50 day moving average on June 21st. That was signal to begin locking in profits and shorting the market if you’re a trader or offering another chance to raise significant cash if you’re more of an investor. I still don’t think it’s too late to do so.
I expected to see a bit more back and forth on low volume heading into the July 4th weekend, so didn’t think we’d confirm the major topping signal quite yet, but that’s where we’re at .. at least in the Nasdaq. The S&P actually confirmed an H&S top too, but managed to get back above support of the June lows with an end of day rally. Regardless, today’s move is THE signal that this market is on a slippery slope and the likelihood of another 10 – 15% correction (at least) from current levels greatly increases. We are getting considerably oversold on an intraday basis, so could see some kind of relief, but I’ll be looking at any rally attempt as an opportunity to move more to the short side.
I know, we had a few failed head and shoulders patterns in 2009, but those patterns were on a much smaller scale and didn’t contain the precipitous drops we’ve seen in the right side of this H&S pattern. I certainly will be trading as if it will hold and will only change course if we break the downtrend on the daily chart.
If you’d like to receive my market commentary in real time throughout the trading day along with trade alerts in the SI Portfolio, consider joining me for a risk free full month as a Gold member. It also includes all my video presentations and tracking databases for IPO’s, ETF’s and Breakout Stocks.