It’s official. I’ve been highlighting the possibility of a head and shoulders top confirmation on the Dow and S&P for several weeks and now we have confirmation of those formations as both broke through the neck lines this week. While we’re oversold and could see a minor bounce, the momentum and trend is clearly down until proven otherwise.
It’s interesting to see all the discussion about the head and shoulders formation on CNBC, who seem to be paying more attention to technical analysis. Even Jim Cramer is turning to the dark side and displaying charts on his show. It wasn’t long ago that charting was ridiculed and dismissed as voodoo by the mainstream media.
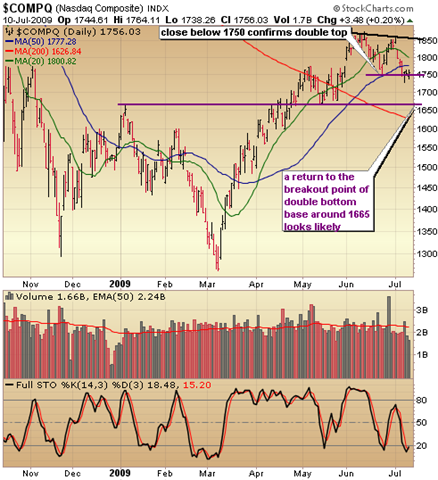
Let’s turn to the voodoo and take a look at the Nasdaq,
which appears to be on the verge of a technical break down as well. A double top would be confirmed with a close below the 1750 level. That would likely set it up for a move to the next level of support around 1665 which is the Jan 09 high and the breakout point of that big double bottom base. Should we get a market bounce next week, look for a test of resistance around 1775 and if it can clear that, a test of 1800.
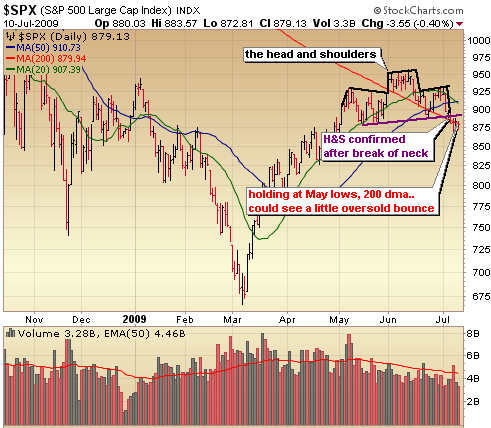
The S&P confirmed the head and shoulders top formation (outlined in black) this week but continues to hold support where the lows of the left shoulder and the 200 day moving average converge around 879. Again, we are considerably oversold and could get a bit of a bounce soon, but trend is definitely down. The confirmation of the head and shoulders top likely sets up the S&P for a move to the 800ish level before a new trend up can take place.
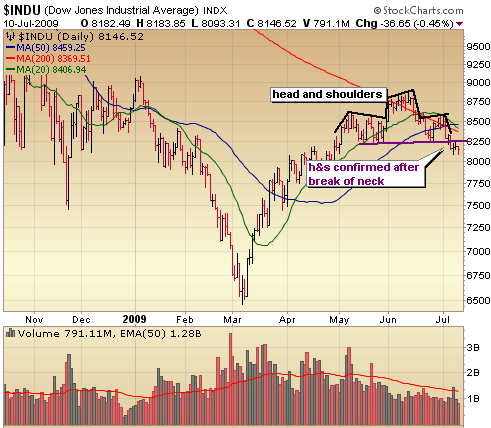
Same for the Dow – a confirmation of H&S top last week with clear resistance now between 8220 – 8250. I’m looking for a test of the 7500ish area in the Dow before another major rally can begin.
:::::::::::::::::::::::::::::::::::::::::::
Isn’t Time You Took Control of Your Financial Future?
Get Your Self Investors Gold Membership Today!
The Self Investors Model Portfolio wrapped up 2006 with a gain of 27.6%, 2007 with a gain of 30.2%, finished nearly 35% ahead of the S&P in a very difficult 2008 and is on pace for another good year in 2009, outperforming the S&P by 9%. This is a REAL portfolio with position sizing and not based on extrapolated hypothetical gains for each trade. On average, it beats the S&P by 20% per year. The result?
* Putting $100K into an S&P tracking index at the beginning of 2004 and you’re down more than $10K.
* The Self Investors Model in the same time period would have more than doubled your money (up 140%). That’s the power of not buying and holding!
When comparing the Self Investor Model Portfolio to the 535 Model Portfolios tracked by Hulbert Digest for annualized returns over the past 5 years, just four model portfolios produced better results and none of those used diversified approaches.
1. Cabot China & Emerging Markets: 22.2%
2. No Load Portfolios (Gold/Cash): 19.9%
3. No Load Portfolios (Gold/Shorting): 19.9%
4. Outstanding Investments: 18.2%
(focuses on oil & precious metals – did extremely well until it was crushed in the market crash in 2008)
::: >> 5. Self Investors Model Portfolio: 17.5%
(The SI portfolio isn’t currently tracked by Hulbert (I’ll have to look into how to get it included) but every trade alert is sent via IM and email as well as tracked in a database which includes trade notes, position size and entry price). The SI portfolio uses a diversified approach and hedging strategies to significantly beat the market year after year.
** Astonishing fact #1: About a 1/3 of all model portfolios tracked by Hulbert Digest have not made a dime over the past 5 years!
** Astonishing fact #2: Just 6% of the model portfolios tracked have annualized returns over 5 years of 10% or more!
Would you like to receive buy and sell alerts in the SI Model Portfolio within minutes (NEW! now get them via instant messaging in near real time) of each transaction? You can receive these along with ALL of the tracking tools and video reports with the very popular Gold membership. Don’t delay, get started today and join me for many more market beating months here at SelfInvestors.com.
Get Your Self Investors Gold Membership Today!
::: Best/Worst Performers :::
– Top 10 Performing Industries For the Week –
1. Internet Service Providers: 11.85%
2. Auto Parts Stores: 3.30%
3. Medical Practitioners: 2.90%
4. Hospitals: 2.05%
5. Grocery Stores: 2.00%
6. Banks – SE: 1.60%
7. Healthcare Plans: 1.60%
8. Tobacco Products: 1.30%
9. Rental & Leasing Services: 1.20%
10. REIT – Healthcare Facilities: 1.10%
– Top 10 Worst Performing Industries For the Week –
1. Nonmetallic Mineral Mining: -10.90%
2. General Contractors: -10.00%
3. Broadcasting – Radio: -9.75%
4. Silver: -9.70%
5. Heavy Construction: -9.10%
6. Farm & Construction Machinery: -7.70%
7. Cement: -7.70%
8. Recreational Goods: -7.40%
9. Steel & Iron: -7.40%
10. Gold: -7.10%
– Top 5 Best Performing ETFs For the Week –
(excluding leveraged ETFs)
1. Claymore China Real Estate (TAO) 8.80%
2. India Fund (IFN) 5.20%
3. iShares Taiwan (EWT) 4.35%
4. iShares Hong Kong (EWH) 4.00%
5. SPDR Emerging Middle East & Africa (GAF) 3.85%
– Worst 5 Performing ETF’s –
1. SPDR Oil & Gas Exploration (XOP) -4.75%
2. Templeton Russia & E Europe (TRF) -4.60%
3. Claymore Global Solar (TAN) -4.60%
4. iShares Global Energy (IXC) -3.95%
5. iShares France (EWQ) -3.85%
::: Upcoming Economic Reports (7/13/2009- 7/17/2009) :::
Monday: Treasury Budget
Tuesday: PPI, Retail Sales, Business Inventories
Wednesday: FOMC Minutes, CPI, Capacity Utilization, Industrial Production, Business Inventories, Crude Inventories
Thursday: Initial Claims, Philly Fed
Friday: Building Permits, Housing Starts
::: Earnings I’m Watching This Week :::
Earnings season is beginning to ramp up again …
Tuesday: Goldman Sachs (GS), Intel (INTC), J&J (JNJ), Ocean Power Tech (OPTT)
Thursday: Google (GOOG), IBM (IBM) JP Morgan (JPM)
Friday: Bank of America (BAC), Citigroup (C), General Electric (GE)
No way jose….. you are totally wrong