Wow, now that’s what I call an oversold bounce. I was expecting some retracement of the selling off oversold conditions last week, but not of that magnitude. The recovery was such that the much discussed head and shoulders top has failed as all the indices broke out from 4 week long down trends. Of course, those that dismiss chart reading as voodoo are using the move as proof that technical analysis doesn’t work. What they forget to include in their argument is that technical analysis is used as a probability tool to increase your odds of success. The patterns don’t always work and some work better than others. In this case there may have been so many people calling this top (myself included), that it was setup for failure. After all, the market generally moves against the herd. Just about every hour over the past couple weeks, the H&S top was discussed on CNBC. It’s something I discussed last week and was a bit concerned about, but the move of last week still surprised me. That was some serious resistance to work through and the market sliced through with ease as shorts scrambled to cover positions.
The move of last week is a game changer with bulls now back in control, especially if this jolt higher is digested in an orderly manner. Let’s keep in mind that we moved from oversold to overbought quickly last week with the market looking a bit tired Friday, so probably setting up for some kind of pull back. That would provide an opportunity to continue to lighten the load on the short side and add high quality breakout stocks on the long side.
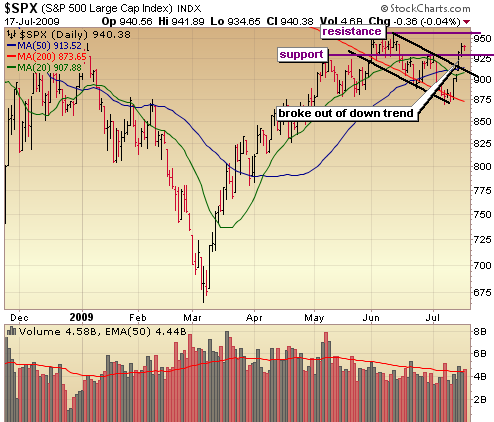
Let’s take a look at the charts of the indices starting with the S&P500. The H&S top failed and the S&P broke out of its month long down trend above the 915ish level which also happened to be the 50 day moving average, so a tough level of resistance to clear. Now we have support at the 930 level and if that is taken out, we’re probably looking at a filling of the gap around the 905 level. The next target on the upside is the high of the year around the 956 level. If we clear that, we’re most certainly headed to test the 1000 level.
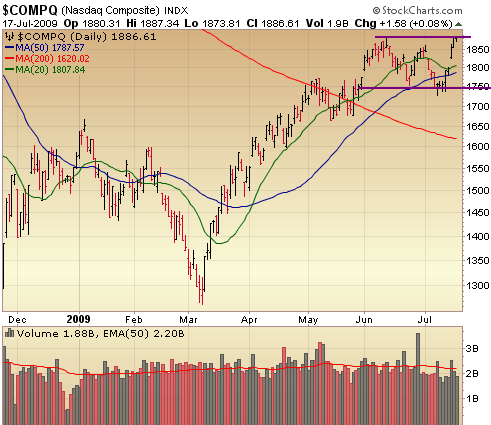
The Nasdaq staged another mighty impressive performance by kicking off support of the 1750 level and actually closed the week above the previous 2009 high of 1879.92.. a very bullish move. We’ll have to see if it can hold above that level throughout the week, which would lend validity to the move, but I still think we’ll need to pull back a bit. For the Nasdaq, that might mean a test of new support around the 1850 level. If that level is taken out, look for a move to fill the gap around 1800.
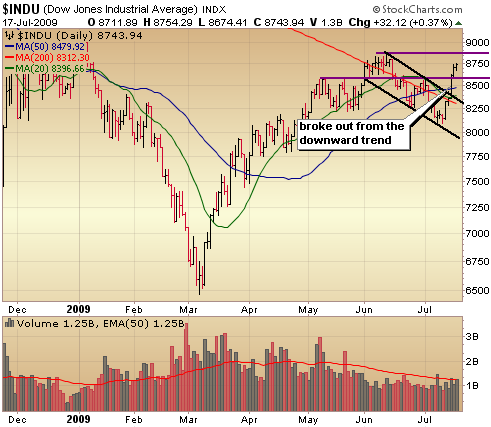
The Dow looks similar to the S&P, breaking out of that down trend as well as the 50 day moving average, so a few very important levels of resistance cleared which will now act as support. We now have support around the 8600 and 8500 levels with the 2009 highs the next likely target on the upside.
In summary, last week’s move was very impressive which I think ultimately pushes the S&P and Dow to their 2009 highs as well. Should that move happen, we’ll have to consider the potential for a double top situation in those indices. However, if several high volume selling days don’t appear around those levels, then a move to the Dow 10,0000 and S&P 1,000 level becomes much more likely.
:::::::::::::::::::::::::::::::::::::::::::
Isn’t Time You Took Control of Your Financial Future?
Get Your Self Investors Gold Membership Today!
The Self Investors Model Portfolio wrapped up 2006 with a gain of 27.6%, 2007 with a gain of 30.2%, finished nearly 35% ahead of the S&P in a very difficult 2008 and is on pace for another good year in 2009, outperforming the S&P by 9%. This is a REAL portfolio with position sizing and not based on extrapolated hypothetical gains for each trade. On average, it beats the S&P by 20% per year. The result?
* Putting $100K into an S&P tracking index at the beginning of 2004 and you’re down more than $10K.
* The Self Investors Model in the same time period would have more than doubled your money (up 140%). That’s the power of not buying and holding!
When comparing the Self Investor Model Portfolio to the 535 Model Portfolios tracked by Hulbert Digest for annualized returns over the past 5 years, just four model portfolios produced better results and none of those used diversified approaches.
1. Cabot China & Emerging Markets: 22.2%
2. No Load Portfolios (Gold/Cash): 19.9%
3. No Load Portfolios (Gold/Shorting): 19.9%
4. Outstanding Investments: 18.2%
(focuses on oil & precious metals – did extremely well until it was crushed in the market crash in 2008)
::: >> 5. Self Investors Model Portfolio: 17.5%
(The SI portfolio isn’t currently tracked by Hulbert (I’ll have to look into how to get it included) but every trade alert is sent via IM and email as well as tracked in a database which includes trade notes, position size and entry price). The SI portfolio uses a diversified approach and hedging strategies to significantly beat the market year after year.
** Astonishing fact #1: About a 1/3 of all model portfolios tracked by Hulbert Digest have not made a dime over the past 5 years!
** Astonishing fact #2: Just 6% of the model portfolios tracked have annualized returns over 5 years of 10% or more!
Would you like to receive buy and sell alerts in the SI Model Portfolio within minutes (NEW! now get them via instant messaging in near real time) of each transaction? You can receive these along with ALL of the tracking tools and video reports with the very popular Gold membership. Don’t delay, get started today and join me for many more market beating months here at SelfInvestors.com.
Get Your Self Investors Gold Membership Today!
::: Best/Worst Performers :::
– Top 10 Performing Industries For the Week –
1. Textile Manufacturing: 17.70%
2. Resorts & Casinos: 17.65%
3. Printed Circuit Boards: 17.45%
4. Semis – Memory Chips: 15.80%
5. Sporting Activities: 15.10%
6. Office Supplies: 14.80%
7. Appliances: 14.30%
8. Silver: 14.30%
9. Industrial Metals & Minerals: 14.15%
10. Copper: 14.05%
– Top 10 Worst Performing Industries For the Week –
1. Trucking: -1.95%
2. Banks – Mid Atlantic: -.25%
3. Internet Service Providers: 1.15%
4. Health Care Plans: 1.20%
5. Restaurants: 1.20%
6. Specialized Health Services: 1.45%
7. Medical Labs & Research: 2.20%
8. Medical Practitioners: 2.25%
9. Biotech: 2.45%
10. Water Utilities: 2.50%
– Top 5 Best Performing ETFs For the Week –
(excluding leveraged ETFs)
1. Templeton Russia & E Europe (TRF): 23.75%
2. Market Vectors Steel (SLX): 14.65%
3. iShares US Home Construction (ITB): 14.20%
4. SPDR Metal & Mining (XME): 14.20%
5. SPDR Homebuilders (XHB): 14.00%
– Worst 5 Performing ETF’s –
1. iShares 20YR Treasury (TLT): -5.20%
2. iShares 7-10YR Treasury (IEF): -2.40%
3. Vanguard Total Bond Market (BND): -.80%
4. iShares Aggregrate Bond Fund (AGG): -.70%
5. iShares 1-3YR Treasury (SHY) -.25%
::: Upcoming Economic Reports (7/20/2009- 7/24/2009) :::
Monday: Leading Indicators
Tuesday: None
Wednesday: Crude Inventories
Thursday: Initial Claims, Existing Home Sales
Friday: Mich Sentiment
::: Earnings I’m Watching This Week :::
Monday: Johnson Controls (JCI)
Tuesday: Amedisys (AMED), Capella Education (CPLA), EPIQ Systems (EPIQ), FPL Group (FPL), Health Grades (HGRD), Panera Bread (PNRA), Stericycle (SRCL)
Wednesday: AsiaInfo Holdings (ASIA), Cerner (CERN), Compellant Technologies (CML), Green Mountain Coffee Roasters (GMCR), Honda (HMC), ITC Holdings (ITC), Itron (ITRI), Rightnow Technologies (RNOW), Rubicon (RBCN), Shenandoah Tel. (SHEN), Tetra Tech (TTEK), Trex (TWP), Visa (V)
Thursday: American Superconductor (AMSC), Art Technology (ARTG), Dolby Industries (DLB), Evergreen Solar (ESLR), Mastercard (MA), Netsuite (N), Sourcefire (FIRE), Southwestern Energy (SWN), Strayer Education (STRA), Synaptics (SYNA), Vistaprint (VPRT), Xcel Energy (XEL)