How many times over the past couple weeks have you heard the so-called "experts" declare that now is a great time be adding stocks, despite the fact we had just run up more than 10% off a bottom created as a result of a severe correction. Despite the fact that technical indicators were flashing overbought signals and most importantly, despite the fact that the character of the market was changing as traders looked for any nugget of bad news to lock in hard earned profits over the past couple months.
As an independent self investor myself, part of what I try and do here at SelfInvestors.com is remind new traders that thinking for themselves is of utmost importance to successful trading. By tuning out the talking heads and focusing on the technicals (price and volume, support and resistance, stochastics and MACD) of the major indices, it is possible to come very close to timing the market with great accuracy. Will you always get in at the bottom and out at the top? Absolutely not… but you can get a very good sense of when the market is beginning to turn.
I’ve talked a lot about the character change of this market recently and the slow shift to a more bearish tone. All that was needed was a clear technical indication that a top was being put in. The first technical red flag took place on Monday as the market reversed sharply off the lows. In an email to my premium members I said:
"It’s been quite awhile since we’ve seen such a wild reversal
intraday and the action is somewhat significant. I say somewhat
because although we had a dramatic end of day reversal in which the
S&P closed below important resistance of the 200 day moving average,
volume was not heavy. Dramatic, high volume reversals indicate
topping action but this wasn’t quite the drama I was looking for to
indicate a top to this run and the Dow remains above the 200 day
moving average while the Nasdaq sits right on the mendoza line. It
will be interesting to see if sellers can continue the momentum
tomorrow with more conviction. At any rate I still think this market
is tiring and caution is urged."
I was a bit hesitant in calling an absolute top to this run due to the lack of volume and wanted to see some continuation of the selling momentum the following day. That’s exactly what we got which was confirmation that indeed we were topping. Last night I sent the following to premium members:
"Following yesterday’s sharp end of day reversal in the major
indices, the market was primed and ready for a big, sustained move
down. With inflation coming in a bit hot, a bearish outlook from an
Openheimer analyst of the banking sector and poor results out of Home
Depot and Target, today was the day that bears were finally able to
exert some strength.
I do think yesterday’s reversal and today’s confirmation mark an
intermediary top. It’s difficult to say just how far we pull back
at this point, but one thing is for certain - remain extremely
cautious on the long side here. I’ve finished production on a new
video review of the Model Portfolio and take a look at the major
indices as well…."
The selling didn’t let up at all today and the conviction on the sell side was considerably stronger than yesterday. The Nasdaq and S&P appear to be well on their way to testing the 50 day moving averages (an area where I might look to add a new long trade or two) and the Dow actually took out this important level of support today. Given the magnitude of the selling over the past two days we’re probably due for a little bounce, but do not get sucked in. This is significant technical damage over the past 2 days and will most likely lead to further deterioration in the coming days.
Let’s take a quick look at the charts:
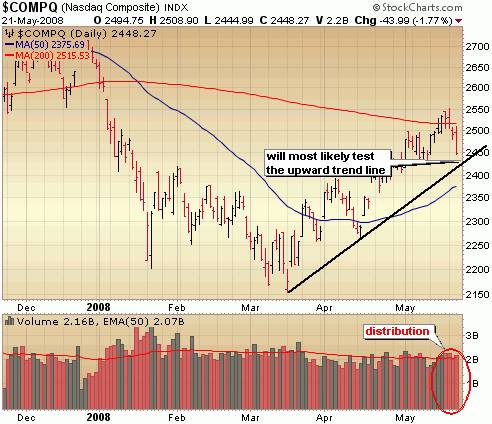
An ugly move in the Nasdaq today with a test of that upward trend line around 2425 almost certain. If we take out that level of support, a test of the 50 day moving average becomes likely.
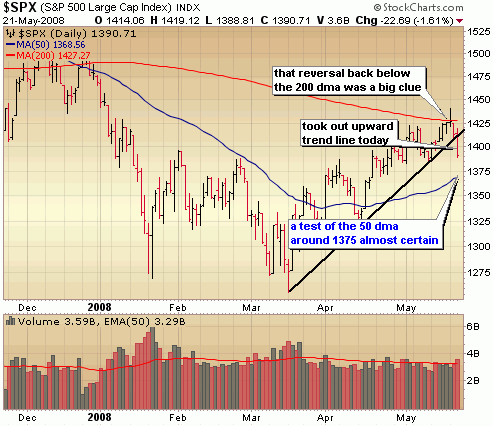
The S&P took out that upward trend line today with significant selling volume behind it. The next major level of support around the 50 day moving average is the next target.
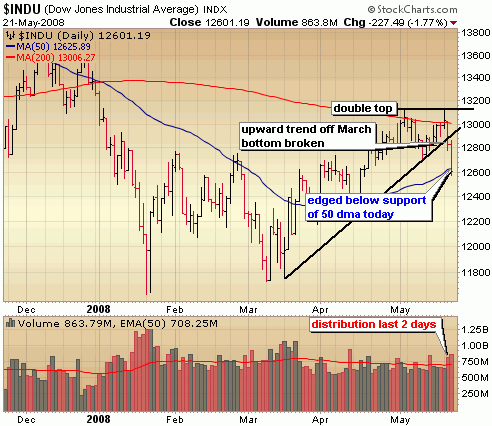
Note the double top in the Dow, followed by slicing and dicing of support levels – a breach of the 200 day moving average, then the upward trend line and today the 50 day moving average.. Given the magnitude of the selling over the past couple days, we could see a short term oversold bounce, but that should be short lived. The doom and gloomers might begin calling for a test of those March lows, but I don’t think we’ll get that far. More deterioration is ahead and staying away from the long side is still the best strategy, but the good news is that big opportunities will be created for those that missed this rally.


