In any market, there will be differences of opinion but certainly at market tops and bottoms, the predictions become more bold. I was reading a few articles over at Seeking Alpha and came across one guy (who manages money for a living by the way) exclaiming that Thursday’s move was huge! He was as bullish as could be just as many of the so called professionals on CNBC have been. There is nothing wrong with having an opinion and the courage of your convictions, but where is the "money management"? Where is the preservation of capital? I don’t have the all answers but one thing I do have is a sense of when it’s time to ease up and err on the side of caution. I realize there is incentive for Wall St to keep their clients invested, so you won’t hear the call to move to cash very often, but at the same time they fail to realize how just a little bit of integrity can go a long way.
My approach is that the bulls are going to have to prove me wrong every time. After all, down is the path of least resistance. When the overall market takes out major long term trends lines in the first few months of the year, carves out a bear market rally and hits key resistance in the process, you damn well better believe I’m going to be cautious and recommend moving to cash or hedging your bets until the bulls can prove themselves. It’s been the theme of late here at SelfInvestors and that didn’t change last week.
On Monday, I sent the following to members:
(you may receive my "almost" nightly market notes by registering at the top left)
Be in Cash or Be Hedged
"It had been relatively quiet in the financials ever since the Bear
Stearns debacle and the capitulation surrounding that certainly
created a bottoming process and paved the way for a run in the
indices which is where we sit now. However, the magnitude of the
problems in housing and in skyrocketing oil prices don’t get sorted
out in a few months time. Sure, you could argue that the economic
numbers haven’t been all that bad and the trend of weak, but better
than expected economic numbers certainly does continue. Today the
ISM Manufacturing Index came in a bit weak and continued to indicate
some contraction, but came in better than expected and higher than
the previous month at 49.6. BUT, how long can it last? The US
economy is incredibly resilient as it proved after the tech bust and
Septemeber 11 attack but how much can it bend without breaking? That
certainly remains to be seen and all predications are just
..predictions. One thing is for certain though. The indices are
indicating intermediate topping action following this healthy spring
rally. As I mentioned in my weekend report, why not lock in some of
that hard earned profit and sit tight for a couple weeks and let the
economic data flow and the indices give us a better indication of
where it’s headed next?
On the technical side of things, the action in the indices could have
been far worse than where we closed. Down 200 in the Dow at one
point, you got the feeling that maybe we’d get one of those big 300
– 400 point swoons.. something we haven’t seen in some time.
However, I was impressed by the way the market held it together and
staged a little rally at the end of the day. Volume was not heavy
today and indicated fairly healthy profit taking following last week’s
advance. The Nasdaq took out support of the 200 day moving average
again, but the S&P was able to hold above the 50 day moving average..
a somewhat remarkable feat considering the financial headlines today.
If you’re able to keep fairly close tabs on the market each day,
there are some good trading opportunities out there on the long side
but I recommend hedging those with some short plays or simply buying
put options. If you don’t have time to watch this market closely
right now, are an inexperienced trader and/or are accustomed to
longer hold times, I feel the best strategy is to sit on the
sidelines for a couple weeks to see how this pull back shakes out."
The following day, the selling was more severe and the following was sent to members:
Dow and S&P Have April Lows in Sight
"Today’s technical action was significantly more severe than
yesterday as sell volume came in above average indicating
institutional distribution. It sets us up for further deterioration
in the coming days. The S&P finally penetrated that 50 day moving
average which could be preparation for a move down to the April lows
at 1325. The Nasdaq remains submerged below the 200 day moving
average and in all likelihood will test the 50 day moving average
around 2400. The Dow is having the most difficulty and has taken out
both key support levels of the moving averages and will most likely
test the April lows in the 12200 range in the coming days."
Then we got that out of blue move on Thursday, pushing the Nasdaq right to the brink of a potential breakout move. There was some momentum behind it so I had to respect it to some degree, but still wary of a potential double top in the Nasdaq given the bearish signals of the previous days. I sent the following to members Thursday night:
Nasdaq Within Striking Distance
"I have to admit, today’s move took me completely by surprise and the
action kind of reminded me of the irrational trading in the latter
half of 07 when it seemed the technicals didn’t matter much.
Earlier this week, we got significant distribution as the indices
slid further from important resistance areas. The Dow looked down
right ugly. Then bammo! A nearly 2% surge in the indices with a
little momentum behind it as the market seemed to ignore the
financial turmoil (a cut in ratings for Ambac & MBIA) that it had
sold off on just earlier in the week. The trend of "better than
expected" economic numbers continued today with a decline in weekly
jobless claims and decent May retail numbers which some expect to be
strong again in June due to the stimulus of rebate checks. Rather
than hurting the market today, a $5 surge in crude ignited the market
with energy leading the way with a more than 4% advance.
So where does it leave us? You know I’ve been mentioning that it’s
best to be cautious up here and I still think that is the best
strategy until proven otherwise. While this one day of trading does
negate some of the bearishness in the technicals recently, it
doesn’t signal that the coast is clear. It’s still just one day of
trading likely fueled in large part by short covering. I said that
if I was wrong and the indices broke out to new all time highs, than
I’d simply adjust my strategy and get more aggressive long. With
today’s surge, the Nasdaq is sitting right on the May high which is
a significant source of resistance. The S&P reclaimed support of the
50 day moving average and it just may hold that level. As for the
Dow, it’s got significant technical damage to repair and today’s move was
a good start towards that. For me to get increasingly long, I want
to see the Nasdaq take out that May high and close above it, then
pull back in an orderly fashion. When the Dow re-tested its May high
on May 19th , it quickly sold off 700 points in a couple weeks so we
have to be mindful of a double top in the Nasdaq as well. "
The Nasdaq wouldn’t come close to a breakout attempt on Friday as the unemployment rate spiked higher than expectations and crude soaring yet again to record highs with $150/barrel in sight. The big surprise to me on Friday? That the average work week came in at 33.7.. who the heck works less than 40 hrs anymore? The action on Friday as downright ugly with institutions clearly dumping large positions. Let’s take a look at the major indices below.
The Nasdaq is without a doubt leading the way and is actually in relatively decent shape up here, but I still think it needs to come back and test where the May lows and 50 day moving average converge around 2425. It wouldn’t mind seeing it bounce around in this range for another month or two, setting it up for a breakout attempt above 2550. Volume was not particularly intense on Friday which is encouraging. Note the double top in the making at 2550.

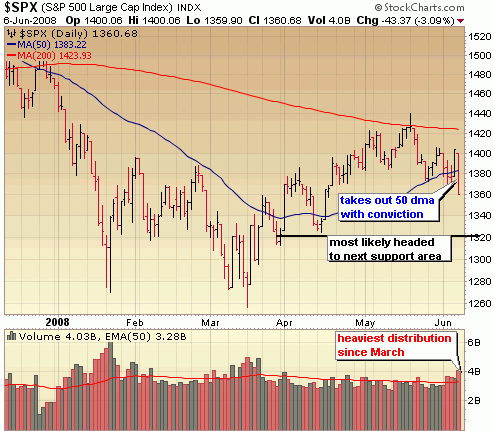
It’s a much different story in the S&P, which took out the June and May lows (and the 50 dma yet again) with big time conviction. We could certainly see a bit of a bounce to come back and test what is now resistance of the 50 dma before testing the next level of support around 1320, but I wouldn’t bet on it.
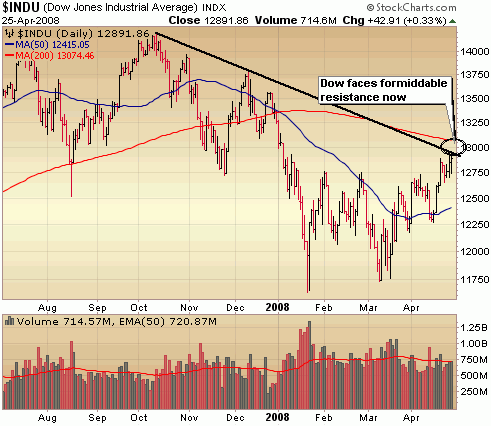
It gets even uglier in the Dow which has been sliding for weeks now, following a double top of its own up around 13200. It’s sitting on some minor support area right now but given the fact it was down 400 on Friday with absolutely no buy interest throughout the day, it is just a matter of time before it starts trading down around those March lows.

::: Model Portfolio :::
** This section will now appear as a separate report about every other Wednesday.
The Self Investors Model Portolio wrapped up 2007 with a 30.2% gain and features annualized returns of 24%. Would you like to receive buy and sell alerts within minutes (NEW! now get them via instant messaging in near real time) of each transaction in the portfolio? You can receive these along with ALL of the tracking tools and reports with the very popular Gold membership. Don’t delay, get started today and join me for many more highly profitable months here at SelfInvestors.com.
::: Best/Worst Performers :::
– Top 10 Performing Industries For the Week –
1. Agricultural Chemicals: 6.05%
2. Music & Video Stores: 3.60%
3. Healthcare Info: 2.90%
4. Independent Oil & Gas: 2.75%
5. Regional Airlines: 2.40%
6. Electronics Wholesale: 2.10%
7. Long Distance Carriers: 1.80%
8. Oil & Gas Equipment & Services: 1.50%
9. Wholesale – Other: 1.45%
10. Printed Circuit Boards: 1.40%
– Top 10 Worst Performing Industries For the Week –
1. Meat Productss: -10.60%
2. Banks – SE: -10.50%
3. Surety & Title Insurance: -10.10%
4. Advertising Agencies: -9.40%
5. Aerospace/Defense: -9.10%
6. Residential Construction: -8.50%
7. Auto Parts Wholesale: -7.90%
8. Banks – MidAtlantic: -7.75%
9. Jewelry Stores: -7.30%
10. Foreign Regional Banks: -7.20%
– Top 5 Best Performing ETFs For the Week –
1. Greater China Fund (GCH) 5.70%
2. Turkish Invest (TKF) 5.60%
3. HLDRS Internet Architecture (IAH) 5.40%
4. Japan Small Cap (JOF) 5.20%
5. HLDRS Broadband (BDH) 4.65%
– Worst 5 Performing ETF’s –
1. iShares Silver (SLV) -6.25%
2. Thai Fund (TTf) -6.15%
3. Asa Limited Gold (ASA) -4.60%
4. Market Vectors Gold Miners (GDX) -4.50%
5. iShares Gold (IAU) -3.90%
::: Upcoming Economic Reports (6/9/2008- 6/13/2008) :::
Monday: Pending Home Sales
Tuesday: Trade Balance
Wednesday: Fed Beige Book, Treasury Budget, Crude Inventories
Thursday: Export/Import Prices, Initial Claims, Retail Sales, Business Inventories
Friday: CPI
::: Earnings I’m Watching This Week :::
Monday:
Exide (XIDE)
Tuesday:
Quality Systems (QSII)
Thursday:
China Medical Technologies (CMED)
I expect the Dow Jones to rebound Monday as it is not often that we can see it shedding 400 points in a day. There was panic selling, to a certain extent, as shortists triumphed and stop-loss orders issued hurriedly.
If the Dow falls to March lows, my gut feeling is another strong rally to at least 12800 level and from there, it may break away if oil can come under control. There is already good news that we are out of the woods on food prices.
Jeff
http://jeflin.net