All posts by Tate Dwinnell

Selling in May Is Not a Bad Strategy

I’ve been talking quite a bit about the formiddable resistance areas the indices are now testing and not much has changed there, so I’ll keep it brief and just throw up the charts.  Actually, the real reason is that it’s Sunday and a real beauty in Seattle where I’m visiting for the weekend.  The last thing I want to be doing is discussing the market. 

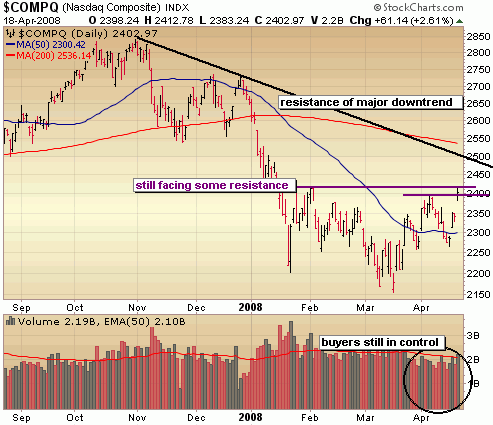
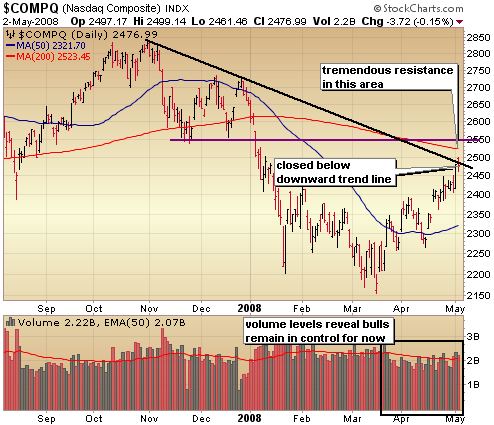
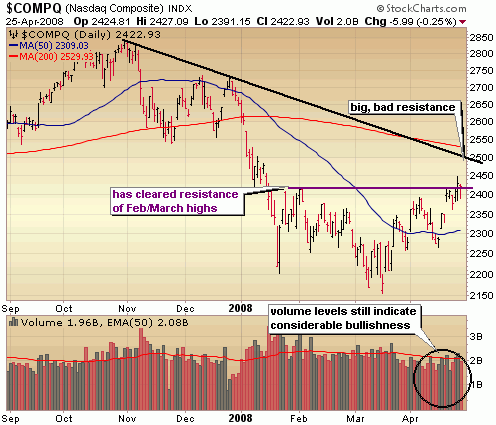
The Nasdaq briefly took out the downward trend line on Friday but ultimately closed below this important level of resistance.  While volume levels still indicate that bulls are in control, the market is currently very much oversold and facing formiddable resistance levels.  I think we could get another 2% out of this run, but I’ve already begun paring back long positions.  Be on the lookout for distribution or churn days to signal that this run has fully run its course.  We haven’t seen this yet, but it should happen soon.
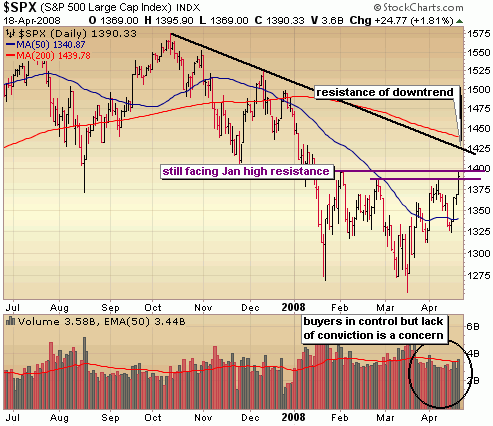
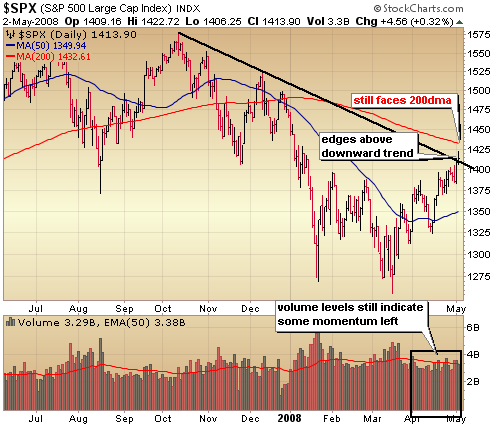
The S&P cleared and held above the downward trend line on Friday, clearing the way for a potential test of the next level of resistance around the 200 day moving average.  There appears to be some momentum left in this market which should carry the S&P up to this level, but as I said above be on the lookout for distribution.  That will signal the beginning of the end for this rally.
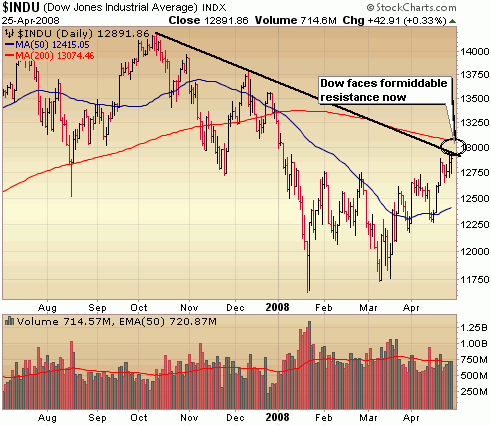
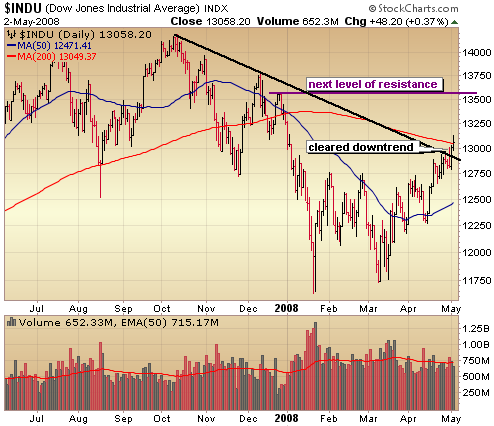
I mentioned in the last report that I thought it would be difficult for the Dow to get above the downward trend line and if so it would still have to face tough resistance of the 200 day moving average.  Well, it’s cleared the downtrend and briefly nudged above the 200 day moving average.  An impressive showing for the Dow for sure and if distribution doesn’t show up soon it could very well test the next level of resistance just above 13500. 
The bottom line is that this market has come quite far, quite fast as the indices negotiate tough resistance levels heading into what is notoriously a very difficult month for the market.  Beginning a month ago, I was adding positions on the pull backs but now I’m selling into rallies rather then waiting for a big day of distribution.  Essentially I’m getting much more conservative after locking in some big profits over the past few weeks and will stick to very short term trading over the next several weeks to capitalize on any additional strength.  If you’re not a short term trader, it probably makes sense to move a big portion to cash over the next month or so. 

::: Model Portfolio :::

** This section will now appear as a separate report about every other Wednesday. 

The Self Investors Model Portolio wrapped up 2007 with a 30.2% gain.  Would you like to receive buy and sell alerts within minutes (NEW! now get them via instant messaging in near real time) of each transaction in the portfolio?  You can receive these along with ALL of the tracking tools and reports with the very popular Gold membership.  Don’t delay, get started today and join me for many more highly profitable months here at SelfInvestors.com.

::: Best/Worst Performers :::

– Top 10 Performing Industries For the Week –

1. Major Airlines: 13.05%
2. Confectioners: 12.65%
3. Credit Services: 8.85%
4. Asset Management: 8.65%
5. Regional Airlines: 8.20%
6. Education & Training Services: 7.80%
7. Long Term Care Facilities:  7.45%
8. Food Wholesale: 7.20%
9. Toy & Hobby Store: 6.90%
10. Grocery Stores: 6.70%

– Top 10 Worst Performing Industries For the Week –

1. Heavy Construction: -7.40%
2. Farm Products: -6.85%
3. Music & Video Stores: -6.30%
4. Nonmetallic Mineral & Mining: -6.20%
5. Silver: -6.05%
6. Cigarettes: -5.20%
7. Copper: -5.00%
8. Packaging & Containers: -4.95%
9. Agricultural Chemicals: -4.90%
10. Medical Practitioners: -6.00%

– Top 5 Best Performing ETFs For the Week –

1. Greater China Fund (GCH)  11.30%
2. Morgan Stanley China (CAF) 11.20%
3. Japan Small Cap (JOF) 7.20%
4. iShares Brazil (EWZ) 6.60%
5. Morgan Stanley (IIF) 5.40%

– Worst 5 Performing ETF’s –

1. Market Vectors Agribusiness (MOO) -5.20%
2. Market Vectors Gold Miners (GDX) -4.75%
3. Asa Gold (ASA) -4.60%
4. SPDR Materials (XLB)  -3.35%
5. Malaysia Fund (MAY) -3.30%

:::  IPO’s Worth Watching for This Week :::

This section will now appear as a separate post on Mondays.

While 2008 should be a much slower year for IPO’s considering the deterioration of the market, there will continue to be some good companies coming to market here and there.  I’ll be highlighting the best IPO’s every Monday.

::: Upcoming Economic Reports (5/4/2008- 5/9/2008) :::

Monday:        ISM Services 
Tuesday:       None
Wednesday:  Productivity, Pending Home Sales, Consumer Credit, Crude Inventories
Thursday:      Initial Claims, Wholesale Inventories
Friday:           Trade Balance

::: Earnings I’m Watching This Week :::

Monday: 
Alpha Natural Resources (ANR), Cleveland Cliffs (CLF), Continental Resources (CLR), eResearch (ERES), Gafisa (GFA), Partner Communications (PTNR), Tidewater (TDW), Vulcan Materials (VMC)

Tuesday:
Banco Itau (ITU), Blue Nile (NILE), Cisco (CSCO), Corrections Corp (CXW), DR Horton (DHI), Henry Schein (HSIC), NYSE Euronext (NYX), Simcere Pharma (SCR), Sun Hydraulics (SNHY), Synchronoss Tech (SNCR), Ultra Petroleum (UPL)

Wednesday:
AirMedia (AMCN), Allis Chalmers (ALY), American Oriental (AOB), Clean Harbors (CLHB), Credicorp (BAP), Crocs (CROX), Devon Energy (DVN), Expeditors Intl (EXPD), Foster Wheeler (FWLT), FTI Consulting (FTI), Hansen Natural (HANS), Mindray Medical (MR), Perini Corp (PCR), T3 Energy Services (TTES), Yamana Gold (AUY), Transocean (RIG)

Thursday:
Aecom (ACM), Akeena Solar (AKNS), Arena Resources (ARD), Balchem (BCPC), Ceco Environmental (CECE), Dawson Geophysical (DWSN), Delta Petroleum (DPTR), Flotek (FTK), Global Industries (GLBL), Koppers Holdings (KOP), NGAS Resources (NGAS), Nvidia (NVDA), Pioneer Drilling (PDC), Priceline.com (PCLN), Ricks Cabaret (RICK), NASDAQ Group (NDAQ), Toyota Motor (TM), Unibanco (UBB), Watson Wyatt (WW)

Friday:
Rosetta Resources (ROSE), US Global Investors (GROW)

::: In Case You Missed It – SelfInvestors Blog Entries of the Past Week :::

1. Barry Hot on the Heels of the Plunge Protection Plunge Team

2. Visa (V) Vs. Mastercard (MA): Earnings Results

3. Peak Oil, Peak Water.. We’re All Gonna Die

4. Buying International Stocks
 

Buying International Stocks

The following is a good article from DailyWealth about buying international stocks.  I personally just stick to ADR’s and ETF’s but if you’re interested in buying international stocks directly "like a local" this article might be helpful to you.

By Tom Dyson
I just had a long chat with Howard Goldstein and Dave Sjuggerud. Dave is Steve’s dad. He and his business partner, Howard, are international stockbrokers. They’ve dealt international stocks for more than 17 years.
I called them up because a reader e-mailed me yesterday… He wanted to buy a stock I recommended last month in my income advisory, The 12% Letter. The stock has a large market capitalization, and there’s plenty of liquidity… but it trades in Canada.

The reader told me E*Trade refused to buy shares for him because "the stock is only open to Canadian residents."

I called Dave and Howard because I wanted to find out the cheapest way to buy international stocks like this one. Today, there are more opportunities to make money outside the U.S. than inside. So to be successful, an investor must know how to buy international stocks.

The stock my reader wants to buy, for example, pays a 12% dividend, and its business situation makes for a compelling investment opportunity. I want all my readers to buy this stock.

Here’s what I learned:

First of all, E*Trade misinformed my reader. Some Canadian stocks are unavailable to U.S. investors. Limited partnerships are one example. But this stock is not one of those. U.S. investors may buy this stock.

So the problem arose because discount brokers, like E*Trade, are lazy. They don’t want to buy international stocks. It’s hard work for them. And the commissions are lower. I’ve had this problem with Fidelity before, too. Fidelity wouldn’t purchase a Toronto stock for me last year.

Because they are lazy, the discount brokers either tell you the stock is unavailable or they force you to buy the pink sheet listing of the stock instead.

The pink sheets make up a sort of mirror market. It’s like the difference between Sotheby’s and eBay. It’s not an exchange. It’s more like a bulletin board where brokers offer securities for sale. Stockbrokers call this market "over-the-counter."

If you search for international stocks in Yahoo, it’ll often bring up a pink sheet listing. You can spot them by their symbols, which have five letters and often end in the letter "Y" like SGAPY for SingTel or BAIRY for British Airways. They also have the suffix .PK or .OB.

Pink sheet dealers give bad deals. Take the stock my reader asked about. Howard could buy and sell this stock with a 2-cent bid-ask spread in Toronto. (A bid-ask spread is the difference between the price a seller will accept and the price a buyer will pay. The narrower the bid-ask spread, the closer you’re paying to a fair market price.) We called up a quote from the pink sheet market. They quoted us a 40-cent bid-ask spread.

If you must use the pink sheets to buy a stock, look up your stock’s price in the local market, convert it to dollars, and then place a limit order a couple of pennies above that price in the pink sheet market.

But I just don’t think you should buy pink sheet stocks. And in the future, when I recommend an international stock in one of my reports, I’m going to advise you not to buy the pink sheet, even if your broker won’t get the stock on the true international exchange.

Instead, I recommend you use one of three international stockbrokers our readers have worked with before. I don’t receive any compensation for mentioning these guys, nor does Stansberry Research (DailyWealth‘s publisher). I recommend them because I know them and I trust them. They have excellent reputations in the industry. And they’ll give you fantastic service, too… You can’t buy international stocks cheaper anywhere else.

Take an Australian stock for example. The Australian market trades during the night. When the U.S. market is open, the Australian market is closed. But a pink sheet dealer will give you a quote on an Australian stock during normal U.S. market hours. How can he do this? He’ll make you pay a wide spread to cover his risk. His risk is that the Australian stock moves sharply when the market opens the next day.

But when you use Howard and Dave, they’ll keep your order open until the international market opens, and buy the stock direct… even if it means they have to wait until midnight to fill your order.

"Tell your readers to call us after they’ve called all their other brokers," said Howard. "Why? Because I know we’ll give them the best deal."

Howard says he pays spreads on shares in Australia, Hong Kong, and China that are so small, you can’t even calculate them.

It’s easy to do business with these guys, too. They can have your account open in about 24 hours… and loaded with your favorite international shares… at the same prices the local brokers in those foreign countries pay.

Related Articles

The One List You Need to Profit from "Chimerica"

These Canadian Income Trusts Will Keep Paying Huge Dividends

You can call Howard at 1-877-539-1004 or e-mail Hgoldstein@lasallest.com. Our readers have also done well with Rick Rule, who specializes in commodity stocks (1-800-477-7853, www.gril.net) and Jeff Winn (1-800-432-4402, Jwinn@iaac.com).

The discount brokers have their place… but for the cheapest trades on international stocks, you should work with brokers who know what they’re doing and can provide you with the best prices. Investors who know how to buy international stocks have many more opportunities open to them. Make sure you’re not missing out.

Good investing,

Tom

Peak Oil, Peak Water.. We’re All Gonna Die

Let’s keep this in context.. gloom and doom sells.  Period.  I’m not disputing the fact that scarce commodities are becoming increasingly valuable but I don’t buy all the gloom and doom either.  That being said, I just read a good article on Peak Water from Wired.

Here are the cliffs notes for those short on time:

* 1.1 billion people, about one-sixth of the world’s population, lack access to safe drinking water.

* Shortages are reaching crisis proportions in even the most highly developed regions, and they’re quickly becoming commonplace in our own backyard, from the bleached-white bathtub ring around the Southwest’s half-empty Lake Mead to the parched state of Georgia, where the governor prays for rain.

* … This is not to say the world is running out of water. The same amount exists on Earth today as millions of years ago — roughly 360 quintillion gallons. It evaporates, coalesces in clouds, falls as rain, seeps into the earth, and emerges in springs to feed rivers and lakes, an endless hydrologic cycle ordained by immutable laws of chemistry. But 97 percent of it is in the oceans, where it’s useless unless the salt can be removed — a process that consumes enormous quantities of energy.

* Freshwater is the ultimate renewable resource, but humanity is extracting and polluting it faster than it can be replenished.

* If moneyed special interests determine the going price of water, eventually they will edge out users who can’t afford to pay top dollar. Agriculture will be squeezed out, as will water rights for poorer communities. And the environment, it goes almost without saying, will twist in the wind

* "People need to get away from the idea that you just turn on the tap and all the water you want is there"

* Stripping seawater of its salt is a pricey way to obtain freshwater, cost-effective only for high-end uses like drinking, but not bathing or watering gardens.

* The country (Australia) was founded during the second-worst drought in its history, but the worst dry spell is unfolding right now. Rainfall, which has declined to 25 percent of the long-term average, is projected to plummet another 40 percent by 2050.

* The price of beer has been rising since a jump in barley prices, a development that many joke could lead to large-scale civil unrest. But it’s no joke: The global price of wheat hit its highest level in decades in December, partly due to Australia’s water shortage.

* Americans already use 20 percent less water per capita than they did a generation ago. Gains in industrial use are even more impressive: A ton of US steel manufactured today requires just 2 percent of the water it did in the 1940s. Still, we are using more than we have. Can we change enough, and soon enough?

Investing in companies that control, distribute and/or purify water are probably safe bets over the next several years.  Two ETF’s provide a diversified way to do that – the PowerShares Water Portfolio (PBW) and the Claymore S&P Global Water Index ETF (CGW)

Visa (V) Vs. Mastercard (MA): Earnings Results

Now that both credit card behemoths have issued earnings results (Visa for the first time as a public company) I thought it would be interesting to compare the results from each side by side.  As you’ll see, both companies beat analyst estimates and reported great quarters which were fueled by international growth and big increases in global debit card use (Visa reported that International debit card use soared 43.5% last quarter!)

From a technical perspective Mastercard (MA) appears to be well on its way to the next level of resistance around 300.  Visa (V), after breaking out from a bullish triangle a few weeks ago is a bit extended over the short term but based on today’s big reversal off the lows, may have a bit more room to run as well.  Frankly, I’m a little bit surprised at how much Visa has moved following the IPO, considering the amount of hype already built into the stock.  I am looking to take profits in Visa soon and will look take profits in Mastercard around 300.


Q1 2008 Numbers

Visa (V)

Mastercard (MA)

Size (market cap) 77 billion 35 billion
% Market Share 60% 32%
Total Revenues 1.45 B (22% over year ago) 1.18 B (29% over year ago)
Net Profit (excluding one time gains) .52/share (49% over year ago) 2.59/share (65% over year ago)
Analyst Est. EPS .45/share 2.00/share
US Growth (in gross dollar volume) 10% 9%
Intl Growth 27% 30%
Payment Volume 19% 16%
Cards in Circulation (% Increase) 16% 12%
Transactions Processed (% inc.) 16% 15%
CEO Quotes "Despite a challenging economic environment, Visa recorded strong growth in payments volume and transactions globally and across our diverse suite of products — a trend which is continuing into the fiscal third quarter" MasterCard continues to see U.S. growth "despite continued economic uncertainty," and  international regions are "driving significant growth."
Analyst Comments – "unique brand value and processing scale that differentiate the company from its payment peers."
– the secular story and the longer-term growth and earnings potential remain extremely compelling
"We are encouraged by these results given investors’ concerns regarding a major U.S. economic slowdown and, by extension, slower growth elsewhere," wrote KeyBanc analyst Anurag Rana in a note.
Technicals After breaking out of a bullish triangle formation a few weeks ago, the stock is now extended and probably has limited upside over the next several months Big, bullish gap up today could propel stock to major resistance around 300.
Notes International growth and increased debit-card use at home were the two main drivers for the San Francisco-based company’s results
– Consumers will use credit and debit cards for 55 percent of all U.S. transactions by 2011, rising from 40 percent in 2005, according to the Nilson Report
– Currency fluctuations contributed to 5% of revenue growth
– A price increase in cross border acquiring fees contributed 6% to revenue growth


Disclaimer: I own positions in both Visa (V) and Mastercard (MA)

Beware ‘O Major Resistance in Indices

I’ll keep it fairly short this week.  The indices haven’t done much since my last analysis and still look considerably bullish but that could change in a hurry as major resistance of the downward trends loom.  As mentioned in the last analysis, where is the leadership going to come from if the oil and the ags continue to deteriorate?  Is tech ready to finally step up in a big way?  I don’t think it’s quite ready to do that. 

After a more than 10% rise off those March lows I believe it’s time to begin getting more conservative and taking some profit off the table, especially if a big distribution day appears which we haven’t seen in quite some time.  Let’s have a look at the indices.

You see that the volume levels still look good as buy volume continues to outweigh sell volume.  There is certainly enough momentum to push us higher but keep a very close eye on that big resistance area of the downtrend.  I think we’re going to have a heck of a time getting above that. . and if we do?  Resistance of the 50 day moving average is not far behind. 

42708_naz

The S&P edged up just a bit above resistance of the Feb highs and it too has some life left in it.  I do think we’ll test that major resistance area of the downward trend at some point fairly soon.  When we do, it’s time to take some chips off the table.  Keep an eye out for a big, high volume reversal day which
often signals topping action.

42708_sp500

Well how about the Dow! It’s already testing this major source of resistance.  The battle between buyers and sellers should be mighty interesting next week.  I mentioned the high volume reversal as a signal of topping action.  Also keep an eye out for churning which is a higher volume day than the day before with very little price progress.  That’s an indication that institutions are selling into rallies.

42708_dow

::: Model Portfolio :::

** This section will now appear as a separate report about every other Wednesday. 

The Self Investors Model Portolio wrapped up 2007 with a 30.2% gain.  Would you like to receive buy and sell alerts within minutes (NEW! now get them via instant messaging in near real time) of each transaction in the portfolio?  You can receive these along with ALL of the tracking tools and reports with the very popular Gold membership.  Don’t delay, get started today and join me for many more highly profitable months here at SelfInvestors.com.

::: Best/Worst Performers :::

– Top 10 Performing Industries For the Week –

1. Toy & Hobby Stores: 13.15%
2. Hospitals: 11.55%
3. Processing Systems & Products: 8.75%
4. Education & Training Services: 8.70%
5. Consumer Services: 6.70%
6. Investment Brokerage: 6.50%
7. Networking & Comm Devices:  6.30%
8. Research Services: 5.70%
9. Technical & System Software: 5.35%
10. Personal Services: 5.10%

– Top 10 Worst Performing Industries For the Week –

1. Computer Based Systems: -11.45%
2. Surety & Title Insurance: -10.55%
3. Silver: -10.20%
4. Major Airlines: -9.50%
5. Aluminum: -7.65%
6. Electronics Wholesale: -7.65%
7. Gold: -7.35%
8. General Entertainment: -7.00%
9. Music & Video Stores: -6.35%
10. Specialty Eateries: -6.00%

– Top 5 Best Performing ETFs For the Week –

1. MorganStanley China (CAF)  17.10%
2. SPDR China (GXC) 8.00%
3. Greater China Fund (GCH) 7.60%
4. Claymore China Real Estate (TAO) 7.45%
5. Ishares China (FXI) 7.40%

– Worst 5 Performing ETF’s –

1. Market Vectors Gold Miners (GDX) -8.05%
2. Asa Gold (ASA) -6.90%
3. iShares Silver (SLV) -5.60%
4. Powershares Agriculture (DBA)  -5.25%
5. Central Fund of Canada (CEF) -4.90%

:::  IPO’s Worth Watching for This Week :::

This section will now appear as a separate post on Mondays.

While 2008 should be a much slower year for IPO’s considering the deterioration of the market, there will continue to be some good companies coming to market here and there.  I’ll be highlighting the best IPO’s every Monday.

::: Upcoming Economic Reports (4/28/2008- 5/2/2008) :::

Monday:        None
Tuesday:       Consumer Confidence
Wednesday:  Fed Rate Decision, GDP, Chicago PMI, Crude Inventories
Thursday:      Auto/Truck Sales, Initial Claims, Personal Income/Spending, PCE Core Inflation
                      Construction Spending, ISM Index
Friday:           Nonfarm Payrolls, Unemployment Rate, Factory Orders


::: Earnings I’m Watching This Week :::

Monday: 
Authentec (AUTH), BE Aerospace (BEAV), CDC Corp (CHINA), China National Offshore (CEO), Flowserve (FLS), FMC Technologies (FTI), Gen-Probe (GPRO), GFI Group (GFIG), Integral Systems (ISYS), Interactive Intelligence (ININ), Manitowac (MTW), Mastercard (MA), Portfolio Recovery Associates (PRAA), SOHU.com (SOHU), Southern Peru Copper (PCU), Titan Machinery (TITN), Visa (V)

Tuesday:
American Ecology (ECOL), American Medical Systems (AMMD), Archer Daniels Midland (ADM), Banco Bradesco (BBD), Compania de Minas Buenaventura (BVN), Countrywide Financial (CFC), Cybersource (CYBS), Express Scripts (ESRX), General Cable (BGC), Genesee & Wyoming (GWR), Monolithic Power Systems (MPWR), Open Text (OTEX), Ritchie Bros (RBA), Santander Central Hispano (STD), TheStreet.com (TSCM), Under Armour (UA), VistaPrint (VPRT)

Wednesday:
Centex (CTX), Central European (CEDC), Central European Media (CETV), Chicago Bridge & Iron (CBI), Concur Tech (CNQR), Cummins (CMI), First Solar (FSLR), Garmin (GRMN), Intellon (ITLN), Oceaneering (OII), Omniture (OMTR), Proctor & Gamble (PG), Psychiatric Solutions (PSYS), Strayer Education (STRA), Tetra Tech (TTEK)

Thursday:
Bankrate (RATE), Cameron (CAM), Chart Industries (GTLS), Chesapeake Energy (CHK), Comcast (CMCSA), ExxonMobil (XOM), Green Mountain Coffee Roasters (GMCR), Hologic (HOLX), Hornbeck Offshore (HOS), Investools (SWIM), Natus Medical (BABY), Noble Energy (NBL), Novamed (NOVA), Pride Intl (PDE), Rowan Companies (RDC)

Friday:
Agrium (AGU), Chevron (CVX), Intercontinental Exchange (ICE)

::: In Case You Missed It – SelfInvestors Blog Entries of the Past Week :::

1. Google Catalyst for Big Break, But Big Resistance Remains

2. Hot IPO’s: Intrepid Potash (IPI) & American Water Works (AWK)

Hot IPO’s: Intrepid Potash (IPI) & American Water Works (AWK)

Last year was a big year for IPO’s, but it’s been a slow start this year with the market languishing.  Outside of the Visa (V) IPO, there has been little for traders to get excited about.  That is until today when the largest producer of potash, Intrepid Potash (IPI) began trading and soaring more than 50%.

42208_intrepidpotash According to MSN, the mining company produces two potassium-containing minerals, potash and langbeinite, that are essential nutrients in plant and crop fertilizer. Intrepid culls these minerals from five mines in New Mexico and Utah, where it also operates production facilities. Potash accounts for 90% of its sales. The company sells primarily within the US to the agricultural, industrial, and feed markets; PotashCorp sells Intrepid’s potash internationally. It supplies nearly 10% of US potash consumption annually and is the country’s largest producer of the stuff. (The US imports the great majority of the potash it uses.)

As far as the fundamentals, they look solid but nothing extraordinary.  My take on this is that this IPO comes at a time when the agriculture stocks appear to be near a major top with perhaps one more last climax run left in them.  Does this IPO signal the top?  Just maybe.  Like all IPO’s I’ll let it trade for at least two weeks and only enter on a breakout from a bullish pattern. 

:::::::::::::::::::::::::

Today, the largest potash producer in the US began trading.  Tomorrow, one of the largest US water utility holding company will begin trading – American Water Works (AWK), a subsidiary of German utility giant RWE.

42208_americanwaterworks According to MSN, it’s one of the largest water utility holding companies in the US. Through its regulated utilities and its contract services division, American Water Works serves more 16.2 million consumers in 32 US states, Canada, and Puerto Rico. The company also provides wastewater treatment in some of its service areas. Nonregulated subsidiary American Water Works Service provides contract management services for water and wastewater systems.

This company has one thing going for it.. ok two things.  It’s big and it’s a water play.  I’ve been big on the water play for a couple years now and still think you’ll see meteoric rises in water stocks at some point, but this utility lacks greats fundamentals.

Here are some previous articles I wrote relating to water:

Thirsty For Profits? Go Get Some Water – Powershares Water Resources ETF (PHO) (2006)
Legendary Oil Investor T. Boone Pickens Thirsty for Water Rights (Jan 2007)

Google Catalyst for Big Break, But Big Resistance Remains

It’s no secret that the character of this market has been shifting over the past several weeks as the market adjusts to lowered expectations across the board.  However, when GE reported awful results last Friday it was a bit too much for the bull to swallow, leaving the indices in a bit of a precarious position.  .. BUT ah what a difference a week makes.  This time around Google proved all the doubters, doom and gloomers wrong.. very wrong and it provided just the spark this market needed to break out in a big way. 

Buyers remain in control with shorts running scared but how long can it last?  We’re already up 10% off the bottom and major resistance points stand in the way of another 10% mover up.  What happens when the Ag and Oil stocks begin to slip?  Can new leadership emerge?  Perhaps tech can find a grip once again following Google’s results.  I believe it’s a bit late too be getting aggressive on the long side unless you are trading in the short term.  I’ve been mentioning over the past several weeks that I’ve been adding some new long positions on the pull backs as the market appeared to be coiling for a big rally.  However, I’m not willing to get aggressive at these levels and may even look to lock in profits soon or hedge with a few short positions.

Let’s take a look at the technicals of the major indices.

The Nasdaq on Friday gapped up big and was able to clear some resistance of the April highs but still faces stiff resistance at the Jan highs.  The buy vs. sell volume indicates that buyers remain firmly in control for now.  I like the odds of breaking those Jan highs but I don’t like the odds of breaking through the major downward trend.  It’s at that point I’d be significantly paring back on long positions and getting short.

42008_naz

We see the same thing in the S&P.  A big move up on Friday but still faces some important resistance at the January highs and even bigger resistance at the major downtrend line which isn’t all that far away.  Certainly some more room to run, but if we get up into the 1425 level I’d be taking some chips off the table.  Note the relatively weak buy volume on these big moves.  Looks to be a considerable amount of short covering rather than big conviction on the part of institutions.

42008_sp500

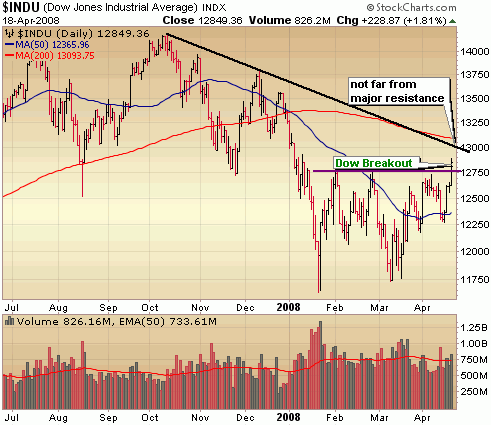
The Dow did manage to bust through those January highs, but look how close that downward trend line is.  Just 150 points away!  It’s possible that this rally ends as quick as it began.  Such is a bear market rally.

42008_dow

 ::: Model Portfolio :::

** This section will now appear as a separate report about every other Wednesday. 

The Self Investors Model Portolio wrapped up 2007 with a 30.2% gain.  Would you like to receive buy and sell alerts within minutes (NEW! now get them via instant messaging in near real time) of each transaction in the portfolio?  You can receive these along with ALL of the tracking tools and reports with the very popular Gold membership.  Don’t delay, get started today and join me for many more highly profitable months here at SelfInvestors.com.

::: Best/Worst Performers :::

– Top 10 Performing Industries For the Week –

1. Publishing – Periodicals: 29.35%
2. Dairy Products: 12.35%
3. Oil & Gas Equipment & Services: 10.95%
4. Internet Info Providers: 10.80%
5. Nonmetallic Mineral & Mining: 10.55%
6. Shipping: 9.85%
7. Investment Brokerage:  9.80%
8. Farm Products: 9.75%
9. Technical & System Software: 9.30%
10. Farm & Construction Machinery: 8.90%

– Top 10 Worst Performing Industries For the Week –

1. Major Airlines: -6.50%
2. Resorts & Casinos: -5.05%
3. Diagnostic Substances: -3.45%
4. Research Services: -2.70%
5. Long Distance Carriers: -2.40%
6. Personal Products: -2.25%
7. Banks – NE: -2.25%
8. Medical Appliances & Equipment: -1.85%
9. Medical Equipment Wholesale: -1.80%
10. Regional Airlines: -1.35%

– Top 5 Best Performing ETFs For the Week –

1. HLDRS Oil Services (OIH)  12.55%
2. India Fund (IFN) 10.90%
3. iShares US Oil Equipment & Services (IEZ) 10.25%
4. Morgan Stanley India Invest Fund (IIF) 10.00%
5. Powershares Dynamic Oil & Gas Equipment & Services (PXJ) 9.95%

– Worst 5 Performing ETF’s –

1. HLDRS Biotech (BBH) -1.50%
2. SPDR Gold (GLD)) -.75%
3. iShares Gold Trust (IAU) -.70%
4. HLDRS Pharma (PPH)  -.50%
5. Central Fund of Canada (CEF) -.40%

:::  IPO’s Worth Watching for This Week :::

This section will now appear as a separate post on Mondays.

While 2008 should be a much slower year for IPO’s considering the deterioration of the market, there will continue to be some good companies coming to market here and there.  I’ll be highlighting the best IPO’s every Monday.

::: Upcoming Economic Reports (4/21/2008- 4/25/2008) :::

Monday:        None
Tuesday:       Existing Home Sales
Wednesday:  Crude Inventories
Thursday:      New Home Sales, Initial Claims, Durable Orders
Friday:           Mich Sentiment (prelim)

::: Earnings I’m Watching This Week :::

Monday:
Ametek (AME), Arch Coal (ACI), Bank of America (BAC), Canadian National Railway (CNI), Fording Canadian Coal Trust (FDG), Halliburton (HAL), Netflix (NFLX), Steel Dynamics (STLD)

Tuesday:
AK Steel Holding (AKS), AmSurg (AMSG), Anixter Intl (AXE), AU Optronics (AUO), Baker Hughes (BHI), CH Robinson (CHRW), Chicago Mercantile (CME), Coach (COH), Encana (ECA), Hudson City Bancorp (HCBK), Jacobs Engineering (JEC), McDonald’s (MCD), Norfolk Southern (NSC), Options Express (OXPS), Peabody Energy (BTU), Smith Intl (SII), VMware (VMW), Yahoo (YHOO)

Wednesday:
Air Products & Chemicals (APD), Alcon (ACL), Allegheny Technologies (ATI), Aluminum Corp of China (ACH), Amazon (AMZN), Apple (AAPL), CDC Corp (CHINA), Chipotle (CMG),  EMC Corp (EMC), Range Resources (RRC), Ryland Group (RYL), Stericycle (SRCL), XTO Energy (XTO)


Thursday:
3M (MMM), Altria (MO), Baidu (BIDU), Bucyrus (BUCY), Bunge (BG), Century Aluminum (CENX), CNH Global (CNH), Deckers Outdoor (DECK), Diamond Offshore (DO), HDFC Bank (HDB), Interactive Brokers (IBKR), Life Time Fitness (LTM), MDC Holdings (MDC), MEMC Electronics (WFR), Microsoft (MSFT), Potash (POT), Rubicon (RBCN), Southwestern Energy (SWN), T Rowe Price (TROW), Terra Industries (TRA), Trade Station (TRAD), Union Pacific (UNP), VisionChina Media (VISN),

Friday:
Companhia Vale do Rio Doce (RIO)

::: In Case You Missed It – SelfInvestors Blog Entries of the Past Week :::

1. Gold Heading Lower, Natural Gas & Uranium Headed Higher? Transports Showing Leadership

2. Coiling For Big Rally? Leaders With Momentum – ATW, MTL, SD, ECOL

3. Top Breakout Stocks With Greatest Demand: Watch Digital Ally (DGLY)

4. Indices Reclaim 50 Day Moving Average Keeping Breakout Potential Intact

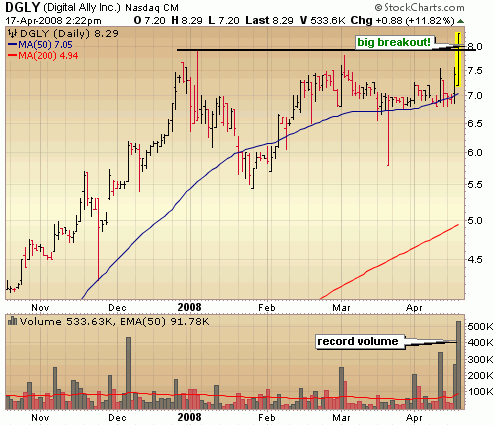
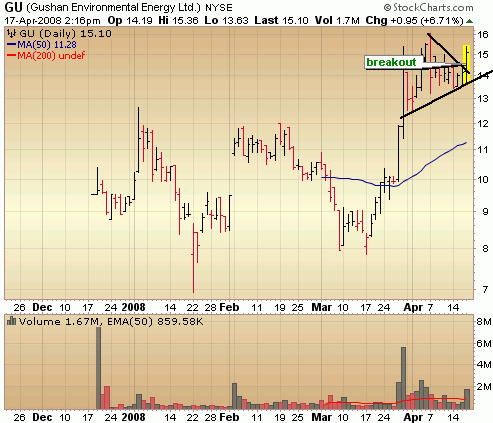
5. Breakouts! Gushan Environmental Energy (GU) & Digital Ally (DGLY)

Indices Reclaim 50 Day Moving Average Keeping Breakout Potential Intact

Just last Friday, the market wasn’t able to continue the trend of shrugging off the bad news as the big GE earnings miss had the bears growling and indices plummeting below their 50 day moving averages.  The move was enough to cast doubt on a big spring rally, but the bulls would not be denied today

It isn’t about the numbers.  It’s about expectations… and Intel, Wells Fargo and JPMorgan all beat much lowered expectations and were catalysts in kicking off the morning in the green.  Not even a gloomy outlook from the Fed or record oil prices (yet again) could keep this market down as the indices once again threw caution to the wind and and closed strong near the highs of the day.

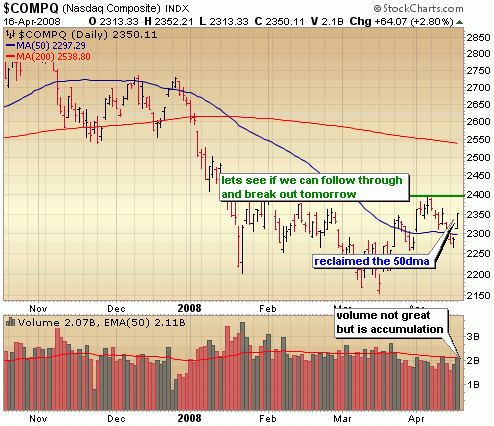
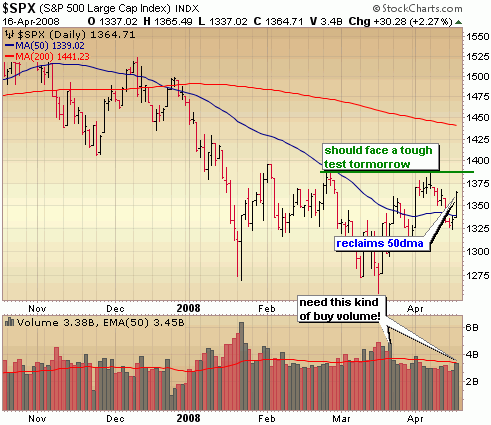
Today’s move neutralizes the bearish move of last Friday and puts the indices back in contention for a spring rally as the Nasdaq, Dow and S&P500 all reclaimed support of the 50 day moving average with a tick up in volume.  Volume certainly could have been better with such a big price gain but if we can follow through tomorrow or Friday with better volume, we just might be able to bust through those resistance levels.

Let’s have a look at the indices.

The Nasdaq gapped up above resistance of the 50 day moving average which should prove to be an important support level in the coming weeks.  Notice that volume just came in at around average but was significantly higher than yesterday so technically a day of accumulation and certainly a considerably bullish move.  Nasdaq 2400 is the next target and a significant source of resistance.  A breakout from there would be very bullish.  Perhaps strong results out of IBM and Ebay can be the catalyst for tomorrow.

41608_naz

The S&P also surged back above the 50 day moving average with average volume.  We could face big resistance around 1385 tomorrow.

41608_sp500

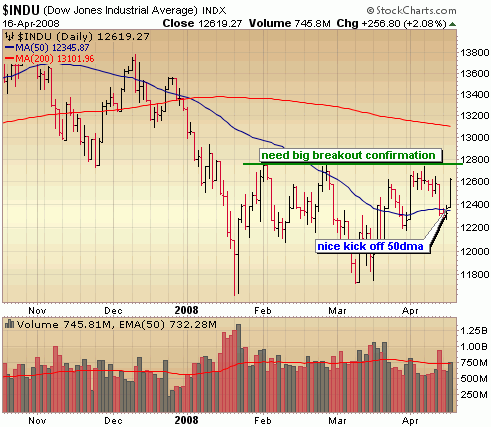
The Dow looks poised to test important resistance levels tomorrow.  We need to breakout from the channel above  the area around 12800.

41608_dow

::: Major Indices Performance – The Numbers :::

(Note: volume averages are based on the average over the past 50 days)
Data as of 4:00EST – End of Day April 16th 2008
Nasdaq: UP 2.8% today with volume at the average
Nasdaq ETF (QQQQ) 4.28%, volume 12% BELOW average
Dow: UP 2.08%, with volume 2% ABOVE the average
Dow ETF (DIA): UP 2.56%, with volume 10% ABOVE the average
S&P ETF (SPY): UP 2.71%,  with volume 18% BELOW the average
Russell Small Cap ETF (IWM): UP 3.17%, with volume 15% BELOW the average

::: SelflInvestors Leading Stocks :::

The Self Investors Leading Stocks Index is comprised of stocks in the Breakout Tracker, which is a database of the fastest growing companies near a breakout or having already broken out of a base.  Leading stocks did quite well today, outperforming all of the major indices with decent volume behind the move.

Summary:
* Advancers led Decliners 187 to 19
* Advancers were up an average of 3.68% today, with volume 10% ABOVE average
* Decliners were down an average of 1.55% with volume 72% ABOVE the average
* The total SI Leading Stocks Index was UP 3.2% today with volume 16% ABOVE average

::: Where’s the Money Flowing :::

Many investing web sites provide leading industries based on price performance alone. However, without accompanying volume levels, this can sometimes be misleading.  The only way that I know of to gauge industry/sector strength WITH volume levels is through the analysis of ETF’s.  A couple years ago this was not possible, but as more traders/investors use ETF’s they become a much better tool for gauging the health of the market and seeing where the money is flowing (or not flowing).  Using the proprietary Self Investors Demand Indicator score which measures price and volume movements, I’m able to quickly see which sectors/industries are seeing the greatest inflows of cash.  For a detailed look at how I go about gauging sector/industry strength please see the following post: http://selfinvestors.com/si/industry_tracking/

* Current Leading Sectors/Industries (over last 30 trading days):  
Homebuilders, REITs, Intl Utilities, Biotech, Clean Energy

* Current Lagging Sectors/Industries (over last 30 trading days):  
Health Care, Telecom

* Today’s Market Moving Industries/Sectors (UP):
Semis, Technology, Financials, Agriculture, Nuclear Energy, Materials

* Today’s Market Moving Industries/Sectors (DOWN): 
None

::: Stocks :::

The stocks section will be an area where I highlight one stock selected from a group of stocks moving up with volume well above average and most likely breaking out of a base or consolidation.  I don’t have time  tonight for a detailed stock of the day, so once again I provide a sample list of leading stocks moving up with big volume today (full list available in the Breakout Tracker.  There are some real gems here! (listed in order of Total Rank)

Baidu.com (BIDU) breakout!
AgFeed Industries (FEED)
Mechel Steel (MTL)
Heico (HEI)
ReneSola (SOL)
Cellcom (CEL)
Chart Industries (GTLS)
Rio Tinto (RTP) breakout!
T-3 Energy Services (TTES)
Balchem (BCPC) breakout!

Full Disclosure/Disclaimer: The stock of the day is by no means a buy recommendation.  Please do your own research and make a personal decision based on your own tolerance for risk.  I currently do own a position in Baidu (BIDU), Balchem (BCPC) and Mechel (MTL)