As the market quietly digests the big gain of last Tuesday, the big story continues to be oil which hit an all time intraday high today of 112.21/barrel and held on to much of the gains to mark an all time closing high of 110.93. The market was certainly weighed down with oil breaking out again, but overall not a bad day today. Sell volume came in below average just as it has for the past few weeks and I think we’re still in good shape for the possibility of another big rally attempt… BUT, time is running out. The longer we meander and don’t follow through from last Tuesday, the greater the chances of taking out new support levels which sets us up for another test of the lows of this correction. I think the odds are greater for another leg higher and am trading accordingly. Bad news of late has little impact on this market and when it does, there is little conviction of sellers.
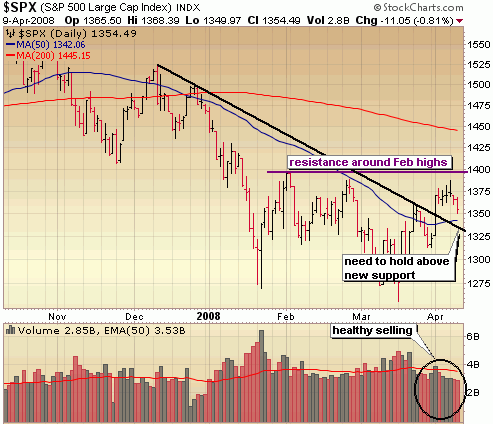
Taking a look at the S&P you see we took out the lows of the past few trading days setting up a show down with the 50 day moving average in the coming days and possibly a test of new support of the downward trend line which was broken with the big surge last Tuesday. So, a bit more room to go on the downside before a failure of this rally is a concern.
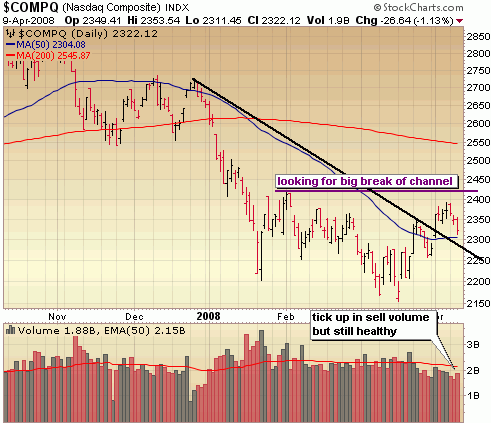
Sell volume ticked up a bit in the Nasdaq, but still came in well below average. As far as I’m concerned a healthy day of consolidation, but a test of the 50 day moving average around 2300 is almost a given with the possibility of dropping a bit further to test new support of the downward trend and the gap of last Tuesday around 2275.
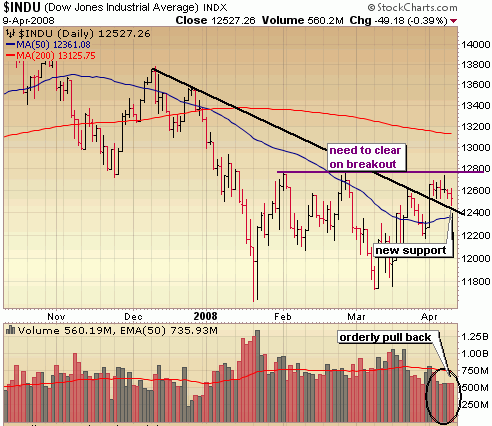
The Dow actually came very close to testing new support of the downward trend line but that was averted with a fairly impressive last hour rally today. The critical area for the Dow is around 12400. We need to hold above there to keep this rally intact.
::: Major Indices Performance – The Numbers :::
(Note: volume averages are based on the average over the past 50 days)
Data as of 4:00EST – End of Day April 9th, 2008
Nasdaq: DOWN 1.13% today with volume 1% BELOW average
Nasdaq ETF (QQQQ) DOWN 1.12%, volume 20% BELOW average
Dow: DOWN .39%, with volume 24% BELOW the average
Dow ETF (DIA): DOWN .38%, with volume 5% BELOW the average
S&P ETF (SPY): DOWN .72%, with volume 17% BELOW the average
Russell Small Cap ETF (IWM): DOWN 1.7%, with volume 19% BELOW the average
::: SelflInvestors Leading Stocks :::
The Self Investors Leading Stocks Index is comprised of stocks in the Breakout Tracker, which is a database of the fastest growing companies near a breakout or having already broken out of a base. There continues to be no leadership in this market and that was reflected today with Self Investors Leading Stocks down significantly more than the general market.
Summary:
* Decliners led Advancers 139 to 65
* Advancers were up an average of 1.44% today, with volume 2% ABOVE average
* Decliners were down an average of 1.88% with volume 20% BELOW the average
* The total SI Leading Stocks Index was DOWN .82% today with volume 13% BELOW average
::: Where’s the Money Flowing :::
Many investing websites provide leading industries based on price performance alone. However, without accompanying volume levels, this can sometimes be misleading. The only way that I know of to gauge industry/sector strength WITH volume levels is through the analysis of ETF’s. A couple years ago this was not possible, but as more traders/investors use ETF’s they become a much better tool for gauging the health of the market and seeing where the money is flowing (or not flowing). Using the proprietary SelfInvestors Demand Indicator score which measures price and volume movements, I’m able to quickly see which sectors/industries are seeing the greatest inflows of cash. For a detailed look at how I go about gauging sector/industry strength please see the following post: http://selfinvestors.com/si/industry_tracking/
* Current Leading Sectors/Industries (over last 30 trading days measuring price AND volume):
Intl Utilities, Global Timber, Staples
you might be thinking.. where is oil and commodities? those sectors have shown too much distribution over the past 30 days to be considered leaders under my criteria
* Current Lagging Sectors/Industries (over last 30 trading days measuring price AND volume):
Health Care Providers, Nuclear Energy, Networking, Aerospace/Defense
* Today’s Market Moving Industries/Sectors (UP):
Precious Metals, Oil, Commodities, Semis (liking the action in semis recently)
* Today’s Market Moving Industries/Sectors (DOWN):
Home Construction, Transports, Retail, Realty, Consumer Discretionary
::: Stocks :::
The stocks section will be an area where I highlight one stock selected from a group of stocks moving up with volume well above average and most likely breaking out of a base or consolidation. No time to highlight a stock of the day today, but you might want to take a look at this handful of leading stocks moving up with volume today (listed in order of Total Rank – fundamentals + technicals)
Atwood Oceanics (ATW) – double bottom breakout
Mechel (MTL) – bullish triangle breakout
Sand Ridge Energy (SD) – ascending triangle breakout
American Ecology (ECOL) – breakout of nearly 2 year base
Atlas Energy (ATN) – testing all time highs