Category Archives: Weekly/After Stock Market Review Archives

Every Sunday evening a full market review is sent to members of SelfInvestors.com which provides commentary on the technical and economic picture, a review of the SelfInvestors Model Portfolio, the best/worst performing industries and ETF’s for the week, IPOs to watch, upcoming economic reports as well as notable earnings reports. In addition, on days when the market makes a significant move I’ll highlight the technical action discussing price/volume movements and support/resistance levels, industries/sectors leading and lagging the market as well as a Stock of the Day. In the past these were sent in the middle of the trading day but I’ve since begun publishing them and sending them to members after the market closes. These reports will be archived here as well.

Google Catalyst for Big Break, But Big Resistance Remains

It’s no secret that the character of this market has been shifting over the past several weeks as the market adjusts to lowered expectations across the board.  However, when GE reported awful results last Friday it was a bit too much for the bull to swallow, leaving the indices in a bit of a precarious position.  .. BUT ah what a difference a week makes.  This time around Google proved all the doubters, doom and gloomers wrong.. very wrong and it provided just the spark this market needed to break out in a big way. 

Buyers remain in control with shorts running scared but how long can it last?  We’re already up 10% off the bottom and major resistance points stand in the way of another 10% mover up.  What happens when the Ag and Oil stocks begin to slip?  Can new leadership emerge?  Perhaps tech can find a grip once again following Google’s results.  I believe it’s a bit late too be getting aggressive on the long side unless you are trading in the short term.  I’ve been mentioning over the past several weeks that I’ve been adding some new long positions on the pull backs as the market appeared to be coiling for a big rally.  However, I’m not willing to get aggressive at these levels and may even look to lock in profits soon or hedge with a few short positions.

Let’s take a look at the technicals of the major indices.

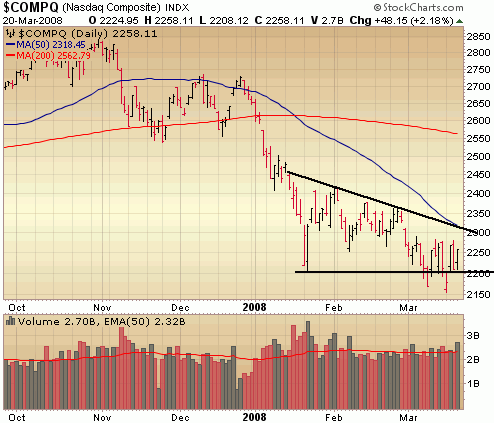
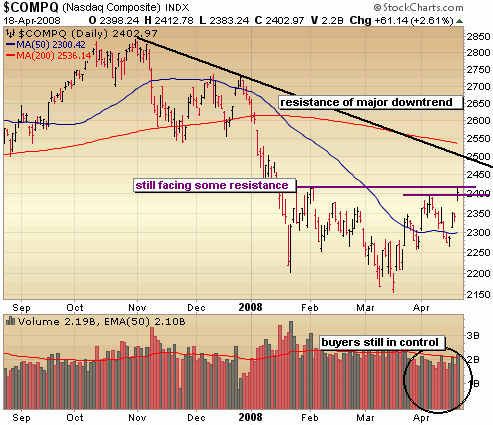
The Nasdaq on Friday gapped up big and was able to clear some resistance of the April highs but still faces stiff resistance at the Jan highs.  The buy vs. sell volume indicates that buyers remain firmly in control for now.  I like the odds of breaking those Jan highs but I don’t like the odds of breaking through the major downward trend.  It’s at that point I’d be significantly paring back on long positions and getting short.

42008_naz

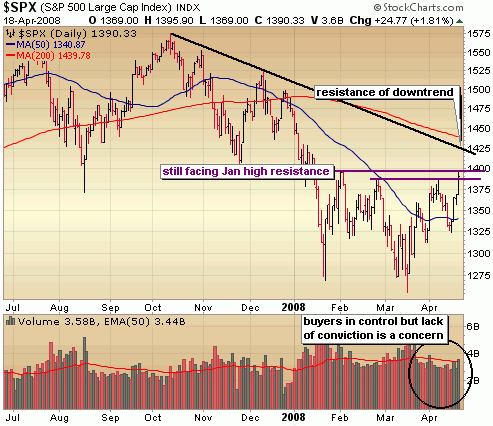
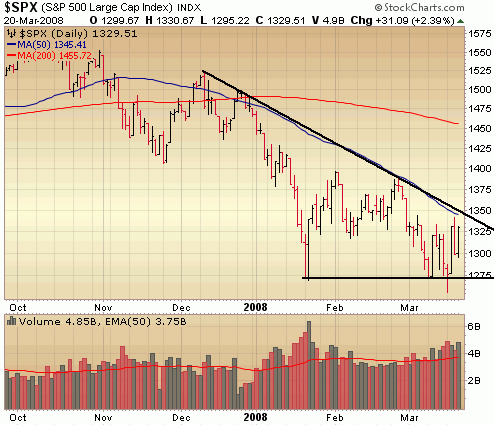
We see the same thing in the S&P.  A big move up on Friday but still faces some important resistance at the January highs and even bigger resistance at the major downtrend line which isn’t all that far away.  Certainly some more room to run, but if we get up into the 1425 level I’d be taking some chips off the table.  Note the relatively weak buy volume on these big moves.  Looks to be a considerable amount of short covering rather than big conviction on the part of institutions.

42008_sp500

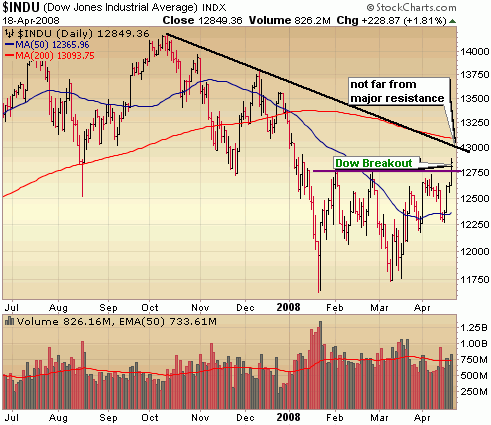
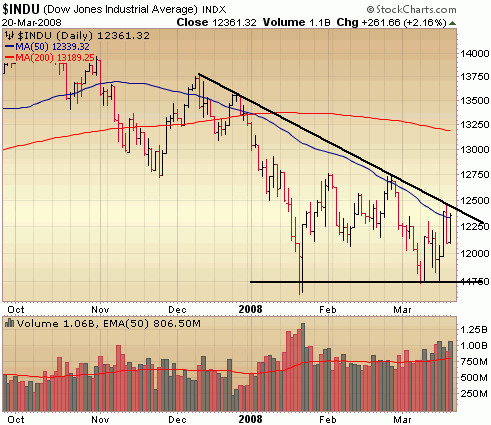
The Dow did manage to bust through those January highs, but look how close that downward trend line is.  Just 150 points away!  It’s possible that this rally ends as quick as it began.  Such is a bear market rally.

42008_dow

 ::: Model Portfolio :::

** This section will now appear as a separate report about every other Wednesday. 

The Self Investors Model Portolio wrapped up 2007 with a 30.2% gain.  Would you like to receive buy and sell alerts within minutes (NEW! now get them via instant messaging in near real time) of each transaction in the portfolio?  You can receive these along with ALL of the tracking tools and reports with the very popular Gold membership.  Don’t delay, get started today and join me for many more highly profitable months here at SelfInvestors.com.

::: Best/Worst Performers :::

– Top 10 Performing Industries For the Week –

1. Publishing – Periodicals: 29.35%
2. Dairy Products: 12.35%
3. Oil & Gas Equipment & Services: 10.95%
4. Internet Info Providers: 10.80%
5. Nonmetallic Mineral & Mining: 10.55%
6. Shipping: 9.85%
7. Investment Brokerage:  9.80%
8. Farm Products: 9.75%
9. Technical & System Software: 9.30%
10. Farm & Construction Machinery: 8.90%

– Top 10 Worst Performing Industries For the Week –

1. Major Airlines: -6.50%
2. Resorts & Casinos: -5.05%
3. Diagnostic Substances: -3.45%
4. Research Services: -2.70%
5. Long Distance Carriers: -2.40%
6. Personal Products: -2.25%
7. Banks – NE: -2.25%
8. Medical Appliances & Equipment: -1.85%
9. Medical Equipment Wholesale: -1.80%
10. Regional Airlines: -1.35%

– Top 5 Best Performing ETFs For the Week –

1. HLDRS Oil Services (OIH)  12.55%
2. India Fund (IFN) 10.90%
3. iShares US Oil Equipment & Services (IEZ) 10.25%
4. Morgan Stanley India Invest Fund (IIF) 10.00%
5. Powershares Dynamic Oil & Gas Equipment & Services (PXJ) 9.95%

– Worst 5 Performing ETF’s –

1. HLDRS Biotech (BBH) -1.50%
2. SPDR Gold (GLD)) -.75%
3. iShares Gold Trust (IAU) -.70%
4. HLDRS Pharma (PPH)  -.50%
5. Central Fund of Canada (CEF) -.40%

:::  IPO’s Worth Watching for This Week :::

This section will now appear as a separate post on Mondays.

While 2008 should be a much slower year for IPO’s considering the deterioration of the market, there will continue to be some good companies coming to market here and there.  I’ll be highlighting the best IPO’s every Monday.

::: Upcoming Economic Reports (4/21/2008- 4/25/2008) :::

Monday:        None
Tuesday:       Existing Home Sales
Wednesday:  Crude Inventories
Thursday:      New Home Sales, Initial Claims, Durable Orders
Friday:           Mich Sentiment (prelim)

::: Earnings I’m Watching This Week :::

Monday:
Ametek (AME), Arch Coal (ACI), Bank of America (BAC), Canadian National Railway (CNI), Fording Canadian Coal Trust (FDG), Halliburton (HAL), Netflix (NFLX), Steel Dynamics (STLD)

Tuesday:
AK Steel Holding (AKS), AmSurg (AMSG), Anixter Intl (AXE), AU Optronics (AUO), Baker Hughes (BHI), CH Robinson (CHRW), Chicago Mercantile (CME), Coach (COH), Encana (ECA), Hudson City Bancorp (HCBK), Jacobs Engineering (JEC), McDonald’s (MCD), Norfolk Southern (NSC), Options Express (OXPS), Peabody Energy (BTU), Smith Intl (SII), VMware (VMW), Yahoo (YHOO)

Wednesday:
Air Products & Chemicals (APD), Alcon (ACL), Allegheny Technologies (ATI), Aluminum Corp of China (ACH), Amazon (AMZN), Apple (AAPL), CDC Corp (CHINA), Chipotle (CMG),  EMC Corp (EMC), Range Resources (RRC), Ryland Group (RYL), Stericycle (SRCL), XTO Energy (XTO)


Thursday:
3M (MMM), Altria (MO), Baidu (BIDU), Bucyrus (BUCY), Bunge (BG), Century Aluminum (CENX), CNH Global (CNH), Deckers Outdoor (DECK), Diamond Offshore (DO), HDFC Bank (HDB), Interactive Brokers (IBKR), Life Time Fitness (LTM), MDC Holdings (MDC), MEMC Electronics (WFR), Microsoft (MSFT), Potash (POT), Rubicon (RBCN), Southwestern Energy (SWN), T Rowe Price (TROW), Terra Industries (TRA), Trade Station (TRAD), Union Pacific (UNP), VisionChina Media (VISN),

Friday:
Companhia Vale do Rio Doce (RIO)

::: In Case You Missed It – SelfInvestors Blog Entries of the Past Week :::

1. Gold Heading Lower, Natural Gas & Uranium Headed Higher? Transports Showing Leadership

2. Coiling For Big Rally? Leaders With Momentum – ATW, MTL, SD, ECOL

3. Top Breakout Stocks With Greatest Demand: Watch Digital Ally (DGLY)

4. Indices Reclaim 50 Day Moving Average Keeping Breakout Potential Intact

5. Breakouts! Gushan Environmental Energy (GU) & Digital Ally (DGLY)
Indices Reclaim 50 Day Moving Average Keeping Breakout Potential Intact

Just last Friday, the market wasn’t able to continue the trend of shrugging off the bad news as the big GE earnings miss had the bears growling and indices plummeting below their 50 day moving averages.  The move was enough to cast doubt on a big spring rally, but the bulls would not be denied today

It isn’t about the numbers.  It’s about expectations… and Intel, Wells Fargo and JPMorgan all beat much lowered expectations and were catalysts in kicking off the morning in the green.  Not even a gloomy outlook from the Fed or record oil prices (yet again) could keep this market down as the indices once again threw caution to the wind and and closed strong near the highs of the day.

Today’s move neutralizes the bearish move of last Friday and puts the indices back in contention for a spring rally as the Nasdaq, Dow and S&P500 all reclaimed support of the 50 day moving average with a tick up in volume.  Volume certainly could have been better with such a big price gain but if we can follow through tomorrow or Friday with better volume, we just might be able to bust through those resistance levels.

Let’s have a look at the indices.

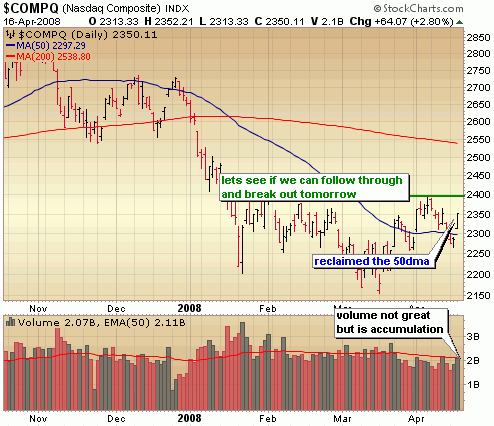
The Nasdaq gapped up above resistance of the 50 day moving average which should prove to be an important support level in the coming weeks.  Notice that volume just came in at around average but was significantly higher than yesterday so technically a day of accumulation and certainly a considerably bullish move.  Nasdaq 2400 is the next target and a significant source of resistance.  A breakout from there would be very bullish.  Perhaps strong results out of IBM and Ebay can be the catalyst for tomorrow.

41608_naz

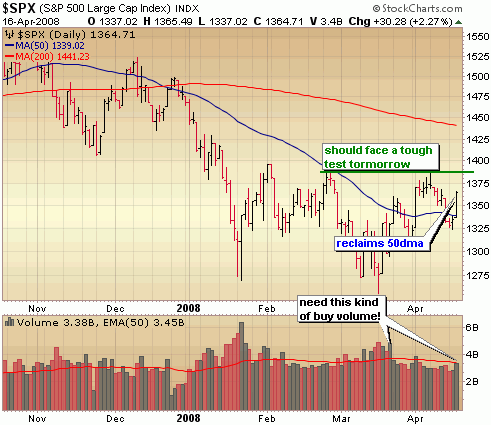
The S&P also surged back above the 50 day moving average with average volume.  We could face big resistance around 1385 tomorrow.

41608_sp500

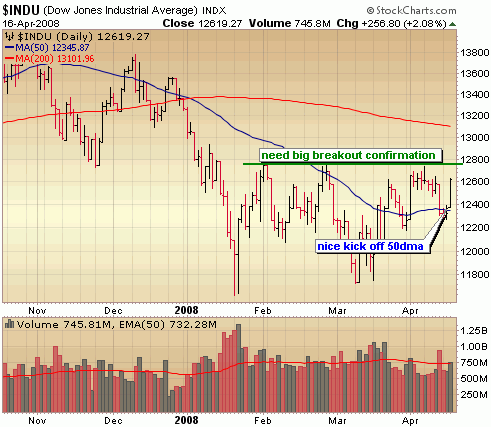
The Dow looks poised to test important resistance levels tomorrow.  We need to breakout from the channel above  the area around 12800.

41608_dow

::: Major Indices Performance – The Numbers :::

(Note: volume averages are based on the average over the past 50 days)
Data as of 4:00EST – End of Day April 16th 2008
Nasdaq: UP 2.8% today with volume at the average
Nasdaq ETF (QQQQ) 4.28%, volume 12% BELOW average
Dow: UP 2.08%, with volume 2% ABOVE the average
Dow ETF (DIA): UP 2.56%, with volume 10% ABOVE the average
S&P ETF (SPY): UP 2.71%,  with volume 18% BELOW the average
Russell Small Cap ETF (IWM): UP 3.17%, with volume 15% BELOW the average

::: SelflInvestors Leading Stocks :::

The Self Investors Leading Stocks Index is comprised of stocks in the Breakout Tracker, which is a database of the fastest growing companies near a breakout or having already broken out of a base.  Leading stocks did quite well today, outperforming all of the major indices with decent volume behind the move.

Summary:
* Advancers led Decliners 187 to 19
* Advancers were up an average of 3.68% today, with volume 10% ABOVE average
* Decliners were down an average of 1.55% with volume 72% ABOVE the average
* The total SI Leading Stocks Index was UP 3.2% today with volume 16% ABOVE average

::: Where’s the Money Flowing :::

Many investing web sites provide leading industries based on price performance alone. However, without accompanying volume levels, this can sometimes be misleading.  The only way that I know of to gauge industry/sector strength WITH volume levels is through the analysis of ETF’s.  A couple years ago this was not possible, but as more traders/investors use ETF’s they become a much better tool for gauging the health of the market and seeing where the money is flowing (or not flowing).  Using the proprietary Self Investors Demand Indicator score which measures price and volume movements, I’m able to quickly see which sectors/industries are seeing the greatest inflows of cash.  For a detailed look at how I go about gauging sector/industry strength please see the following post: http://selfinvestors.com/si/industry_tracking/

* Current Leading Sectors/Industries (over last 30 trading days):  
Homebuilders, REITs, Intl Utilities, Biotech, Clean Energy

* Current Lagging Sectors/Industries (over last 30 trading days):  
Health Care, Telecom

* Today’s Market Moving Industries/Sectors (UP):
Semis, Technology, Financials, Agriculture, Nuclear Energy, Materials

* Today’s Market Moving Industries/Sectors (DOWN): 
None

::: Stocks :::

The stocks section will be an area where I highlight one stock selected from a group of stocks moving up with volume well above average and most likely breaking out of a base or consolidation.  I don’t have time  tonight for a detailed stock of the day, so once again I provide a sample list of leading stocks moving up with big volume today (full list available in the Breakout Tracker.  There are some real gems here! (listed in order of Total Rank)

Baidu.com (BIDU) breakout!
AgFeed Industries (FEED)
Mechel Steel (MTL)
Heico (HEI)
ReneSola (SOL)
Cellcom (CEL)
Chart Industries (GTLS)
Rio Tinto (RTP) breakout!
T-3 Energy Services (TTES)
Balchem (BCPC) breakout!

Full Disclosure/Disclaimer: The stock of the day is by no means a buy recommendation.  Please do your own research and make a personal decision based on your own tolerance for risk.  I currently do own a position in Baidu (BIDU), Balchem (BCPC) and Mechel (MTL)

Coiling For Big Rally? Leaders With Momentum – ATW, MTL, SD, ECOL

As the market quietly digests the big gain of last Tuesday, the big story continues to be oil which hit an all time intraday high today of 112.21/barrel and held on to much of the gains to mark an all time closing high of 110.93.  The market was certainly weighed down with oil breaking out again, but overall not a bad day today.  Sell volume came in below average just as it has for the past few weeks and I think we’re still in good shape for the possibility of another big rally attempt… BUT, time is running out.  The longer we meander and don’t follow through from last Tuesday, the greater the chances of taking out new support levels which sets us up for another test of the lows of this correction.  I think the odds are greater for another leg higher and am trading accordingly.  Bad news of late has little impact on this market and when it does, there is little conviction of sellers. 

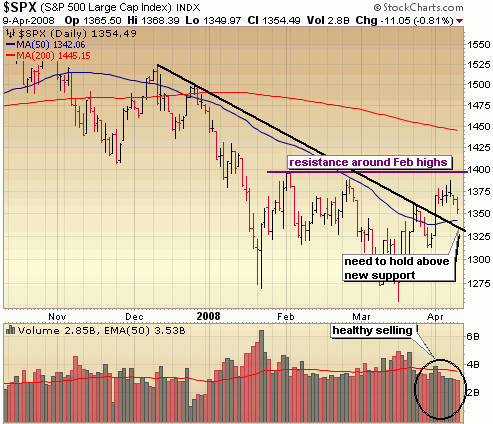
Taking a look at the S&P you see we took out the lows of the past few trading days setting up a show down with the 50 day moving average in the coming days and possibly a test of new support of the downward trend line which was broken with the big surge last Tuesday.  So, a bit more room to go on the downside before a failure of this rally is a concern. 

4908_spy

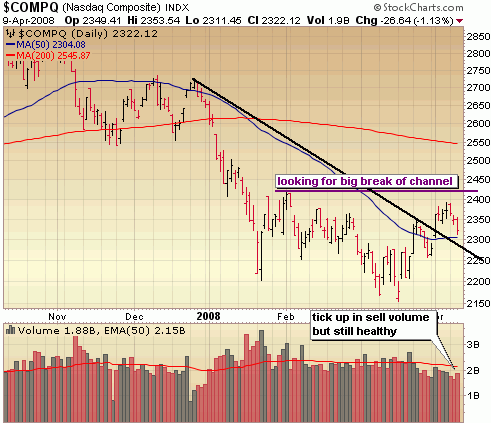
Sell volume ticked up a bit in the Nasdaq, but still came in well below average.  As far as I’m concerned a healthy day of consolidation, but a test of the 50 day moving average around 2300 is almost a given with the possibility of dropping a bit further to test new support of the downward trend and the gap of last Tuesday around 2275. 

4908_naz

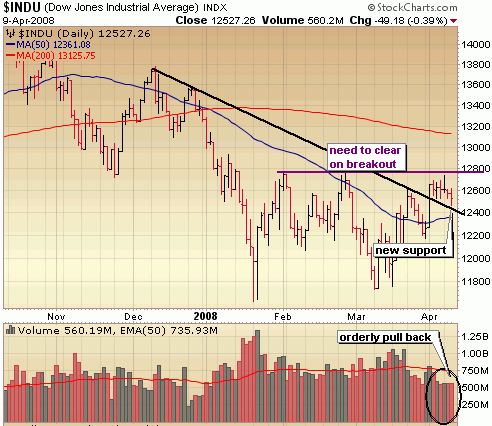
The Dow actually came very close to testing new support of the downward trend line but that was averted with a fairly impressive last hour rally today.  The critical area for the Dow is around 12400.  We need to hold above there to keep this rally intact.

4908_dow

::: Major Indices Performance – The Numbers :::

(Note: volume averages are based on the average over the past 50 days)
Data as of 4:00EST – End of Day April 9th, 2008
Nasdaq: DOWN 1.13% today with volume 1% BELOW average
Nasdaq ETF (QQQQ) DOWN 1.12%, volume 20% BELOW average
Dow: DOWN .39%, with volume 24% BELOW the average
Dow ETF (DIA): DOWN .38%, with volume 5% BELOW the average
S&P ETF (SPY): DOWN .72%,  with volume 17% BELOW the average
Russell Small Cap ETF (IWM): DOWN 1.7%, with volume 19% BELOW the average

::: SelflInvestors Leading Stocks :::

The Self Investors Leading Stocks Index is comprised of stocks in the Breakout Tracker, which is a database of the fastest growing companies near a breakout or having already broken out of a base.  There continues to be no leadership in this market and that was reflected today with Self Investors Leading Stocks down significantly more than the general market.

Summary:
* Decliners led Advancers 139 to 65
* Advancers were up an average of 1.44% today, with volume 2% ABOVE average
* Decliners were down an average of 1.88% with volume 20% BELOW the average
* The total SI Leading Stocks Index was DOWN .82% today with volume 13% BELOW average

::: Where’s the Money Flowing :::
Many investing websites provide leading industries based on price performance alone. However, without accompanying volume levels, this can sometimes be misleading.  The only way that I know of to gauge industry/sector strength WITH volume levels is through the analysis of ETF’s.  A couple years ago this was not possible, but as more traders/investors use ETF’s they become a much better tool for gauging the health of the market and seeing where the money is flowing (or not flowing).  Using the proprietary SelfInvestors Demand Indicator score which measures price and volume movements, I’m able to quickly see which sectors/industries are seeing the greatest inflows of cash.  For a detailed look at how I go about gauging sector/industry strength please see the following post: http://selfinvestors.com/si/industry_tracking/

* Current Leading Sectors/Industries (over last 30 trading days measuring price AND volume):  
Intl Utilities, Global Timber, Staples

you might be thinking.. where is oil and commodities? those sectors have shown too much distribution over the past 30 days to be considered leaders under my criteria

* Current Lagging Sectors/Industries (over last 30 trading days measuring price AND volume): 
Health Care Providers, Nuclear Energy, Networking, Aerospace/Defense

* Today’s Market Moving Industries/Sectors (UP):
Precious Metals, Oil, Commodities, Semis (liking the action in semis recently)

* Today’s Market Moving Industries/Sectors (DOWN):
Home Construction, Transports, Retail, Realty, Consumer Discretionary

::: Stocks :::

The stocks section will be an area where I highlight one stock selected from a group of stocks moving up with volume well above average and most likely breaking out of a base or consolidation.  No time to highlight a stock of the day today, but you might want to take a look at this handful of leading stocks moving up with volume today (listed in order of Total Rank – fundamentals + technicals)

Atwood Oceanics (ATW) – double bottom breakout
Mechel (MTL) – bullish triangle breakout
Sand Ridge Energy (SD) – ascending triangle breakout
American Ecology (ECOL) – breakout of nearly 2 year base
Atlas Energy (ATN) – testing all time highs

Market Breaks Out But Volume Suspect; Stock of Day – AsiaInfo (ASIA)

The morning began with big write downs out of UBS and Deutche and LEH needed to raise 4 billion to shore up its balance sheet. Once analyst called the UBS write down a "kitchen sink job", saying "It’s a kitchen sink job. They’ve separated all their toxic waste. If they’re going to finance that then everyone is saying this is the beginning of the end; this is the last capital increase." 

Several weeks ago we’d probably be down a few hundred, but this is a different market than the pre Bear Stearns market.  On that day of the BS debacle, the character of this market changed from one that focused on the bad news to one that rallied on any positives.  The market always prices in future events and when the bad news flows day after day, week after week, eventually you hit a tipping point where it’s clear that much of it has been priced in.  That’s why in the case of an individual stock, it rallies before a company begins reporting big earnings and sales growth numbers and falters well before the fundamentals crack.  I’ve said it many times before here and I’ll say it again:  stock charts are the best leading indicators.

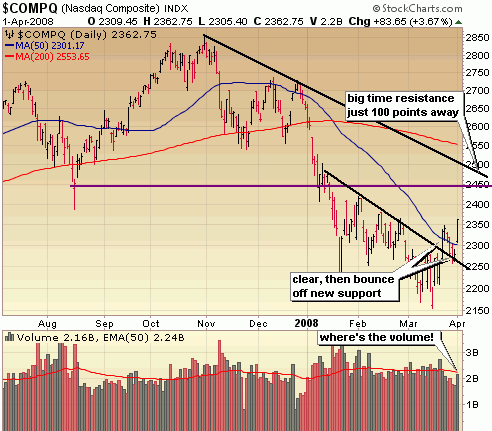
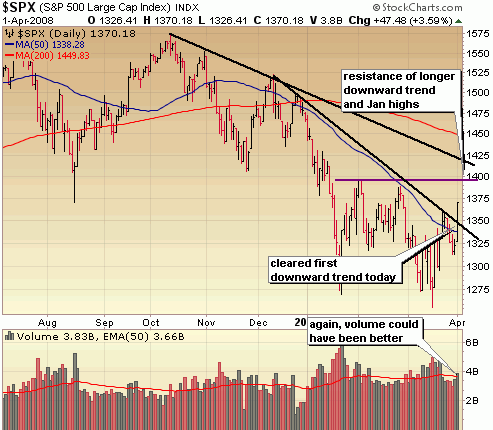
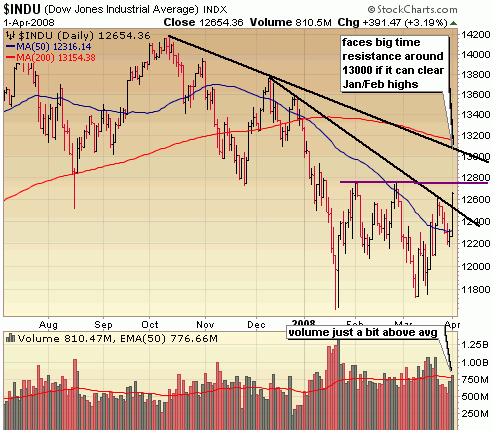
We’ve been in this mode for a couple of weeks now and I think today was another good reminder of that, but was today as bullistic (I know it’s not a word but I like it and I’m using it) as it appeared to be?  Yes and no.  Yes on price, no on volume and leading stock moves.  Technically, today could be considered an accumulation day because volume levels came in higher than the day before, but with the market up 3.5% I want to see HUGE volume indicating that institutions are buying hand over fist.  This looked more like mad scrambling short covering to me.  In addition, there were very few leading stock breakouts on my radar today.  In fact there were very few leading stocks moving with volume period!  There is some room to run given the magnitude of today’s move, but I would absolutely not be chasing stocks on the long side.  If you didn’t add long positions on the pull backs in recent days it’s probably best to remain patient for another pull back.  You will get your chance.  This is still  a bear market and as you’ll see in the charts below, we’re still well within a major bearish downtrend.

The Nasdaq has a bit more breathing room to run before hitting major resistance, than do the Dow or S&P.  Notice that volume actually came in a touch below average.  That is very surprising considering today’s price move.  The big fellas were not doing any major buying today.

4108_naz

Volume came in a bit better in the financials dominated S&P, but not exactly impressive.  Today’s move clears the way for a move to the next level of resistance around 1400 – 1415 which is right around the area of the bear downtrend.  It isn’t far away so I wouldn’t be getting aggressive on the long side here.

4108_sp

Lots of major resistance ahead for the Dow as well.  If it can clear the Jan/Feb highs, it won’t be long before it runs smack into major resistance of the downward trend around 13,000.

4108_dow1 


::: Major Indices Performance – The Numbers :::

(Note: volume averages are based on the average over the past 50 days)
Data as of 4:00EST – End of Day April 1st 2008
Nasdaq: UP 3.67% today with volume 1% BELOW average
Nasdaq ETF (QQQQ) 4.28%, volume 23% BELOW average
Dow: UP 3.19%, with volume 5% ABOVE the average
Dow ETF (DIA): UP 3%, with volume 18% ABOVE the average
S&P ETF (SPY): UP 3.52%,  with volume 4% BELOW the average
Russell Small Cap ETF (IWM): UP 3.66%, with volume 33% BELOW the average

::: SelflInvestors Leading Stocks :::

The Self Investors Leading Stocks Index is comprised of stocks in the Breakout Tracker, which is a database of the fastest growing companies near a breakout or having already broken out of a base.  Leading stocks significantly underperformed the major indices today as beaten down stocks saw much of the gains today.

Summary:
* Advancers led Decliners 160 to 31
* Advancers were up an average of 3.57% today, with volume 6% ABOVE average
* Decliners were down an average of 1.88% with volume 44% ABOVE the average
* The total SI Leading Stocks Index was UP 2.68% today with volume 12% ABOVE average

::: Where’s the Money Flowing :::

Many investing websites provide leading industries based on price performance alone. However, without accompanying volume levels, this can sometimes be misleading.  The only way that I know of to gauge industry/sector strength WITH volume levels is through the analysis of ETF’s.  A couple years ago this was not possible, but as more traders/investors use ETF’s they become a much better tool for gauging the health of the market and seeing where the money is flowing (or not flowing).  Using the proprietary SelfInvestors Demand Indicator score which measures price and volume movements, I’m able to quickly see which sectors/industries are seeing the greatest inflows of cash.  For a detailed look at how I go about gauging sector/industry strength please see the following post: http://selfinvestors.com/si/industry_tracking/

* Current Leading Sectors/Industries (over last 30 trading days):  
Internet Infrastructure, Homebuilders, Intl Utilities, REIT, Biotech, Transports

* Current Lagging Sectors/Industries (over last 30 trading days):  
Health Care Providers, Coal, Clean Energy, Utilities

* Today’s Market Moving Industries/Sectors (UP):
Financials, Real Estate, Broker Dealers, Homebuilders, Semis

* Today’s Market Moving Industries/Sectors (DOWN): 
Gold

::: Stocks :::

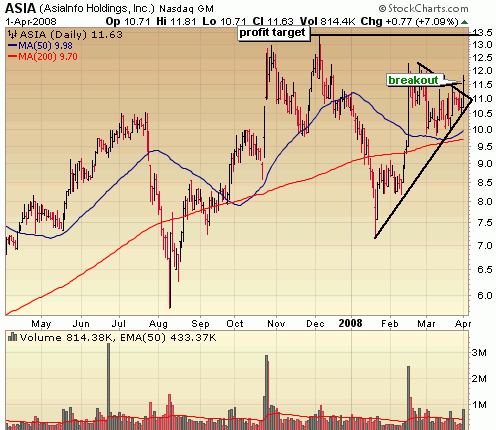
The stocks section will be an area where I highlight one stock selected from a group of stocks moving up with volume well above average and most likely breaking out of a base or consolidation.  It’s been many weeks since I featured a Stock of the Day.  The last was BCPC several weeks ago and before that PRXL.  The market just hasn’t yielded many high quality breakouts over the past few months.  Even with today’s big market move, there were just two leading stock breakouts in my database today – AsiaInfo Holdings (ASIA) & Intuitive Surgical (ISRG).  I like to highlight stocks that are relatively off the radar in this section so tonight I take a look at ASIA.

ABOUT:

Asiainfo Holdings, Inc. (AsiaInfo) provides telecommunications software solutions and information technology (IT) security products and services in China. The Company’s operations are organized into two divisions: AsiaInfo Technologies and Lenovo-AsiaInfo. AsiaInfo Technologies encompasses the Company’s traditional telecommunications business and provides software and solutions to China’s telecommunications carriers, while Lenovo-AsiaInfo provides IT security products and services. During the year ended December 31, 2007, approximately 86% of the CompanyGÇÖs total revenue was contributed by AsiaInfo Technologies, while the remaining revenue was contributed by Lenovo-AsiaInfo. On October 15, 2007, the Company acquired telecommunications Business Support Systems business (BSS), of Shenzhen Modern Computer Manufacturer Co., Ltd.

FUNDAMENTALS: 
ASIA is a company with a fairly erratic history which resulted in a loss in 2005.  Since that time, the company has bounced back with excellent growth in the last 2 years.  Earnings jumped from a loss of .02/share in 05 to a gain of .16/share in 2006 and a near tripling of profits in 2007 with .45/share.  Growth is expected to moderate a bit in 08 and 09 but remain very strong at 20 – 30%.  While ROE isn’t outstanding at about 11%, it has been rising in the past couple years and continues to do so.  Net margins are quite good at about 15%.  Management ownership looks good at 25% and many institutions are adding initial positions

TECHNICAL:

ASIA has really rocketed off the January lows and carved out the right side of a steep, V like cup with handle base.  I don’t particularly like sharp bases like this but given the healthy volume levels throughout the base and a healthy breakout from a 6 week consolidation today, I think this stock is good for a trade and poised to test the December highs above 13.  This is an area I’m looking to take profits.  Usually, I’d hold leading breakout stocks longer, but we’re still in a bear market and this isn’t the best looking base around.

4108_asia

SELFINVESTORS RATING: With a total score of 49/60 (25/30 for fundamentals, 24/30 for technical), AsiaInfo (ASIA) is a good SelfInvestors leading stock and should be near the top of any watch list.

Full Disclosure/Disclaimer: The stock of the day is by no means a buy recommendation.  Please do your own research and make a personal decision based on your own tolerance for risk.  I currently do own a position in AsiaInfo Holdings (ASIA)

Despite Market March Madness, Indices Remain In Trading Range

It’s Easter, the best tournament of any sport at any level is on and I’m not in the mood to dissect the market today.  I’ll keep it short with charts.  Happy Easter all.

 Despite all the news and the wild swings we’re still in a trading range and waiting for an explosive move in either direction.  I’m leaning toward an explosive move to the upside very soon and it won’t be led by commodities!


::: Model Portfolio :::

** This section will now appear as a separate report to be published every other Wednesday

Following a 27.6% return in 2006 and a 30.2% return in 2007, the Self Investors Model Portfolio maintains an annualized return of 24.5% since inception in 2004.  Would you like to receive buy and sell alerts within minutes (NEW! now get them via instant messaging in near real time) of each transaction in the portfolio?  You can receive these along with ALL of the tracking tools and reports with the very popular Gold membership.  Don’t delay, get started today and join me for many more highly profitable months here at SelfInvestors.com.

::: Best/Worst Performers :::

– Top 10 Performing Industries For the Week –

1. Mortgage Investment: 36.75%
2. Residential Construction: 8.25
%
3. Surety & Title Insurance: 8.20%
4. Home Furnishing Stores: 7.90%
5. Auto Dealerships: 7.30%
6. Catalog & Mail Order Houses: 7.25%
7. REIT – Healthcare Facilities:  7.25%
8. Sporting Goods Stores: 7.15%
9. Department Stores: 6.80%
10. Home Improvement Stores: 6.45%

– Top 10 Worst Performing Industries For the Week –

1. Gold: -16.00%
2. Silver: -13.50%
3. Copper: -11.85%
4. Industrial Metals & Minerals: -11.80
6. Independent Oil & Gas: -10.35%
7. Aluminum: -10.30%
8. Agricultural Chemicals: -10.10%
9. Oil & Gas Drilling & Exploration: -8.65%
10. Nonmetallic Mineral & Mining: -8.60%

– Top 5 Best Performing ETFs For the Week –
 
1. SPDR Homebuilders (XHB) 9.10%
2. HLDRS Regional Banks (URE) 8.55%
3. iShares Home Construction (ITB)  8.10%
4. Powershares Dynamic Banking (PJB) 7.40%
5. iShares Realty (ICF) 7.30%

– Worst 5 Performing ETF’s –

1. iShares Silver (SLV) -18.15%
2. 
Powershares Agriculture (DBA) -15.20%
3. Market Vectors Gold Miners (GDX) -14.75%
4. Central Fund of Canada (EWM)
 -14.35%
5. Asa Gold (ASA) -13.95%

:::  IPO’s Worth Watching for This Week :::

This section will now appear as a separate post on Mondays (if there are some interesting IPO’s coming to market).

While 2008 should be a much slower year for IPO’s considering the deterioration of the market, there will continue to be some good companies coming to market here and there.  I’ll be highlighting the best IPO’s every Monday.

::: Upcoming Economic Reports (3/24/08 – 3/28/08) :::

Monday:         Existing Home Sales
Tuesday:       Consumer Confidence
Wednesday:  Crude Inventories, Durable Orders, New Home Sales
Thursday:      GDP – Final, Initial Claims
Friday:            Personal Income/Spending, Core PCE Inflation

::: Earnings I’m Watching This Week :::

Tuesday:
Neogen (NEOG)

Wednesday:
China Sunergy (CSUN), Oracle (ORCL)

Thursday:
Accenture (ACN), Apollo Group (APOL), Lennar (LEN)

Friday:
KB Homes (KBH)

The Fear Begins Now: St Paddy’s Day Looking Red

In the last weekend market report I talked about the importance of and relation of greed and fear.  It’s a part of trading, it’s a part of market cycles.  The greed of nearly free money has long come and go.  It’s time for fear to play it’s hand and that begins now.

From last week’s Where Are We in the Greed and Fear Cycle:

"With greed comes pain, with pain comes blame and the blame game ends in fear.  Only then can we start discussing a true bottom to a market and I don’t think we’re there yet.  As the characters of this housing horror show defended their practices in front of congress last week (where was Greenspan?) it’s quite clear the blame game is in full motion.  The public always pays first and now it’s time for the government to make an example out of a few ill intentioned CEO’s.  It’s all playing out according to the script and I don’t think we’ve seen the end of  this mess until a few of the larger financial/home builder companies go under and a few recognized executives are indicted. "

The last cycle of greed and fear produced such casualties as Enron and Worldcom.  Less than a decade later, Bear Stearns (BSC) takes its place in line.  Some good comments on what brought down Bear Stearns (BSC)

Can you sense the desperation?  With each passing day it seems the Fed is attempting to stave off a firestorm of financial collapse with water balloons, albeit BIG water balloons.  .. but eventually someone will get burned.  Uh I mean more will get burned.  The Fed seems to be running out of water balloon ammo. 

Do you believe the flat CPI number of last week?  Well do ya?   It’s probably just a setup for another big Fed rate cut on Tuesday, more dollar demise, gold rally, oil rally… more of the same.  Let’s see what PPI brings Tuesday ahead of the Fed decision.  At this point though, interest rates aren’t gonna cut it but oh what a rally we’re gonna have once we get that fear/panic driven shakeout over with.

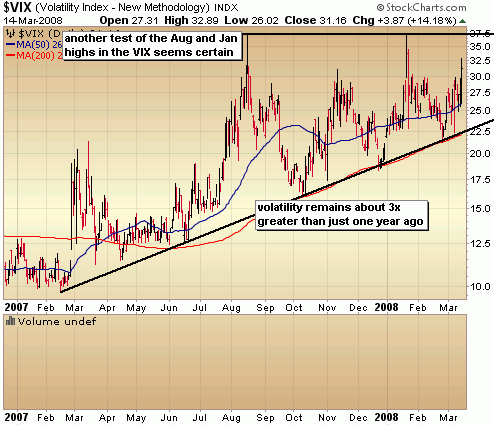
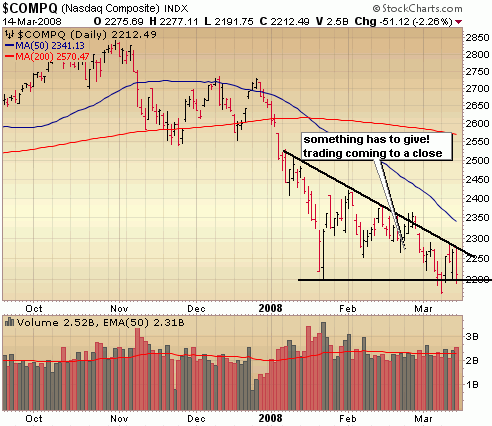
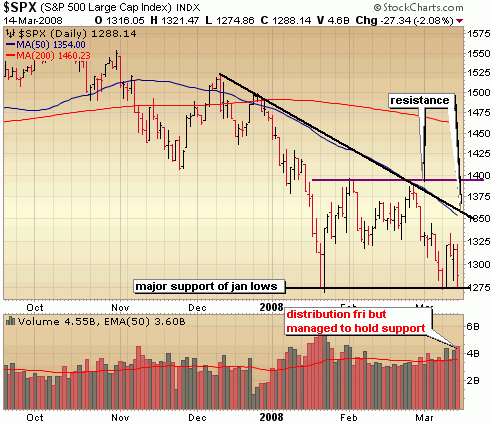
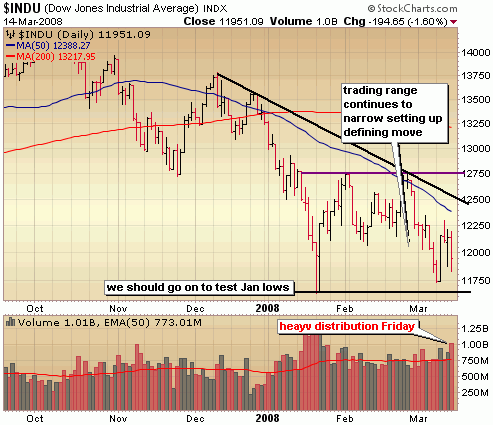
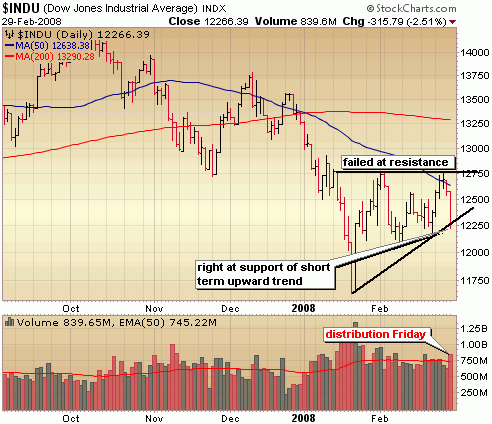
There is so much intervention and news driven skiddishness out there right now that it’s difficult to place much importance on the charts from day to day, but taking a step back reveals a narrowing trading range on all indices.  I won’t go into detail for each chart tonight.  What we’re looking at are indices that are holding support of those January lows but prone to failure given Friday’s distribution day and the spiking VIX.  Whatevever happens in the early part of next week, it’s going to be one wild ride.  Yes, you should still be out of  this market for the most part!


::: Model Portfolio :::

** This section will now appear as a separate report to be published every other Wednesday

The Self Investors Model Portolio wrapped up 2007 with a 30.2% gain.  Would you like to receive buy and sell alerts within minutes (NEW! now get them via instant messaging in near real time) of each transaction in the portfolio?  You can receive these along with ALL of the tracking tools and reports with the very popular Gold membership.  Don’t delay, get started today and join me for many more highly profitable months here at SelfInvestors.com.

::: Best/Worst Performers :::

– Top 10 Performing Industries For the Week –

1. Manufactured Housing: 7.41%
2. REIT – Healthcare: 5.90
%
3. Education & Training Services: 5.00%
4. Catalog & Mail Order Houses: 4.79%
5. Banks – Pacific: 4.45%
6. Long Distance Carriers: 4.40%
7. Silver:  4.25%
8. Banks – SW: 4.20%
9. REIT – Residential: 4.15%
10. Gold: 4.10%

– Top 10 Worst Performing Industries For the Week –

1. Toy & Hobby Stores: -26.15%
2. Health Care Plans: -17.35%
3. Major Airlines: -15.50%
4. Sporting Activities: -7.05
6. Investment Brokerage: -6.80%
7. Diagnostic Substances: -6.55%
8. Drugs Wholesale: -5.65%
9. Technical Services: -5.65%
10. Surety & Title Insurance: -5.55%

– Top 5 Best Performing ETFs For the Week –
 
1. Central Fund of Canada (CEF) 6.45%
2. Powershares Dynamic Banking (PJB) 6.35%
3. KBW Banking (KRE)  5.80%
4. Market Vectors Gold Miners (GDX) 5.55%
5. SPDR Homebuilders (XHB) 5.50%

– Worst 5 Performing ETF’s –

1. Indonesia Fund (IF) -11.50%
2. Morgan Stanley China (CAF) -11.35%
3. 
iShares US Health Care (IHF) -10.25%
4. iShares South Korea (EWY) -7.45%
5. iShares Malaysia (EWM)
 -7.00%

:::  IPO’s Worth Watching for This Week :::

The IPO market remains absolutely dead, but the big one happens this week.  The Visa (V) IPO begins trading on Wednesday.  I’ll have preview tomorrow night or Tuesday highlighting what others are saying about it and some of my own thoughts on strategy.

This section will now appear as a separate post on Mondays (if there are some interesting IPO’s coming to market).

While 2008 should be a much slower year for IPO’s considering the deterioration of the market, there will continue to be some good companies coming to market here and there.  I’ll be highlighting the best IPO’s every Monday.

::: Upcoming Economic Reports (3/17/08 – 3/21/08) :::

Monday:         Capacity Utilization, Industrial Production
Tuesday:       Fed Rate Decision, PPI, Building Permits, Housing Starts
Wednesday:  Crude Inventories
Thursday:      Initial Claims, Leading Indicators
Friday:            None

::: Earnings I’m Watching This Week :::

Monday:
Bear Stearns (BSC)

Wednesday:
China Mobile (CHL)

Where Are We in the Greed and Fear Cycle?

In a sea of short term market volatility, it’s often difficult to see the big picture but we all need to remember that in the midst of manipulation, rumor, Fed speak and chat room BS there is just one constant that will never change.  Human emotion. .. specifically fear and greed.  We are reminded of this yet again as we cope with yet another boom bust cycle where lessons of the past are ignored and with near certainty a fresh round of CEO’s will be spending days at the crossbar hotel.

With greed comes pain, with pain comes blame and the blame game ends in fear.  Only then can we start discussing a true bottom to a market and I don’t think we’re there yet.  As the characters of this housing horror show defended their practices in front of congress last week (where was Greenspan?) it’s quite clear the blame game is in full motion.  The public always pays first and now it’s time for the government to make an example out of a few ill intentioned CEO’s.  It’s all playing out according to the script and I don’t think we’ve seen the end of  this mess until a few of the larger financial/home builder companies go under and a few recognized executives are indicted. 

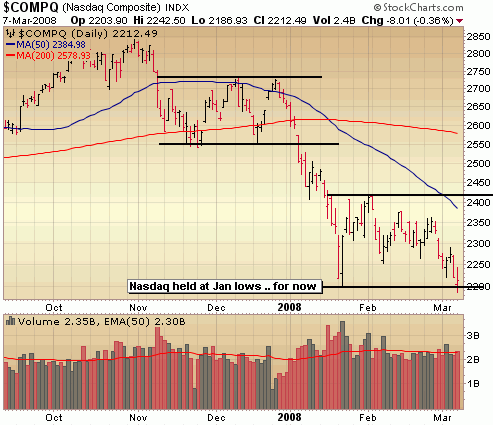
The technicals reveal that the market is currently at a critical point as they approach the January lows.  The Nasdaq actually tested this level on Friday but managed to close above this critical support level with a bit of a late day recovery.  All in all, not a bad day considering that poor jobs number but it was a day of distribution, so the Nasdaq is still very much in danger of taking out those January lows and closing below which would set it up for another leg down.


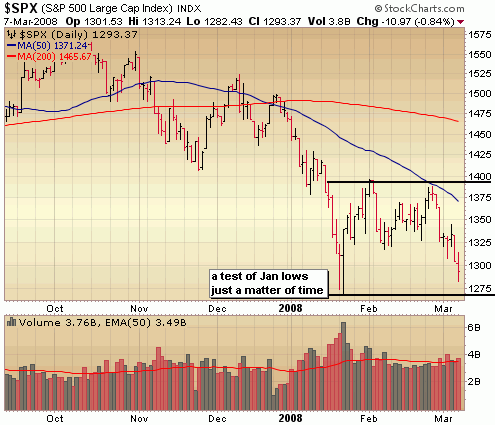
The S&P didn’t come all that close to the Jan lows on Friday but it appears to be just a matter of time before that level is tested.  It would be good to take out this level with some volume, followed a big round of institutional buying to help further flush out the weak hands and set this market up for a bull run.  However, as I mentioned above I think there is probably still some pain left in this market and it won’t happen that quickly.  It’s possible we get a weak bounce near those Jan lows before ultimately taking it out. 

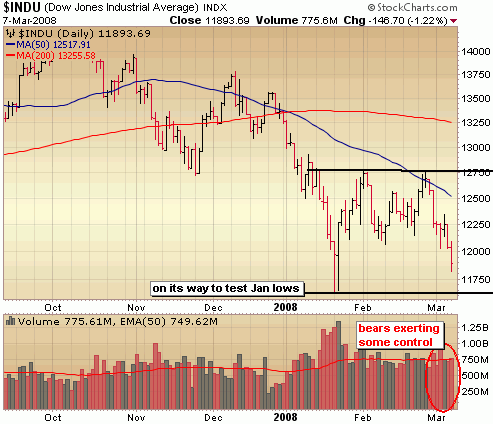
The Dow looks like the S&P and needs to test the January lows as well.  Note the channel that’s shaping up. 

::: Model Portfolio :::

** This section will now appear as a separate report to be published every other Wednesday

The Self Investors Model Portolio wrapped up 2007 with a 30.2% gain.  Would you like to receive buy and sell alerts within minutes (NEW! now get them via instant messaging in near real time) of each transaction in the portfolio?  You can receive these along with ALL of the tracking tools and reports with the very popular Gold membership.  Don’t delay, get started today and join me for many more highly profitable months here at SelfInvestors.com.

::: Best/Worst Performers :::

– Top 10 Performing Industries For the Week –

1. Meat Products: 3.55%
2. Trucking: 1.95
%
3. Tobacco Products: 1.85%
4. Grocery Stores: 1.75%
5. Multimedia & Graphics Software: 1.70%
6. Gold: 1.10%
7. Air Delivery & Freight Service:  1.05%
8. Application Software: .80%
9. Broadcasting – Radio: .75%
10. Discount – Variety Stores: .75%

– Top 10 Worst Performing Industries For the Week –

1. Mortgage Investment: -20.35%
2. Processing Systems & Products: -11.45%
3. Consumer Services: -10.50%
4. Savings & Loans: -9.45
6. Catv Systems: -8.95%
7. Education & Training Services: -8.75%
8. Surety & Title Insurance: -8.45%
9. Rental & Leasing Services: -7.30%
10. Home Health Care: -7.25%

– Top 5 Best Performing ETFs For the Week –
 
1. US Natural Gas (UNG) 4.70%
2. US Oil Fund (USO)  4.10%
3. Powershares Commodities (DBC) 3.05%
4. Ishares Tawain (EWT) 2.40%
5. Ishares Silver (SLV) 1.90%

– Worst 5 Performing ETF’s –

1. Herzfeld Caribbean Basin (CUBA) -13.40%
2. iPath India (INP) -12.45%
3. 
India Fund (IFN) -10.80%
4. Morgan Stanley India Fund (IIF) -10.40%
5. iShares Home Construction (ITB
) -9.35%

:::  IPO’s Worth Watching for This Week :::

This section will now appear as a separate post on Mondays (if there are some interesting IPO’s coming to market).

While 2008 should be a much slower year for IPO’s considering the deterioration of the market, there will continue to be some good companies coming to market here and there.  I’ll be highlighting the best IPO’s every Monday.

::: Upcoming Economic Reports (3/10/2008– 3/14/2008) :::

Monday:         Wholesale Inventories
Tuesday:       Trade Balance
Wednesday:  Trade Budget, Crude Inventories
Thursday:      Import/Export Prices, Initial Claims, Retail Sales, Business Inventories
Friday:            CPI

::: Earnings I’m Watching This Week :::

Monday:
Bancolombia (CIB), China Security & Surveillance (CSR), Companhia Energetica (CIG), Gaiam (GAIA), Hovanian (HOV), LMI Aerospace (LMIA),

Tuesday:
Dicks Sporting Goods (DKS), DIVX Inc (DIVX), GigaMedia (GIGM), LSB Industries (LXU)

Wednesday:
Air Methods (AIRM), Flotek (FTK), Fushi Copperweld (FSIN), JA Solar (JASO), NGA Resources (NGAS), Sigma Designs (SIGM), T3 Energy Services (TTES), TBS Intl (TBSI), WuXi Pharma (WX)

Thursday:
Aeropostale (ARO), Akeena Solar (AKNS), Arena Resources (ARD), Comtech Group (COGO), Metalico (MEA), Pacific Sunwear (PSUN), Zumiez (ZUMZ)

Bears Make Defining Move, Retest of Lows More Likely

Last Friday’s action was a polar opposite of the previous Friday.  Last time around, there was Charlie Gasparino saving the day for the bulls, with the announcement of an imminent Ambac bailout.  A furious 30 minute rally saved the indices from breaking short term support levels, which would have created the likelihood of a retest of those January lows.  As it turns out, that move was just delayed by a week.  With a half hour to go on Friday and the indices breaking short term support levels once again (details in the charts below), you wondered if there was going to be yet another speculative rumor floated about that would save the day.  If not, then perhaps some good old fashioned plunge protection team buying to save the day.  Nothing.  This time around it was nowhere to be found, leaving the indices in a precarious situation with a retest of those January now very much likely in the coming days.  What a difference a week makes. 

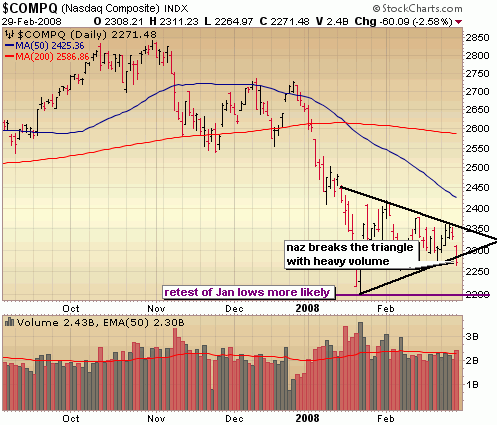
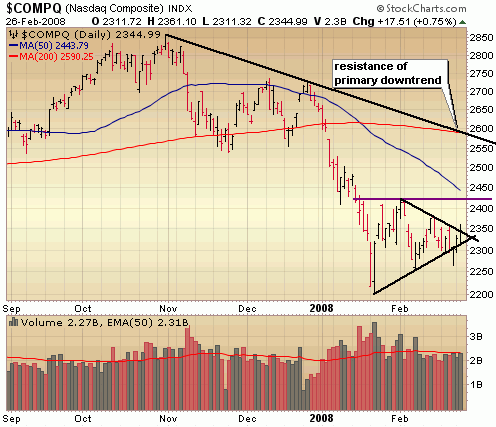
Take a look at a chart of the Nasdaq and you notice that it has taken out support of a triangle formation with increasing sell volume on Friday.  If there is one bright spot to Friday’s move, it’s that sell volume wasn’t extreme, but you can’t help but believe that this sets us up for a retest of the January lows soon.

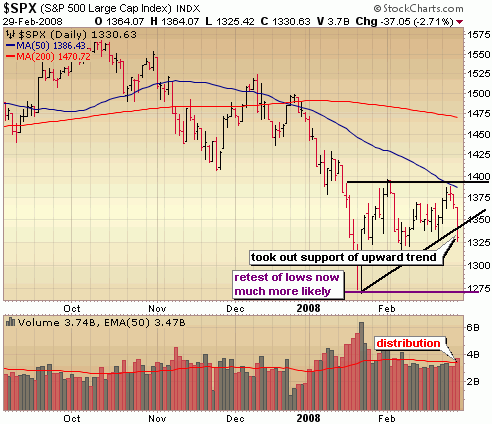
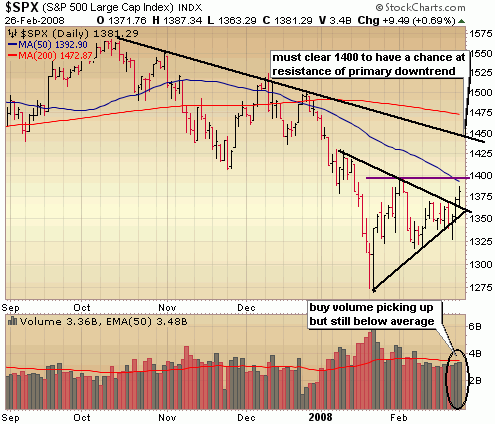
The S&P has also taken out support of the short upward trend off the big capitulation day a few weeks ago, setting up a likely move to test the January lows around 1275 in the coming days.

The Dow too, couldn’t quite bust through the next level of resistance around 12750, but hasn’t quite busted through short term support either.  However, given Friday’s momemtum to the downside, it appears to be just a matter of time.

Friday’s move was one of the most siginificant in since the capitulation in mid January and really puts the bears in control in the short term.  If you’ve captured some profits in recent days, it might be a good idea to lock it in and if you’re sitting on some losses don’t let them get out of hand.  Cut ’em quick and have a seat on the sidelines until the technical action improves.

::: Model Portfolio :::

** This section will now appear as a separate report to be published every other Wednesday

The Self Investors Model Portolio wrapped up 2007 with a 30.2% gain.  Would you like to receive buy and sell alerts within minutes (NEW! now get them via instant messaging in near real time) of each transaction in the portfolio?  You can receive these along with ALL of the tracking tools and reports with the very popular Gold membership.  Don’t delay, get started today and join me for many more highly profitable months here at SelfInvestors.com.

::: Best/Worst Performers :::

– Top 10 Performing Industries For the Week –

1.Silver: 9.25%
2. Toy & Hobby Stores: 6.40
%
3. Music & Video Stores: 6.25%
4. Computer Based Systems: 5.35%
5. Independent Oil & Gas: 4.25%
6. Gold: 3.30%
7. Consumer Services:  3.25%
8. Personal Computers: 3.20%
9. Computer Peripherals: 3.10%
10. Auto Parts Wholesale: 3.05%

– Top 10 Worst Performing Industries For the Week –

1. Dairy Products: -10.40%
2. Processing Systems & Products: -9.40%
3. Major Airlines: -9.35%
4. Sporting Goods Stores: -8.85
6. Banks – SE: -8.60%
7. Recreational Goods: -7.85%
8. Catalog & Mail Order Houses: -7.15%
9. Office Supplies: -6.35%
10. Banks – Mid Atlantic: -6.25%

– Top 5 Best Performing ETFs For the Week –
 
1. HLDRS Regional Bank (RKH) 6.38%
2. KBW Bank (KBE)  6.00%
3. US Broker Dealer (IAI) 7.40%
4. Ishares Brazil (EWZ) 7.30%
5. Market Vectors Gold Miners (GDX) 7.15%

– Worst 5 Performing ETF’s –

1. HLDRS Regional Bank (RKH) -6.40%
2. KBW Bank (KBE) -6.00%
3. 
iShares Broker/Dealer (IAI) -5.60%
4. HLDRS Internet (HHH) -5.10%
5. SPDR Financial (XLF
) -5.05%

:::  IPO’s Worth Watching for This Week :::

This section will now appear as a separate post on Mondays (if there are some interesting IPO’s coming to market).  It continues to be a very slow IPO market this year, but maybe Visa will help jump start it towards the end of this month.

While 2008 should be a much slower year for IPO’s considering the deterioration of the market, there will continue to be some good companies coming to market here and there.  I’ll be highlighting the best IPO’s every Monday.

::: Upcoming Economic Reports (3/3/2008– 3/7/2008) :::

Monday:         Construction Spending, ISM Index
Tuesday:       Auto/Truck Sales
Wednesday:  ADP Employment, Productivity, Factory Orders, ISM Services, Crude Inventories, Fed’s Beige Book
Thursday:      Pending Home Sales, Initial Claims
Friday:            Nonfarm Payrolls, Unemployment Rate

::: Earnings I’m Watching This Week :::

Monday:
51Jobs (JOBS), Home Inns & Hotels Management (HMIN)

Tuesday:
Balchem (BCPC), Gafisa (GFA), Perficient (PRFT), Simcere Pharmaceutical Group (SCR), Sun Hydraulics (SNHY), Trina Solar (TSL)

Wednesday:
Canadian Solar (CSIQ), Comtech Telecommunications (CMTL), Costco (COST), DXP Enterprises (DXPE), Fuel Tech (FTEK), Gasco Energy (GSX), Mindray Medical (MR), Smith Micro Software (SMSI), Union Drilling (UDRL)

Thursday:
American Oriental (AOB), Copart (CPRT), Daystar Technologies (DSTI), Dynamic Materials (BOOM), Sun Healthcare Group (SUNH), Urban Outfitters (URBN)

Friday:
Veolia Environment (VE)

::: In Case You Missed It – SelfInvestors Blog Entries of the Past Week :::

1. Despite Inflation Data & Google, Market Breaks Out But Volume A Concern

2. Losses Mount, Stock Rises in Fannie Mae (FNM) & Toll Brothers (TOL)

Despite Inflation Data & Google, Market Breaks Out But Volume A Concern

When a market shifts from one of topping to bottom seeking, you begin to notice a shift in reaction to the news.  At tops, it seems the market shrugs good news aside and looks for an excuse to sell.  That’s because most of the good news has been built into the price already.  Near the bottom, you see the market begin to ignore some of the bad news and begin rallying on any glimmer of hope.  We have been seeing this in the homebuilders for a couple of months now, which is why I had been writing about a bottom in that space long before the talking heads jumped on board.  The market looks well into the future and prices those events in.  That’s why you see the stocks rise long before you begin to see the housing data improve.  I still get a kick out of the few emails reminding me that the homebuilders are doomed for many years and that there is no way this is a bottom.  Well, it’s nothing more than opinion.  The charts of the homebuilders and the reaction to their awful earnings reports were telling something quite different. 

The same thing happens in the overall market as well.  I alluded to this change of character a bit to my members in an email last night, saying:

"We kind of picked up where we left off on Friday to some degree.  A relatively flat day gave way to a wave of buying in the latter half of the day on yet more bond insurer happenings.  Where as Friday’s move was based more on speculation, today’s move was based on the lack of a downgrade from Standard & Poors in credit ratings on both Ambac and MBIA (although Ambac remains on credit watch).  It appeared the market was just looking for another excuse to rally which is a positive sign for bulls.  Remember that at market bottoms, the market begins to shrug bad news aside and rally on any glimmer of hope.  That’s what we saw today.  It led to a break out from those wedge formations in both the Dow and S&P which provides a bullish outlook for the market in the short term, but let’s not forget that we have big economic data pouring in over the next few days.  Today was a good start, but how the market reacts over the next few days will be critical and getting aggressive on the long side here doesn’t make much sense considering the economic news of late has not been good.  Great caution is still the best approach at this time."

The bad news continued to flow out of the gates this morning.  The producer price index at double the estimates and a Google sell off would have easily derailed this market just a few short weeks ago.  Instead, the market chose to look at the IBM buy back and the comments from Fed Vice Chairman Donald Kohn, saying that he doesn’t expect elevated inflation rates.  to continue.  Of course that’s quite the opposite of what Dallas Fed President Fisher said just a few hours later!  He said, "I’m more concerned about inflation than I have been of late. It’s a growing concern. We see it particularly in commodities and energy products."  You think?

Look at the retailers today.  If you had told me a few weeks ago that retailers would get big institutional buying and big breakouts, I’d probably have said you were crazy.  Weakening economy, rising inflation, housing problems.. yet retailers are rocking.  Just look at Urban Outfitters (URBN) and Buckle (BKE).  Both broke out big today and are great examples of basing buys and sells on the charts which are the best leading indicators around.  How about Home Depot?  Missed estimates and warned about declining earnings.  Stock was down big right?  Nope.  It ended flat.  If that’s not a signal that a bottom is being put in on Home Depot, I don’t know what is.  Pay attention to price and volume, particularly surrounding a news event.  It’s all you’ll ever need.

There’s no question the character of this market is beginning to change to the bullish side of the coin, but as far as I’m concerned this is still a bear market and it still pays to be careful.  That means initiating smaller positions than you normally would, not chasing stocks and cutting losses quickly.  The indices have broken out of the wedge formations I’ve been discussing here, but keep in mind there are big overhead resistance areas all over the place.  Let’s have a look.

The Nasdaq actually just closed a hair above that wedge formation today and continues to lag the rest of the market.  Take out Google and you might have a different story.  At any rate it does look poised to at least test those January highs soon around 2425 as long as it holds above today’s lows, which marks the area around the bottom of the wedge formation.  The amount of buy volume over the past few days has been a bit of a concern.  You want to see institutions jumping in with both feet, but they aren’t doing that just yet which is why I remain cautious.

nasdaq

The S&P has cleared that wedge formation but again, volume is somewhat lacking indicating a lack of momentum.  It’s going to be tough to push through that resistance around 1400 without institutional help. 

s&p500

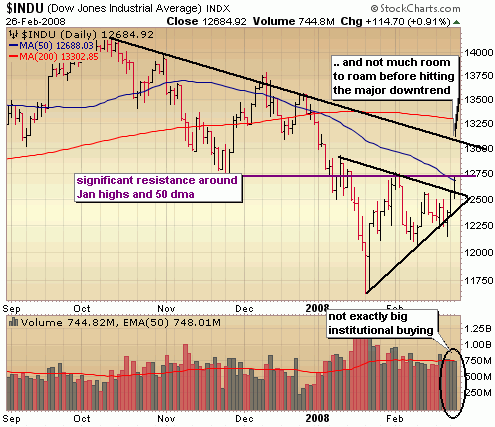
The Dow busted through the wedge AND hit resistance at the Jan highs today before pulling back a bit.  Not much conviction behind the moves of the past 3 days.  Notice that even if it does bust through the Jan highs, big resistance of the primary downtrend is not far ahead.

I like the reaction to the news of late and it does appear the character of the market is improving some, but it doesn’t make sense to get aggressive right here.  Any light volume pull backs would offer chances to get into companies with superior fundamentals and technicals, but putting on smaller positions until more leadership and institutional buying emerges is probably the best bet.


::: Major Indices Performance – The Numbers :::

(Note: volume averages are based on the average over the past 50 days)
Data as of 4:00EST – End of Day February 26th 2008

Nasdaq: UP .75% today with volume right around average
Nasdaq ETF (QQQQ) .39%, volume 15% BELOW average
Dow: UP .91%, with volume 1% BELOW the average
Dow ETF (DIA): UP .99%, with volume 17% BELOW the average
S&P ETF (SPY): UP .75%,  with volume 9% BELOW the average
Russell Small Cap ETF (IWM): UP .93%, with volume 5% BELOW the average

::: SelflInvestors Leading Stocks :::

The Self Investors Leading Stocks Index is comprised of stocks in the Breakout Tracker, which is a database of the fastest growing companies near a breakout or having already broken out of a base.  Leading stocks actually performed better than of all the major indices, which was encouraging.

Summary:

* Advancers led Decliners 161 to 75
* Advancers were up an average of 2.63% today, with volume 13% ABOVE average
* Decliners were down an average of 1.37% with volume 16% ABOVE the average
* The total SI Leading Stocks Index was UP 1.18% today with volume 14% ABOVE average

::: Where’s the Money Flowing :::

Many investing websites provide leading industries based on price performance alone. However, without accompanying volume levels, this can sometimes be misleading.  The only way that I know of to gauge industry/sector strength WITH volume levels is through the analysis of ETF’s.  A couple years ago this was not possible, but as more traders/investors use ETF’s they become a much better tool for gauging the health of the market and seeing where the money is flowing (or not flowing).  Using the proprietary SelfInvestors Demand Indicator score which measures price and volume movements, I’m able to quickly see which sectors/industries are seeing the greatest inflows of cash.  For a detailed look at how I go about gauging sector/industry strength please see the following post: http://selfinvestors.com/si/industry_tracking/

* Current Leading Sectors/Industries (over last 30 trading days):  
Coal, Agriculture, Natural Resources, Commodities, Biotech and Oil
                                          
* Current Lagging Sectors/Industries (over last 30 trading days): 
Health Care Providers, Utilities, Telecom, Aerospace/Defense, Broker/Dealers

* Today’s Market Moving Industries/Sectors (UP):
Home Construction, Home Builders, Retail, Commodities, Gold Miners

* Today’s Market Moving Industries/Sectors (DOWN):
Internet, Coal

::: Stocks :::

The stocks section will be an area where I highlight one stock selected from a group of stocks moving up with volume well above average and most likely breaking out of a base or consolidation.  I’m running short on time tonight, so won’t have a stock of the day tonight, but have a look at these Self Investors Leading Stocks that moved up with volume today and are above both the 50 and 200 day moving averages.  They are listed in order of Fundamental Rank. 

If you’d like, you can get access to my entire database of leading stocks (which includes great filters) with just a Silver Membership!

Ctrip.com (CTRP)
Mechel (MTL)
Natural Gas Services (NGS)
Meridian Bioscience (VIVO)
Website Pros (WSPI)
FCStone (FCSX)
Somanetics (SMTS)
Axsys Technologies (AXYS)
Greif (GEF)
Chindex International (CHDX)
Carrizo Oil & Gas (CRZO)