When a market shifts from one of topping to bottom seeking, you begin to notice a shift in reaction to the news. At tops, it seems the market shrugs good news aside and looks for an excuse to sell. That’s because most of the good news has been built into the price already. Near the bottom, you see the market begin to ignore some of the bad news and begin rallying on any glimmer of hope. We have been seeing this in the homebuilders for a couple of months now, which is why I had been writing about a bottom in that space long before the talking heads jumped on board. The market looks well into the future and prices those events in. That’s why you see the stocks rise long before you begin to see the housing data improve. I still get a kick out of the few emails reminding me that the homebuilders are doomed for many years and that there is no way this is a bottom. Well, it’s nothing more than opinion. The charts of the homebuilders and the reaction to their awful earnings reports were telling something quite different.
The same thing happens in the overall market as well. I alluded to this change of character a bit to my members in an email last night, saying:
"We kind of picked up where we left off on Friday to some degree. A relatively flat day gave way to a wave of buying in the latter half of the day on yet more bond insurer happenings. Where as Friday’s move was based more on speculation, today’s move was based on the lack of a downgrade from Standard & Poors in credit ratings on both Ambac and MBIA (although Ambac remains on credit watch). It appeared the market was just looking for another excuse to rally which is a positive sign for bulls. Remember that at market bottoms, the market begins to shrug bad news aside and rally on any glimmer of hope. That’s what we saw today. It led to a break out from those wedge formations in both the Dow and S&P which provides a bullish outlook for the market in the short term, but let’s not forget that we have big economic data pouring in over the next few days. Today was a good start, but how the market reacts over the next few days will be critical and getting aggressive on the long side here doesn’t make much sense considering the economic news of late has not been good. Great caution is still the best approach at this time."
The bad news continued to flow out of the gates this morning. The producer price index at double the estimates and a Google sell off would have easily derailed this market just a few short weeks ago. Instead, the market chose to look at the IBM buy back and the comments from Fed Vice Chairman Donald Kohn, saying that he doesn’t expect elevated inflation rates. to continue. Of course that’s quite the opposite of what Dallas Fed President Fisher said just a few hours later! He said, "I’m more concerned about inflation than I have been of late. It’s a growing concern. We see it particularly in commodities and energy products." You think?
Look at the retailers today. If you had told me a few weeks ago that retailers would get big institutional buying and big breakouts, I’d probably have said you were crazy. Weakening economy, rising inflation, housing problems.. yet retailers are rocking. Just look at Urban Outfitters (URBN) and Buckle (BKE). Both broke out big today and are great examples of basing buys and sells on the charts which are the best leading indicators around. How about Home Depot? Missed estimates and warned about declining earnings. Stock was down big right? Nope. It ended flat. If that’s not a signal that a bottom is being put in on Home Depot, I don’t know what is. Pay attention to price and volume, particularly surrounding a news event. It’s all you’ll ever need.
There’s no question the character of this market is beginning to change to the bullish side of the coin, but as far as I’m concerned this is still a bear market and it still pays to be careful. That means initiating smaller positions than you normally would, not chasing stocks and cutting losses quickly. The indices have broken out of the wedge formations I’ve been discussing here, but keep in mind there are big overhead resistance areas all over the place. Let’s have a look.
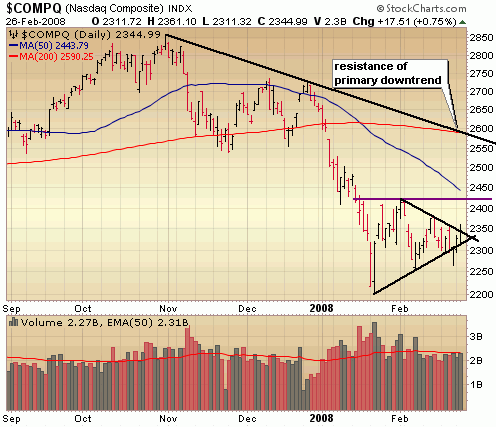
The Nasdaq actually just closed a hair above that wedge formation today and continues to lag the rest of the market. Take out Google and you might have a different story. At any rate it does look poised to at least test those January highs soon around 2425 as long as it holds above today’s lows, which marks the area around the bottom of the wedge formation. The amount of buy volume over the past few days has been a bit of a concern. You want to see institutions jumping in with both feet, but they aren’t doing that just yet which is why I remain cautious.
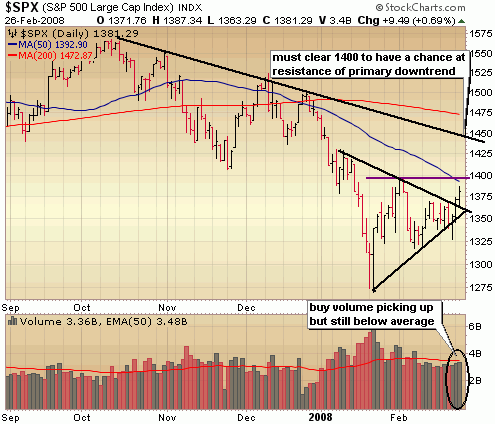
The S&P has cleared that wedge formation but again, volume is somewhat lacking indicating a lack of momentum. It’s going to be tough to push through that resistance around 1400 without institutional help.
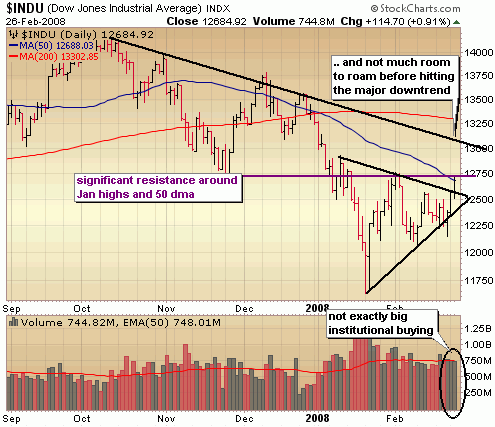
The Dow busted through the wedge AND hit resistance at the Jan highs today before pulling back a bit. Not much conviction behind the moves of the past 3 days. Notice that even if it does bust through the Jan highs, big resistance of the primary downtrend is not far ahead.
I like the reaction to the news of late and it does appear the character of the market is improving some, but it doesn’t make sense to get aggressive right here. Any light volume pull backs would offer chances to get into companies with superior fundamentals and technicals, but putting on smaller positions until more leadership and institutional buying emerges is probably the best bet.
(Note: volume averages are based on the average over the past 50 days)
Data as of 4:00EST – End of Day February 26th 2008
Nasdaq: UP .75% today with volume right around average
Nasdaq ETF (QQQQ) .39%, volume 15% BELOW average
Dow: UP .91%, with volume 1% BELOW the average
Dow ETF (DIA): UP .99%, with volume 17% BELOW the average
S&P ETF (SPY): UP .75%, with volume 9% BELOW the average
Russell Small Cap ETF (IWM): UP .93%, with volume 5% BELOW the average
::: SelflInvestors Leading Stocks :::
The Self Investors Leading Stocks Index is comprised of stocks in the Breakout Tracker, which is a database of the fastest growing companies near a breakout or having already broken out of a base. Leading stocks actually performed better than of all the major indices, which was encouraging.
* Advancers led Decliners 161 to 75
* Advancers were up an average of 2.63% today, with volume 13% ABOVE average
* Decliners were down an average of 1.37% with volume 16% ABOVE the average
* The total SI Leading Stocks Index was UP 1.18% today with volume 14% ABOVE average
Many investing websites provide leading industries based on price performance alone. However, without accompanying volume levels, this can sometimes be misleading. The only way that I know of to gauge industry/sector strength WITH volume levels is through the analysis of ETF’s. A couple years ago this was not possible, but as more traders/investors use ETF’s they become a much better tool for gauging the health of the market and seeing where the money is flowing (or not flowing). Using the proprietary SelfInvestors Demand Indicator score which measures price and volume movements, I’m able to quickly see which sectors/industries are seeing the greatest inflows of cash. For a detailed look at how I go about gauging sector/industry strength please see the following post: http://selfinvestors.com/si/industry_tracking/
* Current Leading Sectors/Industries (over last 30 trading days):
Coal, Agriculture, Natural Resources, Commodities, Biotech and Oil
* Current Lagging Sectors/Industries (over last 30 trading days):
Health Care Providers, Utilities, Telecom, Aerospace/Defense, Broker/Dealers
* Today’s Market Moving Industries/Sectors (UP):
Home Construction, Home Builders, Retail, Commodities, Gold Miners
Internet, Coal
::: Stocks :::
The stocks section will be an area where I highlight one stock selected from a group of stocks moving up with volume well above average and most likely breaking out of a base or consolidation. I’m running short on time tonight, so won’t have a stock of the day tonight, but have a look at these Self Investors Leading Stocks that moved up with volume today and are above both the 50 and 200 day moving averages. They are listed in order of Fundamental Rank.
If you’d like, you can get access to my entire database of leading stocks (which includes great filters) with just a Silver Membership!
Ctrip.com (CTRP)
Mechel (MTL)
Natural Gas Services (NGS)
Meridian Bioscience (VIVO)
Website Pros (WSPI)
FCStone (FCSX)
Somanetics (SMTS)
Axsys Technologies (AXYS)
Greif (GEF)
Chindex International (CHDX)
Carrizo Oil & Gas (CRZO)