All posts by Tate Dwinnell

Gold & US Real Estate Break Trendlines – Major Correction in REIT’s Loom

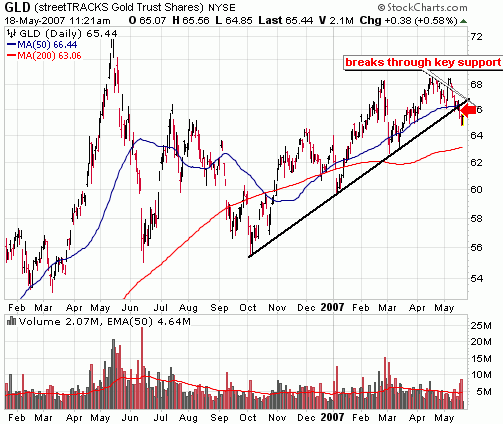
While most of the focus has been on the market making new highs and how long it will last, Gold and US Real Estate (REITs) have been quietly breaking down.

Here’s a chart of the Streettracks Gold Trust (GLD) which seeks to track the price of gold bullion.  You can see it’s broken through an 8 month trendline with a drop to the next level of support around the 50 day moving average likely.

gold breaks trendline streettracks gold trust gld

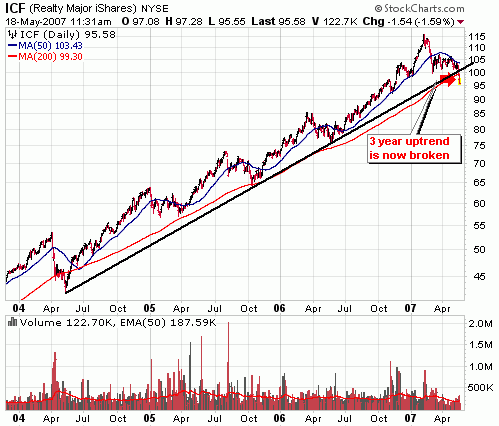
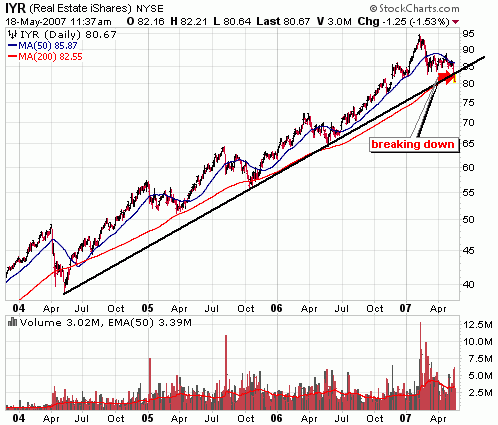
After a tremendous 4 year run, it appears the REIT’s are on their last leg and setting up for a major correction over the next several months.  Two of the major real estate ETF’s that I track, the Ishares Real Estate Index (IYR) and the Ishares Cohen & Steers Realty Index (ICF) illustrate this break down.

real estate reit ishares ICF

IYR ishares real estate break trendline

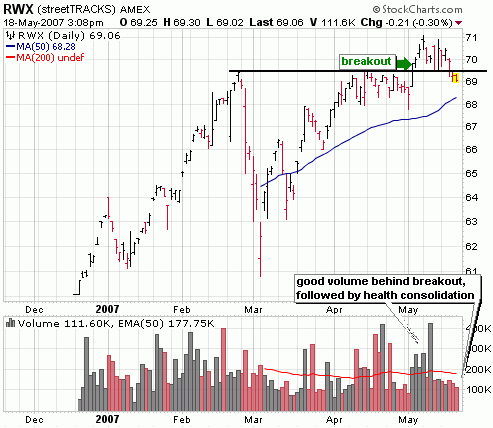
It’s interesting to note that while US Real Estate breaks down, international real estate is holding up well as indicated by the SPDR Willshire International Real Estate Etf (RWX).  It broke out in May and is holding the breakout well.

international real estate streettracks RWK etf

Getting A Better Entry In the Cup With Handle Base – NVE Corp (NVEC)

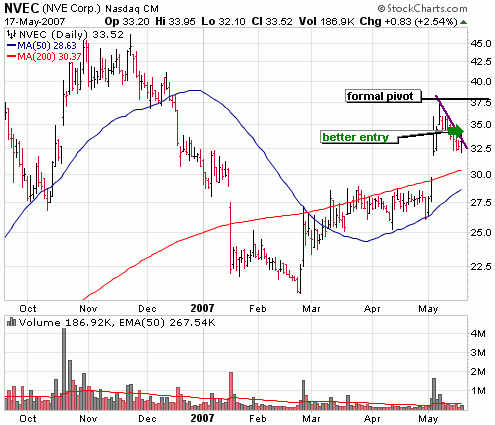
Earlier today, I notified premium members that I was watching NVE Corp (NVEC) for an entry.  The stock has carved out a deep base over the last several months, but is moving again in the right side with volume following their last earnings report.  The formation is what is often referred to as a cup with handle formation.  It’s currently forming the handle with the formal pivot being .10 above the highest point of the handle which in this case is 37.77.  I almost never buy a stock at the pivot point in cup with handle formations, but rather prefer to get in on the first big move out of consolidation from the handle formation.  This is a much lower risk entry as fewer people are initiating positions here. 

You can draw a short downward trend line (the line in purple in my chart below) across the high points of the handle to get an idea of where the stock needs to break from for an entry.  It nearly indicated an entry today after getting a bit of a pop late in the day, but it stalled out in the last hour or so and didn’t quite clear that resistance.  However, today’s move may be the beginning of a much larger move tomorrow and provide an entry.  We shall see.  Given the deep base, which is prone to failure, I’d be looking to exit my position near all time highs around 45.

nve corp nvec cup with handle

Billionaires Buoy Buying; Stock of Day – Copa Holdings (CPA)

Following yesterday’s big reversal with heavy volume, it finally looked like this market was ready for a sustained bout of selling.  Typically, that kind of downward momentum leads to further deterioration the next day, or at best a flat day.  But in yet another surprising surge, the bulls continue to put up a fight.  It seems that the market just continues to look for an excuse to push higher.  This time around the excuse to buy seemed to be news of some billionare buying in Citigroup and J&J from the likes of Eddie Lampert and Warren Buffett. 

Technically, the volume behind today’s move indicated decent conviction, but it wasn’t enough to indicate accumulation or completely render yesterday’s move as meaningless.  Based on volume levels over the past couple weeks, the strength of this market continues to weaken.  That doesn’t mean it can’t continue to move up a bit longer (after all, the Dow did make another record high and the S&P did reclaim its upward channel), it just means it will pay to be very cautious up here.  The extreme volatility over the past several trading sessions indicate instability and I’m certainly not going to make aggressive bets on either side until it settles down.

::: Major Indices Performance – The Numbers :::

(Note: volume averages are based on the average over the past 50 days)
Data as of 4:00EST – End of Day May 16th 2007

Today’s move had volume behind it but not enough to signal a day of accumulation.

Nasdaq: UP .88% today with volume 4% ABOVE  average
Nasdaq ETF (QQQQ) UP .98%, volume 34% ABOVE average
Dow: UP 77%, volume 6.5% ABOVE the average
Dow ETF (DIA): UP .75%, volume 59% ABOVE the average
S&P ETF (SPY): UP .68%, volume 6% ABOVE the average
Russell Small Cap ETF (IWM): UP  .56%, volume 61% ABOVE the average

::: SelflInvestors Leading Stocks :::

The Self Investors Leading Stocks Index is comprised of stocks in the Breakout Tracker, which is a database of the fastest growing companies near a breakout or having already broken out of a base.  Leading stocks lagged the performance of the leading indices and volume was considerably heavier in down stocks today.

Summary:

* Advancers led Decliners 265 to 162
* Advancers were up an average of 1.57% today, with volume 2% ABOVE average
* Decliners were down an average of 1.42% with volume 16% ABOVE average
* The total SI Leading Stocks Index was UP .44% today with volume 7% ABOVE the average

::: Where’s the Money Flowing :::

Many investing websites provide leading industries based on price performance alone. However, without accompanying volume levels, this can sometimes be misleading.  The only way that I know of to gauge industry/sector strength WITH volume levels is through the analysis of ETF’s.  A couple years ago this was not possible, but as more traders/investors use ETF’s they become a much better tool for gauging the health of the market and seeing where the money is flowing (or not flowing).  Using the proprietary SelfInvestors Demand Indicator score which measures price and volume movements, I’m able to quickly see which sectors/industries are seeing the greatest inflows of cash.  For a detailed look at how I go about gauging sector/industry strength please see the following post: http://selfinvestors.com/si/industry_tracking/

* Current Leading Sectors/Industries (over last 30 trading days): 
Internet, Networking, Semis, Aerospace/Defense, Biotech
                                               
* Current Lagging Sectors/Industries (over last 30 trading days): 
Internet Infrastructure, Miners, Oil

* Today’s Market Moving Industries/Sectors (UP):
Transports, Internet Infrastructure, Health Care Providers, Telecom, Financial, Health Care

* Today’s Market Moving Industries/Sectors (DOWN):
Gold Miners, Gold, Realty, Commodities

::: Stocks :::

The stocks section will be an area where I highlight one stock selected from a group of stocks moving up with volume well above average and most likely breaking out of a base or consolidation.  Today’s stock is Panamanian airliner Copa Holdings (CPA) – it broke out of a base today to a new all time high with near record volume.

ABOUT:  Copa Holdings, S.A. (Copa Holdings) is a provider of international airline passenger and cargo service. It offers approximately 92 daily scheduled flights among 30 destinations in 20 countries in North, Central and South America and the Caribbean from its Panama City hub. The Company provides passengers with access to flights to more than 120 other destinations through code share arrangements with Continental Airlines, Inc. (Continental), pursuant to which each airline places its name and flight designation code on the other’s flights. On April 22, 2005 the Company acquired AeroRepublica S.A. (AeroRepublica), a Colombian air carrier providing point-to-point service among 12 cities in Colombia and to Panama City. AeroRepublica operated a fleet of seven leased MD-80s and two owned DC-9s. As of December 31, 2005, Copa Holdings fleet consists of 22 Boeing 737-Next Generation aircraft, two Embraer 190 aircraft, 11 MD-80 aircraft and two DC-9 aircraft.

FUNDAMENTALS: After losing money in 2000, Copa Holdings has since reeled off 6 straight years of very impressive earnings growth – 37% in ’01, followed by growth in the following years of 135%, 41%, 21% and 60% last year.  In ’07, the company is expected to increase earnings by another 34% so the future contiues to look bright.  Net margins are very good and well ahead of the industry average at around 16%, while return on equity (ROE) is an oustanding 43% and rising,  If there is a negative, it’s the amount of debt the company carries which is considerably higher than other airliners (however, it has been decreasing over the years).

TECHNICAL:  CPA broke out of a cup with handle base today with near record volume to a new all time high.  That’s the good news.  The bad news is that sell volume in the left side of the base is very heavy.  Given the incredible run the stock had last year when it tripled in price, it’s not too suprising to see that kind of sell volume in the left side, but it does lend a little doubt to the success of this breakout.  What I did is leave the breakout alone and am looking for a light volume pull back to the 64 – 65 range, essentially make the stock prove to me it can hold this breakout before initiating a position.  Despite last year’s run, I believe there is still some room to run in this stock given the fact this is just a second stage base.  It won’t triple again, but don’t be suprised to see it move another 20 – 40% over the next year.

SELFINVESTORS RATING: With a total score of 50/60 (27/30 for fundamentals, 23/30 for technical), Copa Holdings (CPA) is an excellent breakout stock opportunity.

***********
Want to easily discover these opportunities before they breakout?  Get yourself a premium membership to SelfInvestors.com.  You can still get all the tracking features for the low introductory price of $19.95 (Silver Membership)

Upgrade your membership today!     Or new members may sign up here
***********

Full Disclosure/Disclaimer: The stock of the day is by no means a buy recommendation.  Please do your own research and make a personal decision based on your own tolerance for risk.  I currently do not own a position in Copa Holding (CPA)

Market Rally Hinges on Rate Cut; Hot Solar IPO – China Sunergy (CSUN)

With earnings season all but over, the focus has turned to the economy and traders are looking for any indication that the Fed will cut rates which would undoubtedly send this market even higher – in other words a cooling economy, but not too cool and tame inflation readings.  On Thursday, same store retailer readings were much cooler than expected which contributed to the sharp, higher volume drop and breach of support levels. Considering the market closed at the lows of the day, momentum would have you believe that Friday could have been ugly as well.  However, tame PPI data gave traders hope that a weakening economy and tame inflation just might lead to a rate cut and bulls managed to recoup nearly all over Friday’s losses.  The never ending M&A mania helped a bit too :). 

From a technical standpoint, even though the indices closed with minor gains for the week, I still consider it a week of deteriorating technicals.  Waning volume on the buy side culminated in a large volume drop below first level support in the S&P and Nasdaq.  Yes, the fact that there wasn’t any selling follow through on Friday is a positive for bulls, but keep in mind that there was little conviction behind Friday’s move and first levels support lines are still busted.

I think this week will be key and should provide us with clues as to when we can expect some sort of consolidation in this market.  We get CPI on Tuesday and Housing Startes on Wednesday.  Both could be market movers.  I still think it pays to be extremely cautious right now! 

::: Model Portfolio Update :::

It’s been  the same old story with the Model Portfolio.  I continue to sit largely in cash and that has hurt my performance, but I’m not going to chase this market for fear of "being left out".  I’m remaining patient for the right time to get more aggressive and that time isn’t now.  During the week I closed out 4 Quick Strike profit positions (3 ahead of their earnings reports) – AKRX (6%), HGR (-2%) and one core holding in a top semiconductor play – TrioTech (TRT) for a small gain of 1%.  As I almost always do with these unproven small caps, I sold TRT ahead of earnings.  The stock has soared over 30% since.. doh!!  I’m not about to abandon that strategy though.  It has saved my ass several times.  I did however make the rare exception and decide to hold KOG through earnings because of the tremendous buying demand over the past few months as well as the large number of institutions intiating positions (including the legendary Steven Cohen).  When the stock didn’t pop at the open, but dipped below short term support, I decided to lock in my 13% gain.  However, by the end of the day, the stock reversed sharply, keeping the bullish pennant formation intact.  I’m considering re-initiating a position soon. 

Those "ahead of earnings" closed positions were replaced with two new QSP positions and a core position in a stock that has been listed atop the breakout stock watch screens on several occassions over the past year.  Overall, the portfolio dipped this week and for the first time in a long time the YTD  performance (5.5%) has dipped below that of the S&P500 which stands at 6.2%.  The current allocation of the portfolio stands at 34% long, 13% short and 53% cash.

::: Best/Worst Performers :::

– Top 10 Performing Industries For the Week –

1. Aluminum: 14.05%
2. Heavy Construction: 11.40%
3. Nonmetallic Mineral Mining: 5.05%
4. Recreational Goods: 4.60%
5. REIT – Residential: 3.80%
6. Steel & Iron: 3.65%
7. Metal Fabrication:  3.25%
8. Personal Computers: 3.20%
9. Copper: 3.15%
10. Drugs – Generic: 2.75%

– Top 10 Worst Performing Industries For the Week –

1. Food Wholesale: -6.95%
2. Multimedia & Graphics: -4.45%
3. Dairy Products: -3.60%
4. Medical Equipment Wholesale: -3.35%
5. Music & Video Stores: -3.15%
6. Major Airlines: -2.55%
7. Computer Peripherals: -2.55%
8. Sporting Goods Stores: -2.50%
9. Grocery Stores: -2.30%
10. Industrial Equipment Wholesale: -2.20%

– Top 5 Best Performing ETFs For the Week –
 
1. PowerShares China (PGJ)  5.20%
2. Ishares China (FXI) 4.35%
3. Ishares South Korea (EWY) 3.20%
4. Korea Fund (KF) 2.20%
5. Chile Fund (CH) 2.10%

– Worst 5 Performing ETF’s –

1. Herzfeld Caribbean Basin (CUBA)  -10.25%
2. HLDRS Biotech (BBH) -3.90%
3. Germany Fund (GF) -3.55%
4. Ishares Biotech (IIB) -3.30%
5. Central Fund of Canada (CEF) -2.65%

:::  IPO’s Worth Watching for This Week :::

Yet another China solar IPO this week!

1. China Sunergy (CSUN): leading manufacturer of solar cell products in China as measured by production capacity. Manufactures solar cells from silicon wafers utilizing crystalline silicon solar cell technology to convert sunlight directly into electricity through a process known as the photovoltaic effect. Products are sold to Chinese and overseas module manufacturers and system integrators, who assemble  solar cells into solar modules and solar power systems for use in various markets. Trading set to begin on Friday.

2. Skilled Healthcare Group (SKH): a leading support services provider to the long term care profession. Through their administrative and support services network, they provide direct support to 61 skilled nursing facility and 12 assisted living facility business affiliates. These locations comprise over 8300 licensed beds. They also provide administrative and support services to Hallmark Rehabilitation, Inc. and Hospice Care of the West, LLC.  Trading set to begin on Tuesday.

3. CAI International (CAP): one of the world’s leading intermodal freight container leasing and management companies. Intermodal freight containers are large, standardized steel boxes, which they lease primarily to international steamship companies, and are used to transport cargo by a number of means, including ship, truck and rail. A portion of the container fleet is owned by CAI with the balance being owned by third parties on whose behalf they manage the containers. Business is operated in two segments: container leasing and container fleet management. Through an international network of offices and agents an active after-market program was developed for containers retired from the international shipping fleet.  Trading set to begin on Wednesday.

4. TechTarget (TTGT): publishes online content that "brings together buyers and sellers of corporate IT products". The company publishes 35 Web sites, each of which focuses on a specific IT sector, such as storage, security or networking. TechTarget also hosts events and conferences and publishes a small number of IT-related magazines. The company has more than 1,000 active advertisers, including Microsoft Corp. (Nasdaq: MSFT), EMC Corp. (NYSE: EMC) and IBM Corp. (NYSE: IBM), according to the statement. Trading set to begin on Thursday.

::: Upcoming Economic Reports (5/14/07 – 5/18/07) :::

Monday:        None
Tuesday:       CPI
Wednesday:  Housing Starts, Building Permits, Capacity Utilization, Industrial Production, Crude In.
Thursday:      Initial Claims, Leading Indicators, Philly Fed
Friday:           Mich Sentiment

::: Notable Upcoming Earnings Reports I’ll Be Watching This Week :::

Monday: Canadian Solar (CSIQ), Aircastle Limited (AYR)

Tuesday: MIndray Medical (MR), Companhia Paranaense de Energia (ELP)

Wednesday: Copa Holdings (CPA)                                                     
                    
Thursday: Focus Media (FMCN)

Friday: None

IPO Lockup Dates (May 13 – 19)

The IPO lockup period is a legally binding contract between the underwriters and the company undergoing the initial public offering that probits company insiders from selling their shares.  The expiration of the lockup period can be very important because it can result in downward pressure share price as insiders cash out a portion of or all of their position.

The following is a list of companies with expiring IPO lockup periods for the coming week:

Note: An * indicates those tracked by SelfInvestors in the new IPO Tracker database.. a database of only the best IPO’s coming to market

5/14/2007: Allot Communications (ALLT) *, Hansen Medical (HNSN), Hertz Global (HTZ)

5/15/2007: First Solar (FSLR) *, Nymex  (NMX) *, Venoco (VQ)

5/19/2007: AerCap Holdings (AER) *, Spirit AeroSystems (SPR) *, Willdan Group (WLDN)

Live Trading Room Case Study: Day Trade in Force Protection (FRPT)

With the launch of the new site here at SelfInvestors.com came some new features and membership options, including the option to join me in a private live trading room via Worden’s Telechart service.  One thing I’m going to try and do more often is case studies of actual trades that I discuss with Platinum members in the live trading room.  For those new to trading stocks, many of the nuances of trading can be best understood through specific examples.  The best way to do this is with video and one day I’ll get that software figured out so I can start posting live video of actual trades.  Until then, I resort to the old fashioned way.

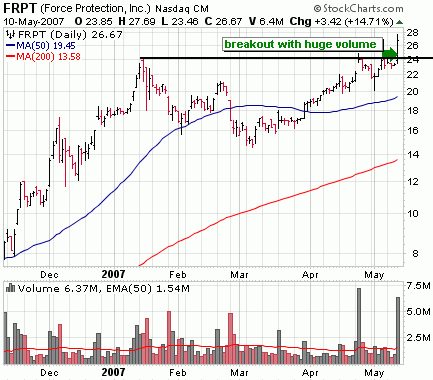
force protection frpt logo Today I wanted to highlight a successful day trade in Force Protection (FRPT) (yes, I will highlight some trades that don’t work out too!).. well, actually it was meant to be a 2 day swing trade but I decided to dump the stock given the big run up and the overall market weakness.  I’d much rather lock in a big gain and wait patiently for a pull back to the break out point for another low risk entry.  Force Protection (FRPT) is a stock that has been in my watchlist for some time and I had a real time alert set on it at 24.50 so I’d be alerted to any breakout move, which it got today:

force protection (frpt) breakout daily

Although the stock was near the top of the SelfInvestors Breakout Tracker and in my Telechart watch list, I had forgotten about it.  I was reminded of it a couple days ago by one of my members and thought that given the recent moves in Armour Holdings (AH) and Spartan Motors (SPAR), it was probably just a matter of time before it broke to a new all time high.    Yesterday morning, while reading through the alerts at Fly On the Wall, I noticed an alert on FRPT indicating the following:

Unterberg highlights a story in Army Times that says the Army is expected to ask for $9B to purchase 9K MRAPs in FY08 and additional money to purchase 8.7K in FY09. CEUT believes this provides excellent visibility for FRPT through 2009 and they expect shares to trade higher. :theflyonthewall.com

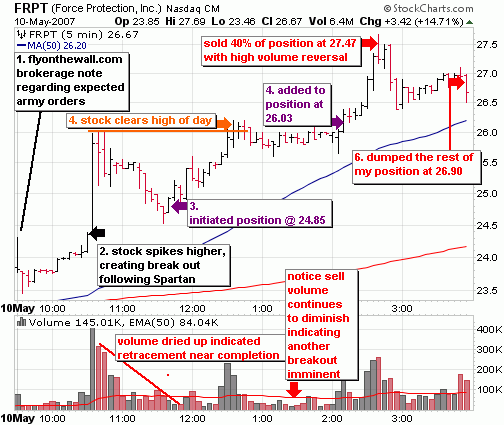
I thought that the Army Times story could move the stock so I double checked to make sure the alert was set up correctly in Telechart and went about my business.  It was about an hour later that the stock really began to move, surging about 10% in 5 minutes… but not on the Army Times story.  News was released that Spartan Motors (SPAR) received a large contract, a portion of it from FRPT.  That indicates business is booming for both companies and got ’em movin.  That triggered my alert, so I added the ticker to my brokerage real time watchlist/order screen and pulled up the real time 5 minute intraday chart of Force Protection (FRPT) in Telechart to prepare for a trade.  I NEVER chase a move like the one in FRPT at around 10:45AM EST.  Almost always the stock will digest the gain and retrace much of the move (sometimes all of the move, as was the case here).  Now is a good time to take a look at the 5 minute intraday chart to better explain how I played it.

force protection (frpt) day trade

You’ll see the 2nd point on the graph highlighting the initial surge and breakout.  From there, I was just looking for a decent entry and given the overbought market, I wasn’t about to chase anything.  The entry had to be perfect and that perfect opportunity arose.  One thing to remember is that intraday charts move just as they would on a daily.  That means that there are support/resistance levels and price/volume levels indicating shifting demand.  Just as I would on a daily chart, if I missed the initial break, then I wait for a light volume retracement.  This can be anywhere from 30% to 100% of the move.  The key to knowing when the retracement has completed is the dry up in selling volume and a subsequent shift to increasing buying demand.  Notice it continues to subside as the entire initial surge is retraced all the way to 24.50.  Now I’m looking for an entry.  Since sell volume has diminished and the entire move was retraced, I initiate my first position at 24.85 which is a low risk entry with support around 24.50 (which is where I’ll set a new alert).  Now I’m just holding looking for a breakout above the highs of the day around 26 (also set an alert here).  If the stock can clear the highs of the day with volume, I’m going to initiate another smaller position.  It does clear 26, but given the market weakness today I was fairly certain that the stock wasn’t going to clear that level and never look back.  So I waited for a convincing break and pull back.  Instead, it just kind of meandered sideways for an hour and a half as volume continued to diminish.  This kind of volume action usually indicates that a breakout move is imminent (most often in the direction of the preceding move).  I could have just watched the stock but had other things to do, so set another alert at 26.10.  It too trigged and buy volume picked up on the breakout from a cup with handle formation (yes, they can form on intraday charts too!)  I added to my position on a breakout from that formation at 26.03.  It didn’t take long for the stock to really move after clearing this resistance and I was sitting on some hefty profits.  However, with general market weakness and an overextended stock I wasn’t about to get greedy and hold on for more. I made the decision to dump 40% of the position at 27.47 after seeing the higher volume reversal at about 2:40PM EST.  The plan was to ride out the other 60% into the close because sometimes a stock can really see an acceleration of its gains in the final minutes of trading.  However, with a rapidly deteriorating market it wasn’t meant to be, so I unloaded the rest of the position at 26.90 with just a few minutes left in the trading day. 

To sum it up, I believe it pays to be flexible.  Sure mechanical rules are OK to some degree in order to keep the emotions out of trading particularly when starting out, but a multitude of trading conditions call for a multitude of strategies.  Had we been at the beginning of a bull market and FRPT not already run up over 700% in the last year I probably would have held the position for a few months rather than for a quick one day gain. It’s OK to be a buy and hold investor, a swing trader and/or day trader all at the same time depending on the circumstances

::::::::::::::

For the funds that you don’t use for trading you’re probably best served by keeping them in an internet bank. CDs are always a good option and internet banks tend to have the best CD rates. Something else to keep in mind is that there are often good banking deals that these banks will run to try to get your business. You can often get a $50-$100 sign up bonuses at a lot of quality banks.

Earnings and M&A Can’t Save the Day; Force Protection (FRPT) Breakout

Without solid earnings reports and daily M&A activity to temper the less then desirable flow of economic data, the bulls were, for the first time in several weeks, unable to stem the flow of selling pressure late in the day.  The tone was bearish early as April same store sales came in much lower than expected.  Sales were expected to be weak due to unusually cold weather and higher oil prices, but not at the lowest levels since this data began being tracked.  Add to that higher import prices and a widening trade deficit and it’s no wonder that traders scrambled to lock in profits in this overbought, over hyped market. 

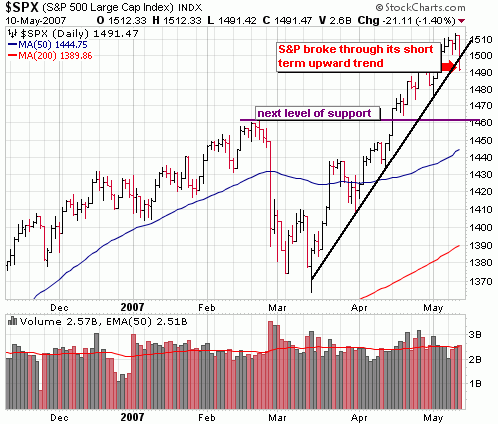
From a technical standpoint, we certainly saw a change of character today.  Over the past several weeks, early (sometimes fairly intense selling) was rendered meaningless by the end of the day as buyers came in on every dip.  It almost felt like you could throw technical analysis out the window.  However, that kind of action can’t be sustained and the selling that should have taken place much sooner kicked in today after several consecutive days of waning buy volume.  The market was ready for selling, it just needed a catalyst.  Looking at support and volume levels, it wasn’t an ugly day but the selling was enough to indicate that further deterioration is highly likely.  Both the Nasdaq and S&P took out their short term upward trend lines (the Nasdaq with heavy volume).  Next levels of support to keep an eye on are Dow 13,000, S&P 1460 and Nasdaq 2500 – 2525.

You see the Nasdaq broke its short term trend line with heavy volume.  The next area of support is around previous highs around 2525 but given the downward momentum of today’s move, it’s likely to break through that level as well.  A drop to around 2500 is probably more likely.
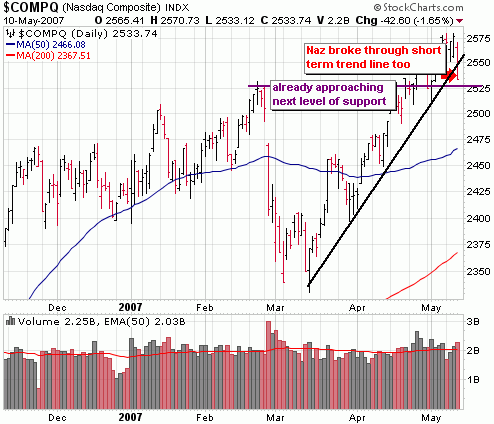
nasdaq breaks trendline

The chart of the Dow illustrates how overbought it was and how far it has to go just to get to the first level of support at the short term trend line – another 200 point or so.  I think it’s a given that it will at least test this level although notice the sell volume wasn’t particularly intense today.  In my opinion, another day like today would provide a great point to get into a few long positions (i’ve been largely in cash in the last couple weeks)
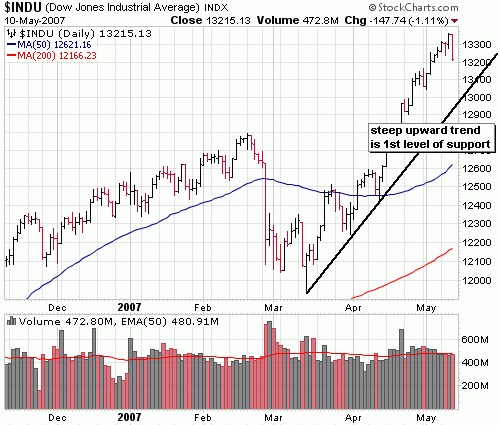
dow above  trend line
The S&P broke a trend line of its own today, but volume levels didn’t indicate that institutions were dumping stocks.  That doesn’t mean we’re not headed lower though.  With the market closing near the lows of the day and short term support taken out, we probably have another 20 – 30 point to go in the S&P before I’ll get excited on the long side again.
s&p breaks trend line

::: Major Indices Performance – The Numbers :::

(Note: volume averages are based on the average over the past 50 days)
Data as of 4:00EST – End of Day May 10th 2007

Distribution across all indices today.

Nasdaq: DOWN 1.65% today with volume 8% ABOVE  average
Nasdaq ETF (QQQQ) DOWN 1.37%, volume 52% ABOVE average
Dow: DOWN 1.11%, volume 2% BELOW the average
Dow ETF (DIA): DOWN .80%, volume 36% ABOVE the average
S&P ETF (SPY): DOWN 1.05%, volume 33% ABOVE the average
Russell Small Cap ETF (IWM): DOWN  1.31%, volume 51% ABOVE the average

::: SelflInvestors Leading Stocks :::

The Self Investors Leading Stocks Index is comprised of stocks in the Breakout Tracker, which is a database of the fastest growing companies near a breakout or having already broken out of a base.  Leading stocks got hit fairly hard today but the selling volume wasn’t particularly intense.

Summary:

* Decliners led Advancers 372 to 50
* Advancers were up an average of 1.46% today, with volume 60% ABOVE average
* Decliners were down an average of 2.29% with volume 8% ABOVE average
* The total SI Leading Stocks Index was DOWN  1.84% today with volume 14% ABOVE the average

::: Where’s the Money Flowing :::

Many investing websites provide leading industries based on price performance alone. However, without accompanying volume levels, this can sometimes be misleading.  The only way that I know of to gauge industry/sector strength WITH volume levels is through the analysis of ETF’s.  A couple years ago this was not possible, but as more traders/investors use ETF’s they become a much better tool for gauging the health of the market and seeing where the money is flowing (or not flowing).  Using the proprietary SelfInvestors Demand Indicator score which measures price and volume movements, I’m able to quickly see which sectors/industries are seeing the greatest inflows of cash.  For a detailed look at how I go about gauging sector/industry strength please see the following post: http://selfinvestors.com/si/industry_tracking/

* Current Leading Sectors/Industries (over last 30 trading days): 
Semiconductors, Internet, Networking, Biotech, Pharma
                                               
* Current Lagging Sectors/Industries (over last 30 trading days): 
Internet Infrastructure, Oil

* Today’s Market Moving Industries/Sectors (UP):
None

* Today’s Market Moving Industries/Sectors (DOWN):
Biotech, Gold Miners, Homebuilders, Internet, Gold

::: Stocks :::

The stocks section will be an area where I highlight one stock selected from a group of stocks moving up with volume well above average and most likely breaking out of a base or consolidation.  Believe it or not, there was one shining star on the long side today – a big breakout in Force Protection (FRPT).  I’ve been discussing it in the live trading room recently and will do a case study on how I traded it for a big profit very soon.

ABOUT:  Force Protection, Inc. designs, manufactures and markets blast and ballistics armored vehicles for sale to military customers. The Company’s specialty vehicles are protected against landmines, hostile fire and improvised explosive devices referred to as roadside bombs. Force Protection, Inc. produces three blast-protected vehicles: the Buffalo series, the Cougar series and the Cheetah series. The Company’s facility, located 10 miles from the Charleston Air Force Base in Ladson, South Carolina, is on a 260-acre campus consisting of three manufacturing buildings with a combined floor area of approximately 452,240 square feet and an additional 90,000 square feet. Force Protection, Inc.’s primary customer is the United States Department of Defense, where it services two principal services, the United States Army and the United States Marine Corps. On December 15, 2006, the Company entered into a joint venture agreement with General Dynamics Land Systems Inc.

FUNDAMENTALS: Force Protection (FRPT) is a company that was bleeding red ink for many years (through 2005), but increasing demand for its V shaped, IED protection, combat vehicles have sent sales skyrocketing.  So much so that the company is maxing out production capabilities and having to partner with the larger General Dynamics in order to meet demand.  By posting their first profitable year, last year was a breakout year for the company.  Earnings per share shot up from a loss of .40/share in ’05 to a profit of .13/share in ’06.  That kind of growth is expected to continue through ’07 with an expected earnings per share of .81.  It’s no wonder the stock has shot up more than 700% in the last year!  Net margins are solid at around 9% and should continue to improve with manufacturing efficiencies and greater pricing power.  Return on equity has shot up as well over the past couple years and stands at around 17%.

TECHNICAL:  FRPT broke out of a base today with heavy volume to a new all time high.  That kind of action is always bullish, but given the tremendous run-up it’s had already and the current state of the overall market, I would be hesitant to initiate a position at these levels.  Put the stock in your watch list and wait for a pullback to the 24 – 25 range.  That would offer a much lower risk entry.

SELFINVESTORS RATING: With a total score of 50/60 (26/30 for fundamentals, 24/30 for technical), Force Protection (FRPT) is a very good breakout candidate.. just a bit too extended at this time.

***********
Want to easily discover these opportunities before they breakout?  Get yourself a premium membership to SelfInvestors.com.  You can still get all the tracking features for the low introductory price of $19.95 (Silver Membership)

If you’re currently a Bronze member, upgrade your membership today!
If you don’t have an account at SelfInvestors.com, see all the available membership options.
***********

Full Disclosure/Disclaimer: The stock of the day is by no means a buy recommendation.  Please do your own research and make a personal decision based on your own tolerance for risk.  I currently do not own a position in Force Protection (FRPT).
Joost Gets Sequoia, CBS, Viacom Funding; Unleashes Beta Invites

joost funding invitesI’ve written about Joost before because I thought it was a compelling application that may one day change the way we watch TV. .. oh and as a beta tester had a few invites to give out as well.  Now Joost is allowing all beta testers to invite an unlimited number of friends, so if there is anyone still left out there without an invite who wanted one just comment on this post and I’ll set you up (as long as there aren’t 100’s!). 

Joost, founded just a year and a half ago by former Skype and Kazaa founders Janus Friis and Niklas Zennstrom, appears to be on the verge of a full public launch within just a few weeks. Today, they announced a round of investments from the likes of Index Ventures, Sequoia Capital, CBS and Viacom.  Said Friis “This funding represents a tremendous vote of confidence in Joosts platform. Weve carefully selected these investors from a variety of interested parties, as they are best-in-class in their respective arenas and bring unique assets to Joost that will enable us to significantly accelerate growth and development of the Company.

GigaOm offers up some interesting insight into the relationships between the investors and founders.  You might remember that Sequoia was an early investor in Google and YouTube.  With Viacom suing Google over YouTube and simultaneously investing in another free video application that aims to better control copyrighted content, the internet tv industry is really getting interesting. 

Despite the excitement over Joost and today’s announcement of funding from some prominent players, it’s not without problems.  I haven’t had a chance to use it all that much but it seems half the time I do logon, the network is unavailable.  Some critics have argued that the P2P architecture won’t provide the necessary quality.  An abundance of top quality content (which they don’t yet have) won’t matter a darn bit if the network isn’t up 99.9% of the time with high quality video.  All in all, Joost is an exciting application with impressive resources behind it, but they have a long way to go before people will be compelled to watch television programming on their monitor.  Perhaps once beta testing is over and if prime time programming from Viacom is released, my opinion will change.  For now, there are a million other things I’d rather be doing than watching Joost.

TrioTech (TRT) to the Moon; Beauty of a Breakout in Watson (WW)

Today’s Growth Stock Big Earnings Movers: 

UP

• TrioTech International (TRT) Semiconductor Equipment & Materials, fundamental rank [25/30],  up 27%, recently highlighted in the last stock industry report and bursting to new all time highs today

• Perini Corp (PCR) Heavy Construction, fundamental rank [24/30],  up 9%, adding to gains following February breakout

• Watson Wyatt Worldwide (WW) Business & Management Services, fundamental rank [22/30],  up 5%, beautiful breakout today

DOWN

• Omrix BioPharmaceuticals (OMRI) Biotech, fundamental rank [26/30],  down 7%, continuing to break down below 50 day moving average; most likely headed to 200 day moving average

• Digene (DIGE), Diagnostic Substances, fundamental rank [25/30],  down 5%, working on carving out a new base

• LCA-Vision (LCAV) Medical Practitioners, fundamental rank [24/30],  down 4%, working on large handle of large base

:::::::::::::::::::::::::::::::::::::: Billboard :::::::::::::::::::::::::::::::

Did you get your new insurance quote? If not, we now have some cheap insurance quotes with extra financial facilities. Now you can approve your home loans application and also apply for a capital one card. So now you can get and avail extra credit limit and settle your monthly payments as well. In fact, if you apply for a discover card then you can get good reward points on every shopping trip!