With the launch of the new site here at SelfInvestors.com came some new features and membership options, including the option to join me in a private live trading room via Worden’s Telechart service. One thing I’m going to try and do more often is case studies of actual trades that I discuss with Platinum members in the live trading room. For those new to trading stocks, many of the nuances of trading can be best understood through specific examples. The best way to do this is with video and one day I’ll get that software figured out so I can start posting live video of actual trades. Until then, I resort to the old fashioned way.
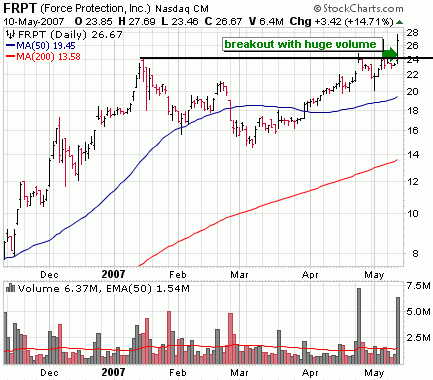
 Today I wanted to highlight a successful day trade in Force Protection (FRPT) (yes, I will highlight some trades that don’t work out too!).. well, actually it was meant to be a 2 day swing trade but I decided to dump the stock given the big run up and the overall market weakness. I’d much rather lock in a big gain and wait patiently for a pull back to the break out point for another low risk entry. Force Protection (FRPT) is a stock that has been in my watchlist for some time and I had a real time alert set on it at 24.50 so I’d be alerted to any breakout move, which it got today:

Although the stock was near the top of the SelfInvestors Breakout Tracker and in my Telechart watch list, I had forgotten about it. I was reminded of it a couple days ago by one of my members and thought that given the recent moves in Armour Holdings (AH) and Spartan Motors (SPAR), it was probably just a matter of time before it broke to a new all time high. Yesterday morning, while reading through the alerts at Fly On the Wall, I noticed an alert on FRPT indicating the following:
Unterberg highlights a story in Army Times that says the Army is expected to ask for $9B to purchase 9K MRAPs in FY08 and additional money to purchase 8.7K in FY09. CEUT believes this provides excellent visibility for FRPT through 2009 and they expect shares to trade higher. :theflyonthewall.com
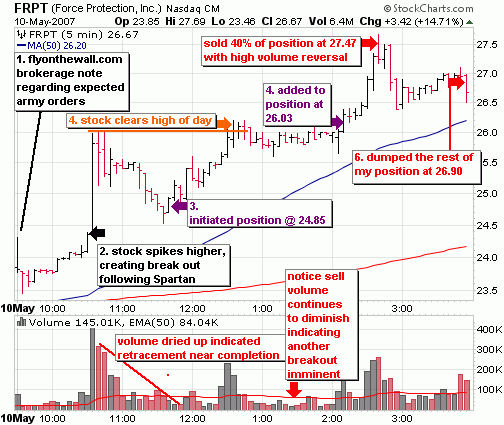
I thought that the Army Times story could move the stock so I double checked to make sure the alert was set up correctly in Telechart and went about my business. It was about an hour later that the stock really began to move, surging about 10% in 5 minutes… but not on the Army Times story. News was released that Spartan Motors (SPAR) received a large contract, a portion of it from FRPT. That indicates business is booming for both companies and got ’em movin. That triggered my alert, so I added the ticker to my brokerage real time watchlist/order screen and pulled up the real time 5 minute intraday chart of Force Protection (FRPT) in Telechart to prepare for a trade. I NEVER chase a move like the one in FRPT at around 10:45AM EST. Almost always the stock will digest the gain and retrace much of the move (sometimes all of the move, as was the case here). Now is a good time to take a look at the 5 minute intraday chart to better explain how I played it.

You’ll see the 2nd point on the graph highlighting the initial surge and breakout. From there, I was just looking for a decent entry and given the overbought market, I wasn’t about to chase anything. The entry had to be perfect and that perfect opportunity arose. One thing to remember is that intraday charts move just as they would on a daily. That means that there are support/resistance levels and price/volume levels indicating shifting demand. Just as I would on a daily chart, if I missed the initial break, then I wait for a light volume retracement. This can be anywhere from 30% to 100% of the move. The key to knowing when the retracement has completed is the dry up in selling volume and a subsequent shift to increasing buying demand. Notice it continues to subside as the entire initial surge is retraced all the way to 24.50. Now I’m looking for an entry. Since sell volume has diminished and the entire move was retraced, I initiate my first position at 24.85 which is a low risk entry with support around 24.50 (which is where I’ll set a new alert). Now I’m just holding looking for a breakout above the highs of the day around 26 (also set an alert here). If the stock can clear the highs of the day with volume, I’m going to initiate another smaller position. It does clear 26, but given the market weakness today I was fairly certain that the stock wasn’t going to clear that level and never look back. So I waited for a convincing break and pull back. Instead, it just kind of meandered sideways for an hour and a half as volume continued to diminish. This kind of volume action usually indicates that a breakout move is imminent (most often in the direction of the preceding move). I could have just watched the stock but had other things to do, so set another alert at 26.10. It too trigged and buy volume picked up on the breakout from a cup with handle formation (yes, they can form on intraday charts too!) I added to my position on a breakout from that formation at 26.03. It didn’t take long for the stock to really move after clearing this resistance and I was sitting on some hefty profits. However, with general market weakness and an overextended stock I wasn’t about to get greedy and hold on for more. I made the decision to dump 40% of the position at 27.47 after seeing the higher volume reversal at about 2:40PM EST. The plan was to ride out the other 60% into the close because sometimes a stock can really see an acceleration of its gains in the final minutes of trading. However, with a rapidly deteriorating market it wasn’t meant to be, so I unloaded the rest of the position at 26.90 with just a few minutes left in the trading day.
To sum it up, I believe it pays to be flexible. Sure mechanical rules are OK to some degree in order to keep the emotions out of trading particularly when starting out, but a multitude of trading conditions call for a multitude of strategies. Had we been at the beginning of a bull market and FRPT not already run up over 700% in the last year I probably would have held the position for a few months rather than for a quick one day gain. It’s OK to be a buy and hold investor, a swing trader and/or day trader all at the same time depending on the circumstances
::::::::::::::
For the funds that you don’t use for trading you’re probably best served by keeping them in an internet bank. CDs are always a good option and internet banks tend to have the best CD rates. Something else to keep in mind is that there are often good banking deals that these banks will run to try to get your business. You can often get a $50-$100 sign up bonuses at a lot of quality banks.
FRPT was actually a double bottom with an original buy area in late April. The shake out week last week created the next pivot which was cleared this week on the break out you mentioned. The earnings & revenue explosion are very nice as well as the low fund ownership make it interesting longer term.
Pleadership, it’s a great point you bring up. I’ve discussed many times about how stocks offer multiple buy points and the purchase point I discuss in this article was the 2nd opportunity to get it. As you point out, the first entry could have been on the breakout from the double bottom (albeit an unsymmetrical one) base. Thanks for pointing that out. It’s important and I should have included it in the annotated daily chart.