Without solid earnings reports and daily M&A activity to temper the less then desirable flow of economic data, the bulls were, for the first time in several weeks, unable to stem the flow of selling pressure late in the day. The tone was bearish early as April same store sales came in much lower than expected. Sales were expected to be weak due to unusually cold weather and higher oil prices, but not at the lowest levels since this data began being tracked. Add to that higher import prices and a widening trade deficit and it’s no wonder that traders scrambled to lock in profits in this overbought, over hyped market.
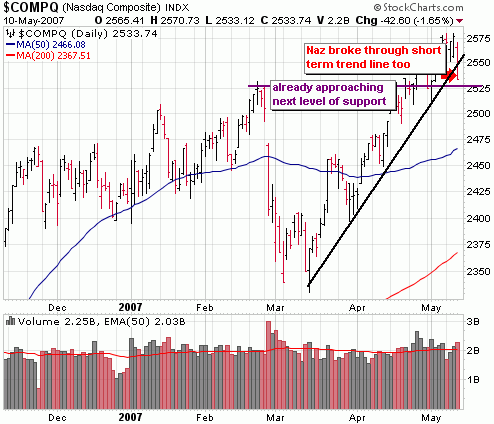
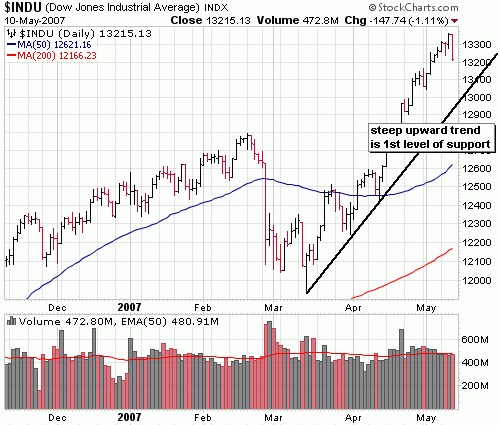
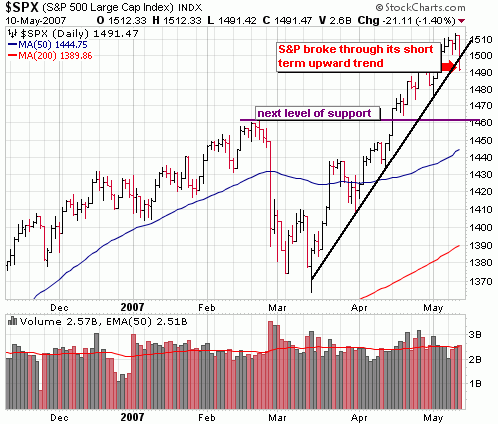
From a technical standpoint, we certainly saw a change of character today. Over the past several weeks, early (sometimes fairly intense selling) was rendered meaningless by the end of the day as buyers came in on every dip. It almost felt like you could throw technical analysis out the window. However, that kind of action can’t be sustained and the selling that should have taken place much sooner kicked in today after several consecutive days of waning buy volume. The market was ready for selling, it just needed a catalyst. Looking at support and volume levels, it wasn’t an ugly day but the selling was enough to indicate that further deterioration is highly likely. Both the Nasdaq and S&P took out their short term upward trend lines (the Nasdaq with heavy volume). Next levels of support to keep an eye on are Dow 13,000, S&P 1460 and Nasdaq 2500 – 2525.
You see the Nasdaq broke its short term trend line with heavy volume. The next area of support is around previous highs around 2525 but given the downward momentum of today’s move, it’s likely to break through that level as well. A drop to around 2500 is probably more likely.

The chart of the Dow illustrates how overbought it was and how far it has to go just to get to the first level of support at the short term trend line – another 200 point or so. I think it’s a given that it will at least test this level although notice the sell volume wasn’t particularly intense today. In my opinion, another day like today would provide a great point to get into a few long positions (i’ve been largely in cash in the last couple weeks)

The S&P broke a trend line of its own today, but volume levels didn’t indicate that institutions were dumping stocks. That doesn’t mean we’re not headed lower though. With the market closing near the lows of the day and short term support taken out, we probably have another 20 – 30 point to go in the S&P before I’ll get excited on the long side again.

::: Major Indices Performance – The Numbers :::
(Note: volume averages are based on the average over the past 50 days)
Data as of 4:00EST – End of Day May 10th 2007
Distribution across all indices today.
Nasdaq: DOWN 1.65% today with volume 8% ABOVE average
Nasdaq ETF (QQQQ) DOWN 1.37%, volume 52% ABOVE average
Dow: DOWN 1.11%, volume 2% BELOW the average
Dow ETF (DIA): DOWN .80%, volume 36% ABOVE the average
S&P ETF (SPY): DOWN 1.05%, volume 33% ABOVE the average
Russell Small Cap ETF (IWM): DOWN 1.31%, volume 51% ABOVE the average
::: SelflInvestors Leading Stocks :::
The Self Investors Leading Stocks Index is comprised of stocks in the Breakout Tracker, which is a database of the fastest growing companies near a breakout or having already broken out of a base. Leading stocks got hit fairly hard today but the selling volume wasn’t particularly intense.
Summary:
* Decliners led Advancers 372 to 50
* Advancers were up an average of 1.46% today, with volume 60% ABOVE average
* Decliners were down an average of 2.29% with volume 8% ABOVE average
* The total SI Leading Stocks Index was DOWN 1.84% today with volume 14% ABOVE the average
::: Where’s the Money Flowing :::
Many investing websites provide leading industries based on price performance alone. However, without accompanying volume levels, this can sometimes be misleading. The only way that I know of to gauge industry/sector strength WITH volume levels is through the analysis of ETF’s. A couple years ago this was not possible, but as more traders/investors use ETF’s they become a much better tool for gauging the health of the market and seeing where the money is flowing (or not flowing). Using the proprietary SelfInvestors Demand Indicator score which measures price and volume movements, I’m able to quickly see which sectors/industries are seeing the greatest inflows of cash. For a detailed look at how I go about gauging sector/industry strength please see the following post: http://selfinvestors.com/si/industry_tracking/
* Current Leading Sectors/Industries (over last 30 trading days):
Semiconductors, Internet, Networking, Biotech, Pharma
* Current Lagging Sectors/Industries (over last 30 trading days):
Internet Infrastructure, Oil
* Today’s Market Moving Industries/Sectors (UP):
None
* Today’s Market Moving Industries/Sectors (DOWN):
Biotech, Gold Miners, Homebuilders, Internet, Gold
::: Stocks :::
The stocks section will be an area where I highlight one stock selected from a group of stocks moving up with volume well above average and most likely breaking out of a base or consolidation. Believe it or not, there was one shining star on the long side today – a big breakout in Force Protection (FRPT). I’ve been discussing it in the live trading room recently and will do a case study on how I traded it for a big profit very soon.
ABOUT: Force Protection, Inc. designs, manufactures and markets blast and ballistics armored vehicles for sale to military customers. The Company’s specialty vehicles are protected against landmines, hostile fire and improvised explosive devices referred to as roadside bombs. Force Protection, Inc. produces three blast-protected vehicles: the Buffalo series, the Cougar series and the Cheetah series. The Company’s facility, located 10 miles from the Charleston Air Force Base in Ladson, South Carolina, is on a 260-acre campus consisting of three manufacturing buildings with a combined floor area of approximately 452,240 square feet and an additional 90,000 square feet. Force Protection, Inc.’s primary customer is the United States Department of Defense, where it services two principal services, the United States Army and the United States Marine Corps. On December 15, 2006, the Company entered into a joint venture agreement with General Dynamics Land Systems Inc.
FUNDAMENTALS: Force Protection (FRPT) is a company that was bleeding red ink for many years (through 2005), but increasing demand for its V shaped, IED protection, combat vehicles have sent sales skyrocketing. So much so that the company is maxing out production capabilities and having to partner with the larger General Dynamics in order to meet demand. By posting their first profitable year, last year was a breakout year for the company. Earnings per share shot up from a loss of .40/share in ’05 to a profit of .13/share in ’06. That kind of growth is expected to continue through ’07 with an expected earnings per share of .81. It’s no wonder the stock has shot up more than 700% in the last year! Net margins are solid at around 9% and should continue to improve with manufacturing efficiencies and greater pricing power. Return on equity has shot up as well over the past couple years and stands at around 17%.
TECHNICAL: FRPT broke out of a base today with heavy volume to a new all time high. That kind of action is always bullish, but given the tremendous run-up it’s had already and the current state of the overall market, I would be hesitant to initiate a position at these levels. Put the stock in your watch list and wait for a pullback to the 24 – 25 range. That would offer a much lower risk entry.
SELFINVESTORS RATING: With a total score of 50/60 (26/30 for fundamentals, 24/30 for technical), Force Protection (FRPT) is a very good breakout candidate.. just a bit too extended at this time.
***********
Want to easily discover these opportunities before they breakout? Get yourself a premium membership to SelfInvestors.com. You can still get all the tracking features for the low introductory price of $19.95 (Silver Membership)
If you’re currently a Bronze member, upgrade your membership today!
If you don’t have an account at SelfInvestors.com, see all the available membership options.
***********
Full Disclosure/Disclaimer: The stock of the day is by no means a buy recommendation. Please do your own research and make a personal decision based on your own tolerance for risk. I currently do not own a position in Force Protection (FRPT).