All posts by Tate Dwinnell

A Classic “Sell the News” Result to Fed Rate Cut; Stock of Day – Synchronoss Technologies (SNCR)

Today’s somewhat dramatic sell off should not have been too much of a surprise (ok I suppose the small chance of a 50 bp would have produced a different result) so I hope EVERYONE profited accordingly.  The market sells off with heavy volume, rises to overbought conditions (more than I expected) with diminishing buy volume as the market prices in the 25 bp cut and sells off on the news and sells BIG.  In a divergence from most of the action of 2007, the market actually moved in the direction it was forecasting for once.  It does feel good to be positioned correctly and profit in a down day like this doesn’t it?

So now what?  Well .. we wait.  Remember that the first reaction to a Fed announcement is often times a false move, so it’s going to take a day or two for the Fed rate cut dust to settle and get a true sense of the technical picture. 

::: Major Indices Performance – The Numbers :::

(Note: volume averages are based on the average over the past 50 days)
Data as of 4:00EST – End of Day December 11th 2007

Nasdaq: DOWN 2.45% today with volume 1% ABOVE average
Nasdaq ETF (QQQQ) DOWN 2.32%, volume 3% BELOW average
Dow: DOWN 2.14%, with volume 14% ABOVE the average
Dow ETF (DIA): DOWN 2.18%, with volume 32% ABOVE the average
S&P ETF (SPY): DOWN 2.74%,  with volume 23% ABOVE the average
Russell Small Cap ETF (IWM): DOWN 3.51%, with volume 37% ABOVE the average

::: SelflInvestors Leading Stocks :::

The Self Investors Leading Stocks Index is comprised of stocks in the Breakout Tracker, which is a database of the fastest growing companies near a breakout or having already broken out of a base.  Leading stocks were hit harder than the major indices today but not as hard as the small caps that make up the Russell 2000.  If there is a bright spot today, it’s that volume wasn’t overwhelming on the sell side.
Summary:

* Decliners led Advancers 278 to 30
* Advancers were up an average of 1.56% today, with volume 62% ABOVE average
* Decliners were down an average of 3.51% with volume at the average
* The total SI Leading Stocks Index was DOWN 3.02% today with volume 6% ABOVE average

::: Where’s the Money Flowing :::

Many investing websites provide leading industries based on price performance alone. However, without accompanying volume levels, this can sometimes be misleading.  The only way that I know of to gauge industry/sector strength WITH volume levels is through the analysis of ETF’s.  A couple years ago this was not possible, but as more traders/investors use ETF’s they become a much better tool for gauging the health of the market and seeing where the money is flowing (or not flowing).  Using the proprietary SelfInvestors Demand Indicator score which measures price and volume movements, I’m able to quickly see which sectors/industries are seeing the greatest inflows of cash.  For a detailed look at how I go about gauging sector/industry strength please see the following post: http://selfinvestors.com/si/industry_tracking/

* Current Leading Sectors/Industries (over last 30 trading days):  
Dynamic Utilities, Pharma, Commodities, Energy, Basic Materials, Agriculture
                                          
* Current Lagging Sectors/Industries (over last 30 trading days): 
Networking, Retail, Semis, Nuclear Energy, Telecom

* Today’s Market Moving Industries/Sectors (UP):
Bonds & Telecom

* Today’s Market Moving Industries/Sectors (DOWN):
Home Construction, Realty, Financials

::: Stocks :::

The stocks section will be an area where I highlight one stock selected from a group of stocks moving up with volume well above average and most likely breaking out of a base or consolidation.  Despite a day where few leading stocks rose with volume, Synchronoss Technologies (SNCR) surged above its 50 day moving average with volume and is today’s Stock of the Day.

ABOUT: 

Synchronoss Technologies, Inc. (Synchronoss) is a provider of on-demand, multi-channel transaction management solutions to communications service providers (CSPs). The Company has designed its solution to be flexible across communication services and channels (such as e-commerce, CSP stores and other retail outlets), allowing it to meet the changing and converging services offered by CSPs. Synchronoss targets complex and high-growth markets, including wireless, high-speed access (such as cable, digital subscriber line (DSL) and Wi-Max), voice over Internet protocol (VoIP), video and also target CSPG’s bundling of these services (double, triple and quadruple plays) and their intersection (video over wireless, Internet protocol television (IPTV), content activation). The Company’s ActivationNow platform automates, synchronizes and simplifies electronic order management, activation and provisioning of these services.

FUNDAMENTALS: 

Synchronoss (SNCR) is a company that grew rapidly at the beginning of the 21st century but didn’t turn it’s first profitable year until 2005 when it earned .31/share.  The company hit a brief rough patch in the middle of ’06 when it posted 2 consecutive quarters of negative growth.  However, over the past year, the company has begun firing on all cylinders and has posted accelerating earnings and sales growth in each of the past 4 quarters.  That kind of growth has led to ’07 estimates of more than a doubling of profits over ’06.  With net margins around 20%, ROE around 20% and management ownership hovering around 35%, SNCR has ALL of the components of a Self Investors leading company.

TECHNICAL:  

I typically feature leading stocks that are near a breakout or have already broken out of a sound basing pattern, but SNCR is a bit early in the formation process.  The stock spent most of October and November digesting gains after a long runup in which the stock soared more than 500% in just over a year.  A remarkable run.  This is the first significant base for the stock since going public in the summer of 2006, so there is quite a bit of room left to run.  Currently, it’s carving out a cup base with the bottom of the base finding support right at the 200 day moving average.  Sell volume has begun to dry up and buyers are beginning to exert some control again.  Today, it was up more than 10% at one point before it sold off after the Fed rate cut, leading to a high volume reversal on the daily chart.  This kind of action typically indicates the stock will need to at the very least spend some time sideways and at worst retest the lows of the base.  Either way, you want to see the stock carve out a nice looking handle formation with quiet volume, then result in a big breakout above today’s high (42.58).  It’s probably at least a week or two away from attempting a breakout, but SNCR is without a doubt one leading stock you’ll want to put at the top of your watch list.
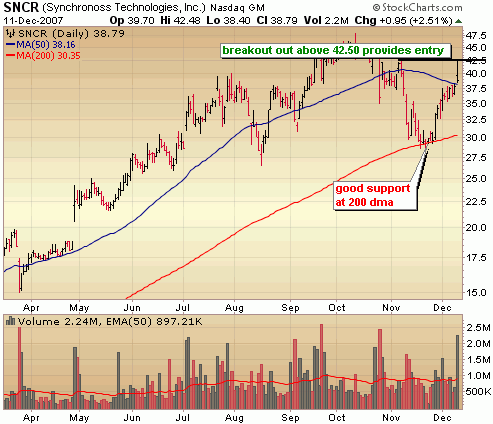
SELFINVESTORS RATING: With a total score of 51/60 (27/30 for fundamentals, 24/30 for technical), Synchronoss (SNCR) is a highly rated Self Investors leading stock.

Full Disclosure/Disclaimer: The stock of the day is by no means a buy recommendation.  Please do your own research and make a personal decision based on your own tolerance for risk.  I currently do not own a position in Synchronoss Technologies (SNCR)

Best IPO’s Trading This Week – Xinyuan Real Estate (XIN), VanceInfo (VIT) & More

1.  Xinyuan Real Estate  (XIN): develops large-scale residential projects in China, which include multiple-building housing communities, high-rise apartment complexes, retail outlets, health and leisure facilities, and schools. Xinyuan’s development sites are primarily acquired through public auctions of government land. In addition to constructing these properties, Xinyuan Real Estate offers property management services. It currently has operations in the Sichuan, Anhui, Shandong, Jiangsu, and Henan provinces, covering more than 770,000 sq. meters Trading set to begin on Wednesday.

2.  VanceInfo Technologies (VIT):  helping companies in China advance through outsourcing. Typically serving clients with operations in China (but headquartered elsewhere) VanceInfo Technologies provides outsourced software development and IT services consisting of research and development, enterprise solutions development, application development and maintenance, quality assurance and testing, as well as globalization and localization services. Customers include companies in industries such as technology, telecommunications, financial services, and manufacturing. Major clients include Citibank, IBM, Microsoft, Motorola, and TIBCO.   Trading set to begin on Wednesday.

3.  CGEN Digital Media Company (ADTV):  helps advertisers get their messages to consumers who not only are ready to buy, but already have gone to the store to do so. The company operates an in-store TV advertising network that spans more than 530 retail locations — including hypermarkets and home improvement centers — in about 65 cities in China. CGEN Digital Media makes most of its money from selling network time to more than 250 advertisers, including global consumer brands Nestlé, Kraft, Crest, Johnson & Johnson, and Asahi Beer. It also earns a portion of its revenues from organizing in-store promotional events for retailers and advertisers. In 2007 the company agreed to be acquired by rival Focus Media.  ** Note:  CGEN was acquired by Focus Media (FMCN) yesterday.

4. ChinaEdu Corp (CEDU):  The Company’s primary business is to provide services to the online degree programs of Chinese universities. Its services for online degree programs include academic program development, technology services, enrollment marketing, student support services and finance operations. ChinaEdu also operates private primary and secondary schools, market and support international post-secondary and English language curriculum programs to established learning institutions, and offer online interactive tutoring services to primary and secondary school students. It has relationships with 11 universities, nine of which are under long-term, exclusive contracts that vary from 15 to 50 years in length. Nine of these universities operate online degree programs.  Began trading today at 10.00/share.

5.  K12 Inc (LRN):  The "virtual public school" company offers online educational programs for children in kindergarten through 12th grade (K-12). Products include full-time online public schools (in about a dozen states), course material and product sales directly to parents, and individualized supplemental programs offered through traditional public schools. K12’s programs are targeted at kids who underperform in public school, aren’t safe in public school, or can’t attend public school because of travel issues, disabilities, or because they are athletes or performers.  Trading set to begin on Friday.

6.  Classmates.com (CLAS):  company operates the Mypoints online loyalty marketing service in addition to its popular social networking Web site Classmates.com. Classmates.com helps users locate and communicate with acquaintances from school, work, and the military through a network of more than 50 million registered users. The company’s 2.7 million subscribers pay for access to various tools and content. Advertising on the Web site supplements the company’s subscription fees. Classmates Media also provides targeted marketing services for advertisers looking to reach more than 8 million consumers registered in its MyPoints rewards program.  Trading set to begin on Thursday.

7.  Teekay Tankers (TNK):  owns and manages a fleet of nine double-hull Aframax tankers, which it charters to such customers as ConocoPhillips, Eiger Shipping, SABIC, and Skaugen PetroTrans for use in seaborne transportation of crude oil. Teekay Tankers’ fleet has an overall capacity of about two million deadweight tons (DWT). Wholly owned by Teekay Corporation, a large global operator of medium-sized oil tankers, Teekay Tankers generates revenue by selling both voyage charters (single short-term trips at a variable rate) and time charters (often longer-term and generally fixed-rate).  Trading set to begin on Thursday.

8.  MedAssets (MDAS):  MedAssets helps hospitals widen their profit margins — or at least not lose quite as much. The company’s Spend Management segment operates a group purchasing organization that negotiates prices for hospitals and health systems which then get better deals on medical supplies and devices. Its Revenue Cycle Management segment provides software and consulting services that help track and analyze a hospital’s revenue stream. Such services aim to increase collections and reduce account balances. It counts more than 125 health systems as customers, including Christiana Care, Banner Health, and Fletcher Allen.  Trading set to begin Thursday.

Offshore Crude Oil Exploration & Production Perspective

ABOUT:  The following Oil & Gas Industry report is provided by guest author Robert Williams, PhD, P.E., and industry executive with over 40 years experience working for major oil corporations as well as smaller companies all across the globe.  Robert has extensive petroleum, water and electrical industries experience regarding Supervisory Control and Data Acquisition (SCADA) systems, Management Information Systems (MIS/IT), Distributed Control Systems fire & gas/emergency shutdown systems, instrumentation, metering, communications, security/CCTV and electrical engineering on such major projects as Shell Bonga FPSO, Saudi Strategic Storage Project, Libyan Water Pipeline, Trans Alaska crude oil pipeline, Alaska Natural Gas Transportation System, Occidental Piper B and Saltire offshore platforms and many other worldwide projects. 

::::::::::::::::::::::::::::::::::::::::::

Oil & Gas Industry Perspective Part II (Offshore)
by Robert Williams, PhD, P.E.
See Part I – Oil & Gas Engineering

The major oil supplier areas of the world are Middle East (specifically Saudi Arabia), West/North Africa, Russia, Venezuela, Mexico, Indonesia and including the North American suppliers and consumers, USA and Canada. Major oil consumers are USA/Canada, Europe, Japan, China, India/S.E. Asia and Australia/New Zealand.

The crude oil process of converting to automobile gasoline involves finding the oil or gas by seismic surveys, drilling and extracting, producing and transporting crude oil. Crude oil may be refined at the supplier’s origin country and the petroleum products exported or the crude oil is transported for refining in the consumer country. Natural gas is pipelined to consumers otherwise it has to be transported as liquefied natural gas (LNG) tankers.

Oil and gas industry capital expenditures include exploration permits from national governments, seismic surveys, either buying or leasing drilling rigs, onshore/offshore processing facilities, crude oil/products pipelines and/or tankers including loading and offloading port facilities, crude oil/products storage terminals, fuel truck loading racks and gasoline stations.

These industry perspectives are designed to identify companies actively involved in all of the oil/gas industry aspects and specifically highlight those for potential investment on a long or mid-term basis. There are many companies who are industry leaders and there are others that have established a niche in these industries Their charts will be provided to identify possible long trades. No speculation will be made as to short or options trades in these companies. The first Industry Perspective highlighted oil/gas engineering companies whereas this Industry Perspective will focus on offshore crude oil exploration and production.

Finding and producing oil and natural gas deposits, converting these into petroleum products and transporting them to market makes the oil/gas industry the most international of all industries. Many offshore production and supplier companies are exchange listed in London, Oslo, Amsterdam or other exchanges, including Australia. These companies have not been identified in this Industry Perspective No. 2. Please contact author at riwilliams1@cox.net if you have international trading access and wish to know more about these companies.

Industry Perspectives

1. Maintained high crude oil prices are initiating new and old exploration fields to be developed. For example, Chile has just announced exploration and production contracts for new onshore development fields.

2. Driven by increased demand in China and India, Asia is now the largest consumer of oil products.

3. The production of oil and gas reserves is increasingly moving to remote, challenging locations, such as Russia’s Sakhalin Island, offshore West Africa (Angola, Nigeria, etc.), and Canadian arctic and deep or ultra deep offshore locations including the Gulf of Mexico.

4. A major oil company has made a new oil discovery in the ultra-deep offshore West African coast in water depths of approximately 6000 feet. Ultra-deep is an industry term which especially applies to the Gulf of Mexico where oil exploration and new discoveries are at depths of up to10,000 feet.

5. Anadarko Petroleum (APC) has made an oil discovery at its West Tonga prospect in the deepwater Gulf of Mexico. The discovery well, located in approximately 4,700 feet of water, was drilled to a total depth of 25,680 feet. The well was drilled by Diamond Offshore’s (DO) semi-submersible, Ocean Valiant. (Source: Rigzone 12/05/2007)

6. Chevron and Massachusetts Institute of Technology announced an energy research program to develop remote, ultra-deepwater exploration and production technology. The $5 million Chevron Remote and Ultra-Deepwater Research Program will focus on developing the technologies required to access hydrocarbons in water depths up to 10,000 feet in a safe, cost effective and environmentally friendly manner. (Source: Rigzone Newsletter)

7. Mexico’s national oil company (Pemex) has only nine years of proven oil reserves at current production rates, and the company is hoping to find new deposits in deeper waters of the Gulf to compensate for declining output at its traditional areas. Pemex plans to begin producing oil at deep water projects in 2014.

8. China’s electricity consumption has exceeded planned expectations to the extent that is affects reliability, i.e. shortages and many parts of China have electricity rationing programs. World Bank projections are for a doubling of energy consumption from 2000 to 2020. China are building a semi-submersible capable of deep and ultra-deep drilling for their offshore fields which is part of their long range planning to alleviate their dependence on imported crude oil.

shell oil rig9. The Shell Bonga field, offshore Nigeria, required a complex and extensive subsea system to extract the crude oil from 3000 feet deep water. Production facilities comprise one of the world’s largest Floating Production, Storage and Offloading vessels (FPSO) and deepwater subsea infrastructure.  Author was onboard the Bonga during topsides assembly, prior to sailing to Nigeria, and can wholeheartedly verify its size. An FPSO is effectively a 2 million barrel stationary tanker with an offshore production platform on its deck.
10. Bonga subsea well clusters were drilled and completed from a mobile drilling unit and connected to the centrally located FPSO by production flowlines, risers and control umbilicals. The project’s estimated recoverable resources add up to more than 600 million barrels of oil. Production began in November 2005 and the current production is 225,000 barrels of oil and 150 million standard cubic feet of gas per day. Crude oil is offloaded onto tankers and gas is pipelined to onshore facilities. Field development costs were approximately $3.5 billion and the initial exploration contract was agreed in 1993. Source: Royal Dutch Shell (RDS)

11. An umbilical is an assembly of hydraulic hoses which can also include electrical and/or fiber optic cables used to control subsea structures from a platform or a surface vessel. A Riser is a pipe or assembly of pipes used to transfer produced fluids from the seabed to the surface facilities or to transfer injection fluids, control fluids or lift gas from the surface facilities to the seabed.

12. Offshore fixed platforms have been the norm for continental shelf oil/gas drilling and production; tension leg platforms are used to 3,000 feet water depths and floating production facilities are used for deeper waters. A Tension Leg Platform is a floating production unit anchored to the seabed by taut vertical cables, which considerably restrict its heave motion, making it possible to have the wellheads on the platform.

13. A semi-submersible is a floating drilling vessel that is supported primarily on large pontoon-like structures submerged below the sea surface. The operating decks are elevated above the pontoons on large steel columns. This design minimizes loading from waves and wind. Semi-submersibles can operate in a wide range of water depths, including deep water. They are usually anchored with six to twelve anchors tethered by strong chains and wire cables, which are computer controlled to maintain the semi submersible at the programmed location.

14. In ultra deepwater, riser systems become a technical challenge and a major part of the field development costs. Large external pressures in these great depths cause flexible solutions to run into weight and cost problems.

Major Oil/Gas Companies

Exxon Mobil Corporation (XOM); BP (BP)  Chevron Corp. (CVX); Conoco Phillips (COP); Occidental Petroleum Corporation (OXY); Marathon Oil Corporation (MRO); Anadarko Petroleum Corporation (APC) are some of the international oil and gas companies involved in the exploration and production of crude oil and natural gas; the manufacture of petroleum products, and the transportation and sale of crude oil, natural gas and petroleum products. APC is a oil and gas exploration and production company whose major areas of operations are located in the United States, the deepwater of the Gulf of Mexico and Algeria. Anadarko also has production in China, Venezuela and Qatar, a development project in Brazil and is executing exploration programs in several other countries.

Independent Oil/Gas Companies

Apache Corp. (APA); Devon Energy Corporation (DYN); Murphy Oil Corporation (MUR) are independent energy companies that explore for, develop and produce natural gas, crude oil and natural gas liquids. APA’s exploration and production interests are focused in the Gulf of Mexico, the Gulf Coast, East Texas, the Permian Basin, the Anadarko Basin and the Western Sedimentary Basin of Canada. It has interests in onshore Egypt, offshore Western Australia, offshore the United Kingdom in the North Sea (North Sea), and onshore Argentina. DYN owns oil and gas properties principally in the United States and Canada and, to a lesser degree, regions located outside North America, including Azerbaijan, Brazil and China. Murphy’s exploration and production include the United States, Canada, the United Kingdom, Ecuador, Malaysia and all other countries.

Oil/Gas Offshore Services Companies

Transocean Inc. (RIG) is an international provider of offshore contract drilling services for oil and gas wells. RIG owns or operates 89 mobile offshore and barge drilling units. Its fleet included 32 high-specification semi-submersibles and drill-ships, 20 other floaters, 25 jack-ups and four other rigs as of February 2, 2007. RIG’s primary business is to contract these drilling rigs, related equipment and work crews primarily on a dayrate basis to drill oil and gas wells.

Diamond Offshore Drilling, Inc. (DO) provides contract drilling services to the energy industry worldwide and is also engaged in deepwater drilling with a fleet of 44 offshore drilling rigs. The Company’s fleet consists of 30 semi-submersibles, 13 jack-ups and one drill-ship. The Company offers a range of services worldwide in various markets, including the deep water, harsh environment, conventional semi-submersible and jack-up markets. The Company provides offshore drilling services to a customer base that includes independent oil and gas companies and government-owned oil companies.

Schlumberger Limited (SLB) is an oilfield services company supplying a range of technology services and solutions to the international oil and gas industry. SLB subsidiary WesternGeco is an advanced surface seismic company. SLB’s products and services include the evaluation and development of oil reservoirs (controlled digging, pumping and testing services), well construction and production consulting, and sale of software programs. The Company also offers storage tank and seismic monitoring services.

Halliburton Company (HAL) provides a variety of services, products, maintenance, engineering and construction to energy, industrial, and governmental customers. Its six business segments are: Production Optimization, Fluid Systems, Drilling and Formation Evaluation, Digital and Consulting Solutions, Energy and Chemicals, and Government and Infrastructure. It refers to the combination of Production Optimization, Fluid Systems, Drilling and Formation Evaluation, and Digital and Consulting Solutions segments as its Energy Services Group (ESG).

Flowserve Corporation (FLS) is a manufacturer and aftermarket service provider of flow control systems. The Company develops and manufactures precision-engineered flow control equipment, such as pumps, valves and seals, for critical service applications. It produces industrial pumps, industrial valves, control valves, nuclear valves, valve actuators and precision mechanical seals, and provides a range of related flow management services worldwide, primarily for the process industries.

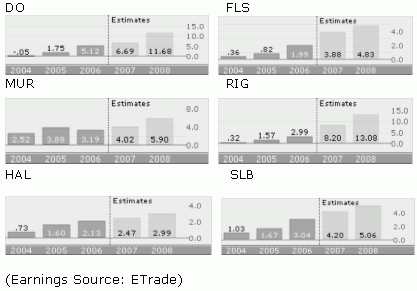
Some companies involved with deep sea oil/gas developments have significant earnings projections.

Summary

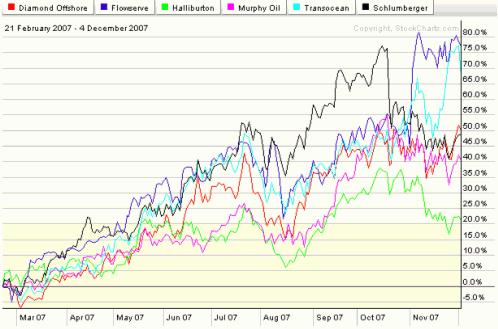
The oil/gas companies combined performance charts (see chart) indicates a general uptrend and are all indicating increasing earnings. Please note that recent markets declines do affect these companies’ stock pricing but may very well provide excellent entry points depending on your market timing criteria.

The world is continuously expanding both crude oil consumption and development of new crude oil sources. See the next Industry Perspective for oil/gas projections to 2030.

——

If you have questions or comments for Robert regarding this report or the oil industry, you may submit them here at the blog using the comments form or click "Contact" above to submit and I will forward those on.

Disclaimer:  The author Rober Williams, currently has no positions in the companies above.  I do have a long position in Transocean (RIG).

Don’t Be Greedy

I’m gonna keep this short and sweet.  Don’t be greedy, it’s just that easy.  The market sustained significant technical damage during the latter half of October and the first few weeks of November.  Consider the 7% retracement of that sell off over just the past 2 weeks a gift, offering a 2nd chance to lighten the load on the long side.  Bull markets die hard and offer multiple chances to get out with big profits in the bag.  I’m not saying this is a bear market just yet, but the roles have been reversed and the onus is now on the bulls to prove themselves.  Until then, I’m treating this is as a bear market in the making and the action over the past couple weeks as just a tradeable rally, nothing more.  Buy volume is waning, key resistance levels loom and the bulls are pinning their hopes on another Fed rate cut to save the day.  Perhaps the Fed cuts by 50 basis points, Jim Cramer emphatically declares  Dow 14,500 by the end of the year and we rally several hundred points.  I would have no problem missing that move knowing that I’ve already recovered all losses from the Oct/Nov sell off and if I don’t make another cent in December, had a  great year in a difficult market.  At this point, my portfolio is neutral with a sizable cash position but am watching closely to move more cash to the short side.

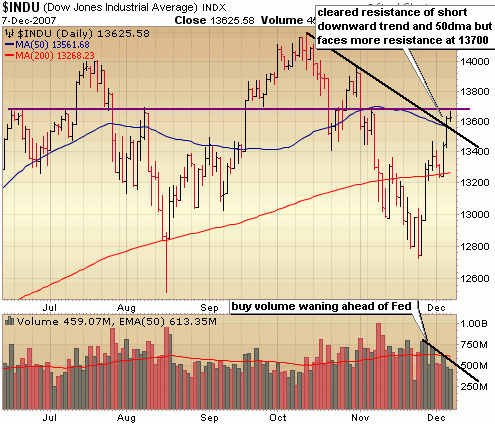
The Dow has cleared some very important resistance of the short downward trend and the 50 day moving average but faces another significant obstacle at resistance around 13700.  Notice the declining buy volume as traders await the Fed decision Tuesday.  If the Dow can clear 137000 with big volume I might be willing to get in the bullish camp a bit, but until then there is reason for skepticism.

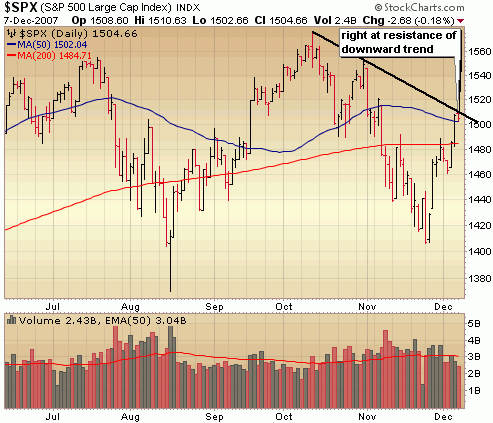
The S&P has just edged up above that 50 day moving average but is right at resistance of the downward trend and has little momentum at its back.  This time around, it may take a heck of a lot more than a Fed rate cut to get above resistance with any oomph.

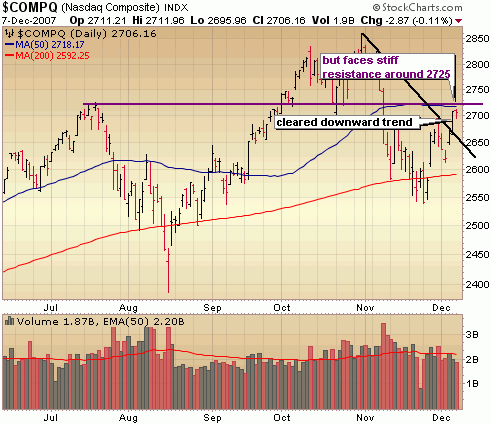
Like the Dow, the Nasdaq has cleared a downward trend but still faces stiff resistance around 2725.  Holding above this downward trend, then surging above 2725 with volume would be big for the bulls and could signal another lengthy rally.

 ::: Model Portfolio :::

** This section will now appear as a separate report to be published on Wednesdays.

Would you like to receive buy and sell alerts within minutes of each transaction of the Model Portfolio?  You can receive these along with ALL of the tracking tools and reports with the very popular Gold membership.  Don’t delay, get started today and join me for many more highly profitable months here at SelfInvestors.com.

::: Best/Worst Performers :::

– Top 10 Performing Industries For the Week –

1. Residential Construction: 14.40%
2. Auto Parts Stores: 10.70
3. Trucking: 8.50%
4. Heavy Construction: 8.00%
5. Copper: 7.60%
6. Electronic Stores: 7.50%
7. Trucks & Other Vehicles:  7.35%
8. Technical Services: 7.10%
9. Agricultural Chemicals: 6.90%
10. Recreational Vehicles: 6.70%

– Top 10 Worst Performing Industries For the Week –

1. Business Equipment: -8.90%
2. Publishing – Books: -2.80%
3. Credit Services: -2.30%
4. CATV Systems: -2.20%
5. Textile Manufacturing: -1.90%
6. Biotechnology: -1.80%
7. Textile – Apparel Clothing: -1.40%
8. Specialty Eateries: -1.15%
9. Rental & Leasing Services: -1.05%
10. Marketing Services: -1.00%

– Top 5 Best Performing ETFs For the Week –
 
1. Ishares Home Construction (ITB) 10.80%
2. iPath India (INP)
9.30
3. Turkish Invest Fund (TKF) 9.25%
4. 
Morgan Stanley India (IIF) 9.15%
5. Greater China Fund (GCH) 9.15%

– Worst 5 Performing ETF’s –

1. HLDRS Biotech (BBH) -4.50%
2. Ishares Lehman 20+ Treasury (TLT) -2.80%
3. US Natural Gas (UNG)  -2.60%
4. ING Global Equity Dividend (IGD) -2.10%

5. Ishares Lehman 7-10 Yr Treasury (IEF)  -1.40%

:::  IPO’s Worth Watching for This Week :::

This section will now appear as a separate report on Mondays.

::: Upcoming Economic Reports (12/3/07 – 12/7/07) :::

Monday:         Pending Home Sales
Tuesday:       Fed Rate Decision, Wholesale Inventories
Wednesday: Export/Import Prices, Trade Balance, Treasury Budget, Crude Inventories
Thursday:      Retail Sales, PPI, Initial Claims, Business Inventories
Friday:            CPI, Industrial Production, Capacity Utilization

::: Upcoming Notable Earnings Reports :::

None this week.

::: In Case You Missed It – SelfInvestors Blog Entries of the Past Week :::

1. Sucker Rally or Climbing to the Peak of the Wall of Worry; Hot IPO – WSP Holdings (WH)

2. Indices Approach Key Resistance As Buy Volume Wanes

3. Home Builders Close to Bottom; Top Plays NVR and Toll Bros (TOL)

Home Builders Close to Bottom; Top Plays NVR and Toll Bros (TOL)

Have home builders bottomed? That’s the million dollar question and a question that has popped up frequently recently following a two week 20 – 30% surge in shares of home builders.  I’ll tip toe half way out the limb and say yes and no.  When I’m looking for a bottom in anything, whether it be an entire sector or individual stock I’m looking at several key criteria:

FUNDAMENTALS

1. Is There a Rally On Bad News?

When a true bottom has been put in, more bad news doesn’t move the stock because it’s already been priced in.  Traders begin to trade on relief rather than fear.  It becomes, "oh, that wasn’t nearly as bad as we thought it would be".  Case in point was the Toll Brothers (TOL) earnings report this morning. 

Toll Brothers reported the first quarterly loss in 21 years (if you include the write down of 315 million) and the CEO responds by saying “fiscal 2007 was the most challenging of the 40 years that Toll Brothers has been in business” but the stock rallied more than 15% today as the company whooped analyst expectations of a .77/share loss (which typically don’t include write downs) by posting a .72/share profit (excluding the write downs).

At the top, analysts increasingly high expectations make it difficult for the company to beat leading to a sell off.  At the bottom, increasingly lowered expectations creates a situation where a stock rallies on any glimmer of hope.

2.  Insider Begin Buying

Nobody knows their company better than the guys at the top, unless of course you’re Kenneth Lay and you don’t know anything.  When insiders feel their company is a great value they begin buying shares.  Insider selling can occur for a variety of reasons so it’s difficult to place much importance on it, but insider buying particularly in large companies can often indicate a bottom in the stock price. 

Case in point, NVR Inc (NVR) CEO Dwight Schar.  He recently picked up 50 million worth of shares in his company. That’s still less then what he paid for his home in 2005,  which at the time was the most expensive house in US history (Revlon founder Ron Perleman’s home), but 50 million isn’t the kind of bet you make in your company if you feel your shares are going much lower. Not a bad investment. He’s up over 25% on the position in just one month.

At KB Homes (KBH) two VP’s dabbled a bit and picked up about $93K worth of their company stock in late October/early November.

TECHNICALS

3.  Capitulation in Stock Chart

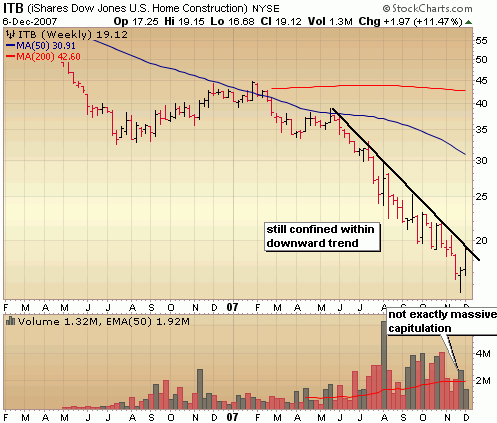
Not all bottoms will show capitulation but it’s certainly another clue that I look for.  It’s characterized by a day or full week in which the stock closes in the upper half of a long range with volume well above average.  I haven’t seen this kind of action in the home builder stocks yet, so it’s certainly possible that we retest the lows again with one last bout of big panic selling, followed by a stampede of buyers. 

4.  Broken Downward Trend  in Stock Chart

The best of breed home builders (see below) broke out of shorter term downward trends today but still face tough resistance.  Let’s have a look.

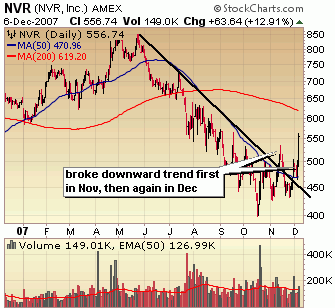
NVR Inc (NVR) is my top home builder play because it’s technically the strongest and fundamentally the ONLY home builder to remain profitable every quarter through the housing meltdown.  It was the first to break  a downward trend back in November and busted through that resistance again in December.  Like all home builders, it’s currently overbought in the short term but if I’m a long term buyer I’m looking to add shares between 450 – 500.  I"ll have a more detailed technical analysis below

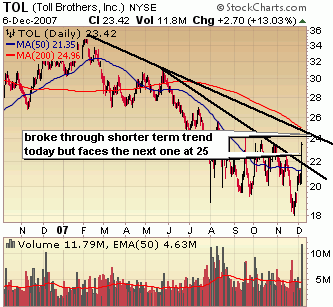
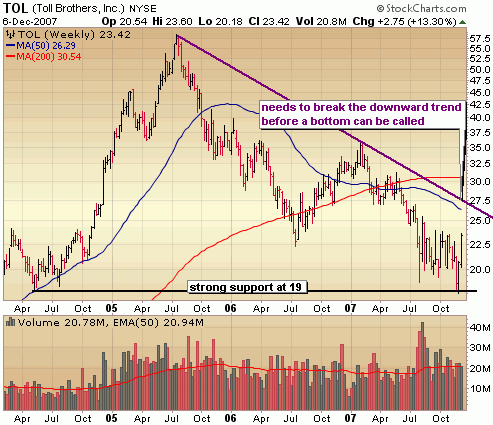
Toll Brothers (TOL) broke through its downward trend line today but doesn’t have far to go before testing the longer term trend line.  It’s up nearly 30% in the past couple weeks so I would not be chasing it.  I won’t be looking to add shares until it pulls back to 20 or lower.  I rank TOL #2 right behind NVR and will highlight the technicals in more depth below.

I don’t feature the charts of DR Horton (DHI) and Centex (CTX) in this report, but they also broke out of downward trends today but are too extended in the short term.

The Bottom Line

The home builders have surged 20 – 30% in recent days on news of the government subprime freeze and anticipation of another Fed rate cut, resulting in a breakout above shorter term downward trend lines in the best of breed home builders.  Technically, they are overbought in the short term, but there is some room to run to the upside, perhaps another 10 – 15%.  The best opportunities will come on light volume pull backs from current levels.  While there are some indications that a long term bottom is close, we’re not out of the woods just yet and the likelihood is very high that we’ll retest the lows of the home builders (anywhere from 20 – 30% below current levels), particularly if the bankruptcy of a major home builder such as Beazer Homes (BZH) becomes more likely.  If I were a long term buy and holder (which I’m not), this is an area I’d begin significantly accumulating shares of the best of breed home builders such as NVR Inc (NVR) and Toll Brothers (TOL).  Remember the stock price precedes a turn in the fundamentals.  That is, well before the home builders turn it around financially, a bottom will have been put in place.

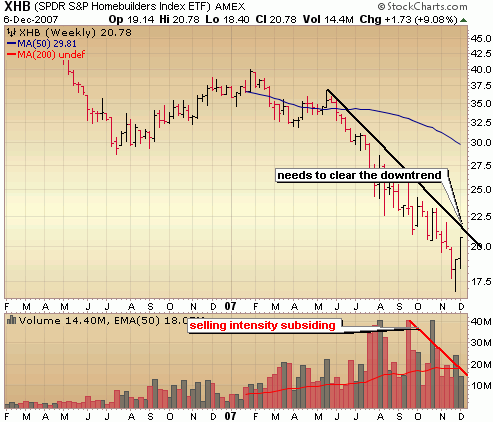
As another indication that the home builders aren’t out of the woods just yet, both the SPDR Homebuilders ETF (XHB) and the Ishares Home Construction ETF (ITB) have not cleared downward trends.

Best of Breed

Based on a combination of fundamentals and technicals I’ve come up with a Top 6 list of best of breed home builders:

1.  NVR Inc (NVR): 

It takes the top spot because of the big CEO insider buying, best technicals and the fact that the company has remained profitable in every quarter during this housing crash and is expected to remain so.  CEO Dwight Schar has also been through a meltdown before, nearly bankrupting NVR several years ago.  I’m sure he’s smart enough to learn from those mistakes.  The second time around, Schar avoided the risky land investments and went with an approach called optioning where the builder makes a small down payment for the option of purchasing the plot of land in the future.  Only when the contract is signed on the sale does NVR purchase the land and build the home.  It’s a common practice among home builders now, but apparently NVR has done a better job of not over purchasing land.
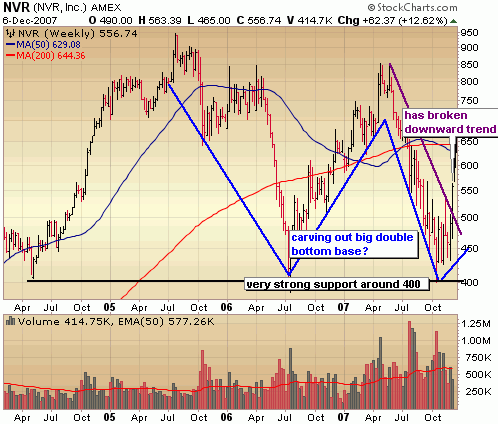
The chart below provides a look at a longer term weekly chart to get a better sense of where it’s been and where it might be going.   A few things stand out to me.  One being the big support at level at 400, an area it has bounced from not only recently but in the summer in 2006 as well as summer of 2004.  If I can get shares around 400, you can be sure I’ll be buying, but quite frankly I don’t think NVR sees those levels again.  Depending on what the overall market is doing, what the housing market is doing and the individual action in NVR I’d be looking at shares in the 450 – 500 range.  Note the potential double bottom base outlined in blue?  If in fact this is a valid double bottom base, 400 is the bottom and we can expect a run to 850 – 950 within the next year.

2. Toll Brothers (TOL)

Like NVR, TOL recently tested an important level of support at 19 (a level it found support at back in 2004 as well) and bounced.  Yes, there is some room to run to the upside but I wouldn’t be chasing it.  Once the euphoria of the subprime rate freeze and looming Fed rate cuts wears off, home builders should pull back and offer a much better entry.  Just how much is anyone’s guess, but keep an eye on on resistance above from the long downward trend line (in blue) and support at the bottom around 19.  Price should continue to get squeezed between those two points over the next several weeks creating a big triangle formation.  This will be the moment of truth for TOL.  A break up out  this formation indicates the likelihood of a long term bottom while a break down below 19 indicates further deterioration ahead, possibly to the next level of support around 16. 
Best of the Rest……

3. DR Horton (DHI)
4. Centex (CTX)
5.  Ryland Group (RYL)
6. KB Homes (KBH)

That concludes my initial report on a potential home builder bottom.  What I plan to do is provide an update report every month for the next 6 months, so stay tuned!

Disclaimer: I currently hold no positions in any of the individual home builder stocks mentioned above or the two ETF’s.

Indices Approach Key Resistance As Buy Volume Wanes

After two days of very orderly selling with light selling volume the bull looked ready to charge again with ferocity.  The set up was there and the bull charged but it was a half hearted, tired attempt at resistance levels of the major indices.  How could I make a statement like that on a day the Dow rose nearly 200 points with volume higher than the day before (technically accumulation)?  Volume continues to wane as we get closer to key resistance levels.  I want to see massive buying before I’m convinced the market has hit a longer term bottom rather than a short term pause point in a bear market.  I’m not there yet.

The market continues to focus on the positive news as it brushed aside the Fannie Mae dividend cut and cheered the ADP employment report as well as increased productivity and factory orders.  The market is also pricing in some kind of a Fed cut and imminent news of some government meddling into the subprime mess.  Fortunately the meddling won’t be sweeping according to the New York Times:

"The agreement, to be formally announced Thursday by President Bush, is expected to contain numerous limitations that would exclude many — if not most — subprime borrowers, according to industry executives who have seen it. It would exclude those who are delinquent on their payments — about 22 percent of all subprime borrowers, according to First American LoanPerformance, an industry research firm.

The plan is also expected to exclude any borrower whose introductory rate expires before Jan. 1. About $57 billion in subprime loans are scheduled to be reset at higher rates in the final three months of this year, according to estimates by First American LoanPerformance."

What happens when the Fed finally concedes it can’t continue cutting rates at this pace?  Then what are we left with?  As a technical trader I try not to focus on those things but rather focus on what’s in front of me.  What buyers and sellers are telling me.  Today’s move certainly sets us up for further strength into the open tomorrow but lets remember that the indices have just a bit of breathing room left before hitting very strong resistance levels and buy volume continues to subside.  With a glance at the action in leading stocks recently, I continue to see more volume on the sell side than on the buy side AND Pharma and Bonds are showing up as leading sectors right now.  Not exactly the stuff bull markets are made of is it?  If you’ve recovered much of your losses from the Oct/Nov sell off, you might want to consider locking in some of those gains soon.

Resistance in the Indices:
Nasdaq: 2725
S&P500: 1490 – 1500
Dow: 13500 – 13600
Russell 2000: 800

::: Major Indices Performance – The Numbers :::

(Note: volume averages are based on the average over the past 50 days)
Data as of 4:00EST – End of Day December 5th 2007

Nasdaq: UP 1.78% today with volume right at the average
Nasdaq ETF (QQQQ) UP 1.78%, volume 18% BELOW average
Dow: UP 1.48%, with volume 1% BELOW the average
Dow ETF (DIA): UP 1.53%, with volume 23% BELOW the average
S&P ETF (SPY): UP 1.67%,  with volume 15% BELOW the average
Russell Small Cap ETF (IWM): UP 1.92%, with volume 20% BELOW the average

::: SelflInvestors Leading Stocks :::

The Self Investors Leading Stocks Index is comprised of stocks in the Breakout Tracker, which is a database of the fastest growing companies near a breakout or having already broken out of a base.  Leading stocks were about in line with what the major indices did today, but notice the volume behind rising stocks versus declining stocks.  This has been the trend of late and is a bit of a red flag.

Summary:

* Advancers led Decliners 247 to 60
* Advancers were up an average of 2.55% today, with volume 4% BELOW average
* Decliners were down an average of 1.64% with volume 57% ABOVE average
* The total SI Leading Stocks Index was UP 1.73% today with volume 8% ABOVE average

::: Where’s the Money Flowing :::

Many investing websites provide leading industries based on price performance alone. However, without accompanying volume levels, this can sometimes be misleading.  The only way that I know of to gauge industry/sector strength WITH volume levels is through the analysis of ETF’s.  A couple years ago this was not possible, but as more traders/investors use ETF’s they become a much better tool for gauging the health of the market and seeing where the money is flowing (or not flowing).  Using the proprietary SelfInvestors Demand Indicator score which measures price and volume movements, I’m able to quickly see which sectors/industries are seeing the greatest inflows of cash.  For a detailed look at how I go about gauging sector/industry strength please see the following post: http://selfinvestors.com/si/industry_tracking/

* Current Leading Sectors/Industries (over last 30 trading days):  
Pharma, Bonds, Utilities
                                          
* Current Lagging Sectors/Industries (over last 30 trading days): 
Semis, Networking, Retail, Telecom

* Today’s Market Moving Industries/Sectors (UP):
REITs, Real Estate, Broadband, Networking, Energy

* Today’s Market Moving Industries/Sectors (DOWN):
Biotech, Oil, Commodities

::: Stocks :::

The stocks section will be an area where I highlight one stock selected from a group of stocks moving up with volume well above average and most likely breaking out of a base or consolidation.  The leading stocks that moved significantly with volume today are too extended past a proper entry point to highlight for Stock of the Day, but you might want to take a look at the list of movers for trading ideas.  Stocks are listed in order of best Total Rank (fundamentals + technicals) 

Chicago Mercantile (CME)
Vimpel Communications (VIP)
Millicom International Cellular (MICC)
Airgas (ARG)
AsiaInfo Holdings (ASIA)
Vocus (VOCS)
Versant (VSNT)
AeroVironment (AVAV)
VistaPrint (VPRT)
Darling International (DAR)
Harsco (HSC)
Rick’s Cabaret (RICK)
General Dynamics (GD)

Sucker Rally or Climbing to the Peak of the Wall of Worry; Hot IPO – WSP Holdings (WH)

The much anticipated oversold bounce came in with a fury as oversold bounces often do and it didn’t take much to ignite the bulls as more of the mortgage mess became priced in.  On Tuesday, news of a 1.4B Wells Fargo write down and Freddie cutting its dividend in half and raising 6B in capital failed to send the markets into a tailspin on Wednesday morning, which set the market up for a bull stampede.    The bulls may have been reaching a bit, but they found a glimmer of hope in comments made from Fed Vice Chairman Kohn who reiterated concerns about economic uncertainty saying ""These uncertainties require flexible and pragmatic policy-making .. ". The sentiment was echoed by Bernanke the following day, further cementing hopes of another rate cut at the Fed December 11th meeting.

So is this just a short lived suckers rally or something more?  Is this the beginning of another major leg up as the market climbs a monumental wall of worry?  By Investor Business Daily standards, the action on Wednesday was enough to confirm a new rally but this should not be a green light to get overly aggressive on the long side.  What is critical in my mind is how we digest the gains of last week.  A light sell volume pull back would go a long way in lending validity to this market surge and provide opportunity to slowly add long exposure.  As I mentioned in my after market report on Wednesday, the magnitude of the rise last week into key resistance levels has allowed for a decent area to put on a few short positions as a hedge, but I think the next two weeks will be critical in determining where this market is headed over the longer haul.  The government bail out plan is expected to be revealed soon and the Fed has indicated they are remaining vigilant and not afraid to take further action. 

Don’t fight the Fed (or this administration) certainly continues to be at play in this market.  It’s just more of the same.  Subprime and economic uncertainty tempered by government intervention and what will probably be a flood of overseas investment in US assets should keep the markets gyrating for many more months to come.  It still pays to be cautious and sitting on a decent sized pile of cash at this point.

::: Model Portfolio :::

Despite a tumultuous Oct/Nov in the market, the SelfInvestors Model Portfolio is getting back close to highs of the year with a 3.1% rise for the week, bringing the year to date gain to 27%.   Oversold conditions and a resulting bounce got me into a few high quality long positions in leading companies which resulted in gains of 7%, 8% and 9% but the magnitude of the bounce ran the indices right smack into key resistance levels, so I hedged the portfolio with a few short positions towards the end of the week.  With the volatility and uncertain market, I will continue to keep the portfolio sitting on a sizable cash position of around 50% (it’s currently at 46%) as well as hedge with short positions.  It’s a strategy that has worked extremely well in 2007 and I don’t anticipate deviating from it too much over the next several months.  The current allocation of the portfolio is 41% long and 13% short.

Would you like to receive buy and sell alerts within minutes of each transaction of the Model Portfolio?  You can receive these along with ALL of the tracking tools and reports with the very popular Gold membership.  Don’t delay, get started today and join me for many more highly profitable months here at SelfInvestors.com.

::: Best/Worst Performers :::

– Top 10 Performing Industries For the Week –

1. Mortgage Investment: 17.50%
2. Hospitals: 12.25%
3. Pollution & Treatment Controls: 11.60%
4. Cement: 8.90%
5. Technical & System Software: 8.50%
6. Agricultural Chemicals: 8.45%
7. Business Equipment:  8.35%
8. Building Materials Wholesale: 8.20%
9. Heavy Construction: 8.00%
10. Farm & Construction Machinery: 7.45%

– Top 10 Worst Performing Industries For the Week –

1. Jewelry Stores: -12.75%
2. Silver: -5.71%
3. Drug Stores: -2.90%
4. Housewares & Accessories: -2.20%
5. Movie Production – Theaters: -2.05%
6. Oil & Gas Refining & Marketing: -1.90%
7. Gold: -1.80%
8. Networking & Comm Devices: -1.30%
9. Oil & Gas Equipment & Services: -1.10%
10. Sporting Goods Stores: -1.05%

– Top 5 Best Performing ETFs For the Week –
 
1. PowerShares Golden Dragon (PGJ)  12.50%
2. 
Chile Fund (CH) 12.30%
3. Templeton Dragon Fund (TDF) 11.30%
4. 
India Fund (IFN) 10.30%
5. MSCI Inida (INP) 9.85%

– Worst 5 Performing ETF’s –

1. US Oil (USO) -8.90%
2. US Natural Gas (UNG)  -8.50%
3. HLDRS Oil Services (OIH) -6.00%
4. Central Fund of
Canada (CEF) -5.75%
5. Ishares Commodities (GSG) -5.65%

:::  IPO’s Worth Watching for This Week :::

1.  WSP Holdings (WH): The Chinese manufacturer, which conducts business through various subsidiaries, produces seamless casing, tubing, and drill pipes. Referred to collectively as OCTG (Oil Country Tubular Goods), its products are used by the oil industry for oil and natural gas exploration, drilling, and extraction purposes. WSP sells domestically to leading Chinese oil companies, as well as internationally, covering oilfields in North America, the Middle East, Africa, and Russia. Operating one drill pipe production line and eight threading lines, it creates approximately 572,000 tons of seamless OCTG annually. Trading set to begin on Thursday.

2.  Titan Machinery (TITN):  sells and rents new and used agricultural and construction equipment through its 33 retail locations located in North Dakota, South Dakota, Minnesota, and Iowa. Farming equipment includes excavators, seeders, tillers, and tractors; it offers such construction machinery as earthmoving equipment and cranes. Titan primarily deals in products manufactured by CNH which are sold under the Case and New Holland brands; other brands on offer include K-Tec and Grove. The company also sells parts and provides maintenance and repair services.  Trading set to begin on Wednesday.

3.  Triple S Management (GTS):  the reigning heavyweight when it comes to Puerto Rico‘s managed care. With nearly one million members, the territory’s #1 health insurance company operates under the Blue Shield name and caters to 25% of the island’s population. In addition to traditional managed care products, Triple-S offers life, accident and disability, and property and casualty insurance. Following its 2006 acquisition of Great American Life Assurance Company (GA Life), the company is also Puerto Rico‘s leading provider of life insurance policies. Triple-S’s products are sold through independent agents and brokers, as well as its internal sales team. The company was founded in 1959 by a group of doctors.  Trading set to begin on Friday.

4.  VisionChina Media (VISN):   through China Digital Mobile Television, operates an advertising network that consists of some 33,000 digital television displays located on buses in more than a dozen major Chinese cities. The displays receive mobile digital broadcasts from local TV stations of real-time content — such as news, stock quotes, weather and traffic updates, sports highlights, and public interest messages — sprinkled with paid advertisements. This location-based content and advertising reaches about 26 million consumers each day.  Trading set to begin Thursday.

::: Upcoming Economic Reports (12/3/07 – 12/7/07) :::

Monday:         ISM Index, Auto/Truck Sales
Tuesday:       None
Wednesday: Productivity (rev), Factory Orders, ISM Services, Crude Inventories
Thursday:      Initial Claims
Friday:            Nonfarm Payrolls, Unemployment Rate, Consumer Credit

::: Upcoming Notable Earnings Reports :::

Tuesday:  Versant (VSNT)

Thursday: Gildan Activewear (GIL), Verifone Holdings (PAY)

Friday:  OYO Geospace (OYOG)

::: In Case You Missed It – SelfInvestors Blog Entries of the Past Week :::

1. Contrarian Indicators Show Tradeable Rally Imminent

2. Self-Directed Portfolio Advantages/Disadvantages

3. Accumulation Day, But No Indication of Bottom Yet; Stock of Day – Danaher (DHR)

4. Bidz.com (BIDZ), Citron Research (Stocklemon.com) Soap Opera Continues

5.  Nothing More Than An Oversold Bounce?

6.  Trade of the Day – Short Setup in Sadia (SDA)

Trade of the Day – Short Setup in Sadia (SDA)

I suppose I should rename the Trade of the Day feature to Trade of the Week the way it’s been going lately.  I’ll try and post more of these, just been really busy with this crazy market of late. 

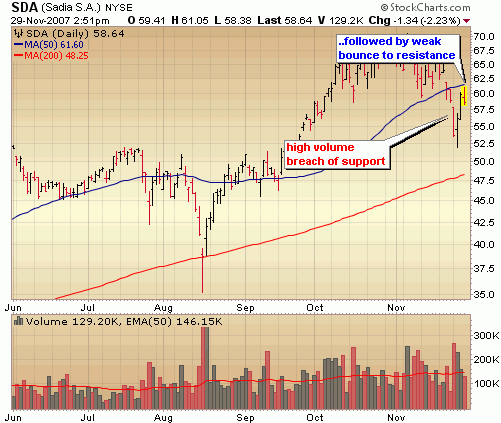
Today I thought I’d go against the grain of the past few days, perhaps to serve as a reminder that yes bears are still firmly in control and two days of big gains doesn’t change that at this point.  Today I highlight a short setup in Sadia (SDA), a Brazilian processor of food products.  This short setup is very characteristic of what I look for in most of shorts I look for – a high volume break down of support followed by a weak retest of what is new resistance, in this case the 50 day moving average.  One of the better looking shorts out there in my opinion.

Disclaimer: I do not have a position in SDA at the time of this writing.

Nothing More Than An Oversold Bounce?

Wow, talk about tradeable rally!  Like most oversold rallies they usually spring quickly and before you can blink we get a more than 500 point rally in the Dow.  So much for bottom marking capitulation or a rush to the buy button by institutions.  Now don’t get me wrong, this was a strong rally today with enough oomfff to push us up to key resistance levels, but at this point I think that’s all this is.  The oversold conditions were there, the fear was there, the panic selling was not.  We just didn’t get the kind of panic selling where everyone throws in the towel.  For a longer term bottom, that needs to happen. 

The rally today provided some great trades on the long side, but the magnitude of the rally today just gets us that much closer to key resistance levels which I’ll discuss more below.  There is really only about another 2% left to the upside before the technicals start screaming you better short this thing.  I’m going to play this market one of two ways over the next few days.  If we bolt again soon and test those resistance levels right away, you better believe I’m putting on some shorts.  If the market finds some rationality and digests these gains in a reasonable manner I’ll look to put on another long trade or two.  From a longer term perspective, keep in mind the bottoming action over the past few days was not dramatic and not does not bode well for the long side.. but hey, it’s December, bulls have regained their footing and the foundation might just be laid for a holiday rally before the bears resume control, so keep your bias to the bull side for now and begin looking for small positions in top tier stocks.  Let’s have a look at the charts:

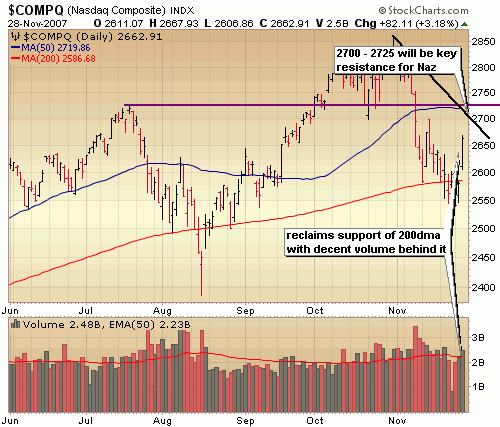
The tech heavy Nasdaq is by far the strongest index and where you should focus your long plays.  Tech typically does well at the end of the year and this year looks to be headed in that direction as well.  Volume was strong, but just not impressive for a move of this magnitude.  There was certainly quite a bit of short covering to this rally and considering we never got the all out panic selling to mark a good sustainable bottom I wouldn’t be making any bets that we’re going to be seeing 2007 highs anytime soon.  I think what this rally does is give us enough gusto to eventually kiss that downward trendline goodbye.  That’s how I’m playing it.  If the Nasdaq begins testing resistance around 2700 – 2725 I’m going to begin getting aggressively short.  Some digestion of these gains would provide a good opportunity to continue trading this rally on the long side.

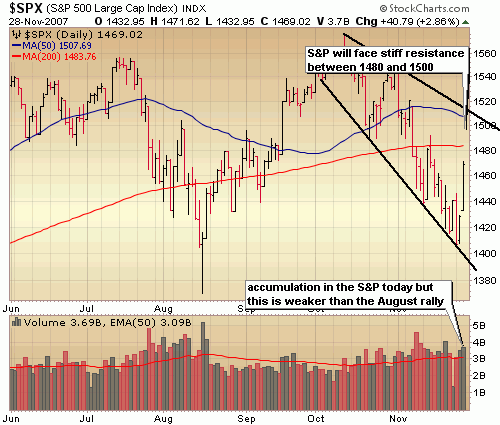
The financial heavy S&P is of course the weakest and still has some room to run before even testing that 200 day moving average, so to declare that the bull is running again would be a big mistake.  Much technical damage needs to be repaired yet.  If we don’t digest these gains in a hurry, I’m going to start getting short.  Notice that the conviction behind the rally in August dwarfs this rally.  Think we’re going to carve out another V base and shoot to new all time again?  Think again.  There will be strong resistance in the S&P between 1480 and 1500.

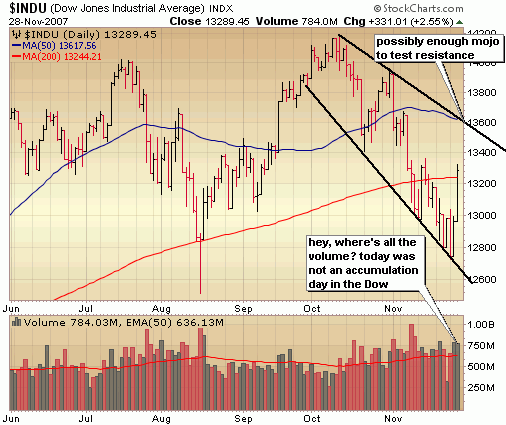
Volume in the Dow was above average but again lackluster considering the price move.  It most likely marks a temporary bottom though and any pullback from here would offer additional opportunities to put on a few long trades.  There will be considerable resistance in the 13500 – 13600 range, which would be a good area to consider short positions.

::: Major Indices Performance – The Numbers :::

(Note: volume averages are based on the average over the past 50 days)
Data as of 4:00EST – End of Day November 28th 2007

Nasdaq: UP 3.18% today with volume 12% ABOVE average
Nasdaq ETF (QQQQ) UP 3.04%, volume 30% ABOVE average
Dow: UP 2.55%, with volume 23% ABOVE the average
Dow ETF (DIA): UP 2.71%, with volume 19% ABOVE the average
S&P ETF (SPY): UP 3.2%,  with volume 29% ABOVE the average
Russell Small Cap ETF (IWM): UP 3.79%, with volume 24% ABOVE the average

::: SelflInvestors Leading Stocks :::

The Self Investors Leading Stocks Index is comprised of stocks in the Breakout Tracker, which is a database of the fastest growing companies near a breakout or having already broken out of a base.  Leading stocks performed outstanding today as small caps led the way and performed about in line with what the Russell did.  286 Self Investors Leading Stocks were up an AVERAGE of 4.19%.. now that’s what I call leadership!

Summary:

* Advancers led Decliners 286 to 17
* Advancers were up an average of 4.19% today, with volume 12% ABOVE average
* Decliners were down an average of 1.63% with volume 120% ABOVE average
* The total SI Leading Stocks Index was UP 3.87% today with volume 18% ABOVE average

::: Where’s the Money Flowing :::

Many investing websites provide leading industries based on price performance alone. However, without accompanying volume levels, this can sometimes be misleading.  The only way that I know of to gauge industry/sector strength WITH volume levels is through the analysis of ETF’s.  A couple years ago this was not possible, but as more traders/investors use ETF’s they become a much better tool for gauging the health of the market and seeing where the money is flowing (or not flowing).  Using the proprietary SelfInvestors Demand Indicator score which measures price and volume movements, I’m able to quickly see which sectors/industries are seeing the greatest inflows of cash.  For a detailed look at how I go about gauging sector/industry strength please see the following post: http://selfinvestors.com/si/industry_tracking/

* Current Leading Sectors/Industries (over last 30 trading days):  
Dynamic Utilities, Biotech, Pharma, Bonds, Health Care  (leadership in medical/healthcare emerging!)
                                          
* Current Lagging Sectors/Industries (over last 30 trading days): 
Semis, Retail, Networking, Nuclear Energy

* Today’s Market Moving Industries/Sectors (UP):
Home Construction, Regional Banks, Materials, US Real Estate, Basic Materials

* Today’s Market Moving Industries/Sectors (DOWN):
Oil, Commodities, Gold, Bonds

::: Stocks :::

The stocks section will be an area where I highlight one stock selected from a group of stocks moving up with volume well above average and most likely breaking out of a base or consolidation.  Sorry, I’m real short on time tonight so not stock of the day, but have a look at these Self Investors Leading stocks above the 50 and 200 day moving averages that moved up with big volume today.

 In order of total rank (fundamentals + technicals)

Double Take Software (DBTK)
Shanda Interactive (SNDA)
Axsys Technologies (AXYS)
Credicorp (BAP)
SunPower (SPWR)
Kirby Corp (KEX)
GFI Group (GFIG)
Dynamic Materials (BOOM)
FCStone Group (FCSX)
Interactive Intelligence (ININ)
Banco Itau (ITU)
Chicago Bridge & Iron (CBI)