Wow, talk about tradeable rally! Like most oversold rallies they usually spring quickly and before you can blink we get a more than 500 point rally in the Dow. So much for bottom marking capitulation or a rush to the buy button by institutions. Now don’t get me wrong, this was a strong rally today with enough oomfff to push us up to key resistance levels, but at this point I think that’s all this is. The oversold conditions were there, the fear was there, the panic selling was not. We just didn’t get the kind of panic selling where everyone throws in the towel. For a longer term bottom, that needs to happen.
The rally today provided some great trades on the long side, but the magnitude of the rally today just gets us that much closer to key resistance levels which I’ll discuss more below. There is really only about another 2% left to the upside before the technicals start screaming you better short this thing. I’m going to play this market one of two ways over the next few days. If we bolt again soon and test those resistance levels right away, you better believe I’m putting on some shorts. If the market finds some rationality and digests these gains in a reasonable manner I’ll look to put on another long trade or two. From a longer term perspective, keep in mind the bottoming action over the past few days was not dramatic and not does not bode well for the long side.. but hey, it’s December, bulls have regained their footing and the foundation might just be laid for a holiday rally before the bears resume control, so keep your bias to the bull side for now and begin looking for small positions in top tier stocks. Let’s have a look at the charts:
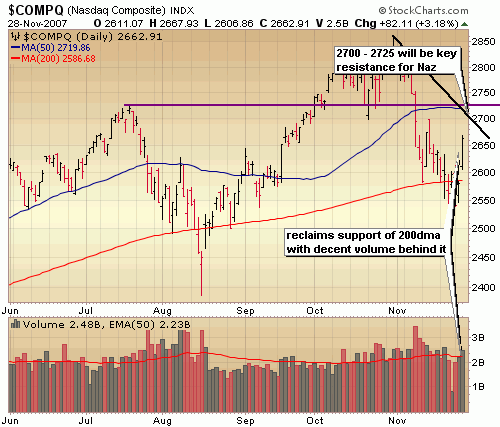
The tech heavy Nasdaq is by far the strongest index and where you should focus your long plays. Tech typically does well at the end of the year and this year looks to be headed in that direction as well. Volume was strong, but just not impressive for a move of this magnitude. There was certainly quite a bit of short covering to this rally and considering we never got the all out panic selling to mark a good sustainable bottom I wouldn’t be making any bets that we’re going to be seeing 2007 highs anytime soon. I think what this rally does is give us enough gusto to eventually kiss that downward trendline goodbye. That’s how I’m playing it. If the Nasdaq begins testing resistance around 2700 – 2725 I’m going to begin getting aggressively short. Some digestion of these gains would provide a good opportunity to continue trading this rally on the long side.

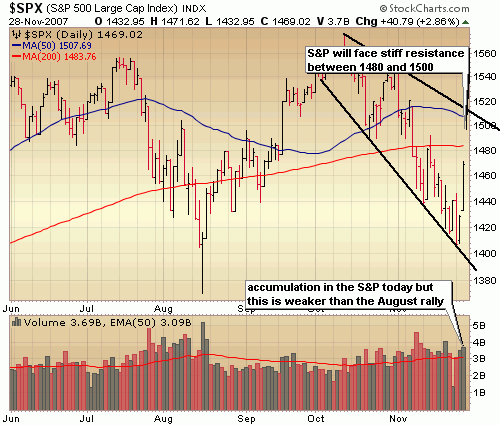
The financial heavy S&P is of course the weakest and still has some room to run before even testing that 200 day moving average, so to declare that the bull is running again would be a big mistake. Much technical damage needs to be repaired yet. If we don’t digest these gains in a hurry, I’m going to start getting short. Notice that the conviction behind the rally in August dwarfs this rally. Think we’re going to carve out another V base and shoot to new all time again? Think again. There will be strong resistance in the S&P between 1480 and 1500.

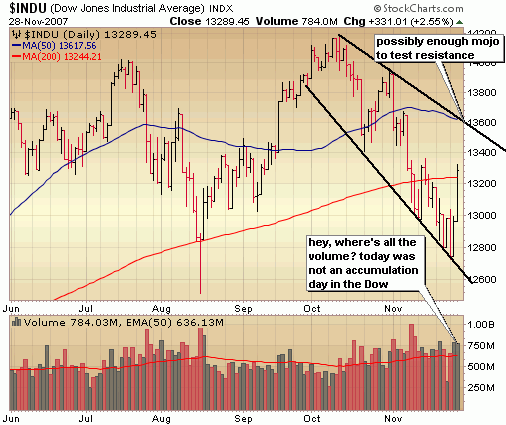
Volume in the Dow was above average but again lackluster considering the price move. It most likely marks a temporary bottom though and any pullback from here would offer additional opportunities to put on a few long trades. There will be considerable resistance in the 13500 – 13600 range, which would be a good area to consider short positions.

::: Major Indices Performance – The Numbers :::
(Note: volume averages are based on the average over the past 50 days)
Data as of 4:00EST – End of Day November 28th 2007
Nasdaq: UP 3.18% today with volume 12% ABOVE average
Nasdaq ETF (QQQQ) UP 3.04%, volume 30% ABOVE average
Dow: UP 2.55%, with volume 23% ABOVE the average
Dow ETF (DIA): UP 2.71%, with volume 19% ABOVE the average
S&P ETF (SPY): UP 3.2%, with volume 29% ABOVE the average
Russell Small Cap ETF (IWM): UP 3.79%, with volume 24% ABOVE the average
::: SelflInvestors Leading Stocks :::
The Self Investors Leading Stocks Index is comprised of stocks in the Breakout Tracker, which is a database of the fastest growing companies near a breakout or having already broken out of a base. Leading stocks performed outstanding today as small caps led the way and performed about in line with what the Russell did. 286 Self Investors Leading Stocks were up an AVERAGE of 4.19%.. now that’s what I call leadership!
Summary:
* Advancers led Decliners 286 to 17
* Advancers were up an average of 4.19% today, with volume 12% ABOVE average
* Decliners were down an average of 1.63% with volume 120% ABOVE average
* The total SI Leading Stocks Index was UP 3.87% today with volume 18% ABOVE average
::: Where’s the Money Flowing :::
Many investing websites provide leading industries based on price performance alone. However, without accompanying volume levels, this can sometimes be misleading. The only way that I know of to gauge industry/sector strength WITH volume levels is through the analysis of ETF’s. A couple years ago this was not possible, but as more traders/investors use ETF’s they become a much better tool for gauging the health of the market and seeing where the money is flowing (or not flowing). Using the proprietary SelfInvestors Demand Indicator score which measures price and volume movements, I’m able to quickly see which sectors/industries are seeing the greatest inflows of cash. For a detailed look at how I go about gauging sector/industry strength please see the following post: http://selfinvestors.com/si/industry_tracking/
* Current Leading Sectors/Industries (over last 30 trading days):
Dynamic Utilities, Biotech, Pharma, Bonds, Health Care (leadership in medical/healthcare emerging!)
* Current Lagging Sectors/Industries (over last 30 trading days):
Semis, Retail, Networking, Nuclear Energy
* Today’s Market Moving Industries/Sectors (UP):
Home Construction, Regional Banks, Materials, US Real Estate, Basic Materials
* Today’s Market Moving Industries/Sectors (DOWN):
Oil, Commodities, Gold, Bonds
::: Stocks :::
The stocks section will be an area where I highlight one stock selected from a group of stocks moving up with volume well above average and most likely breaking out of a base or consolidation. Sorry, I’m real short on time tonight so not stock of the day, but have a look at these Self Investors Leading stocks above the 50 and 200 day moving averages that moved up with big volume today.
In order of total rank (fundamentals + technicals)
Double Take Software (DBTK)
Shanda Interactive (SNDA)
Axsys Technologies (AXYS)
Credicorp (BAP)
SunPower (SPWR)
Kirby Corp (KEX)
GFI Group (GFIG)
Dynamic Materials (BOOM)
FCStone Group (FCSX)
Interactive Intelligence (ININ)
Banco Itau (ITU)
Chicago Bridge & Iron (CBI)