I suppose I should rename the Trade of the Day feature to Trade of the Week the way it’s been going lately. I’ll try and post more of these, just been really busy with this crazy market of late.
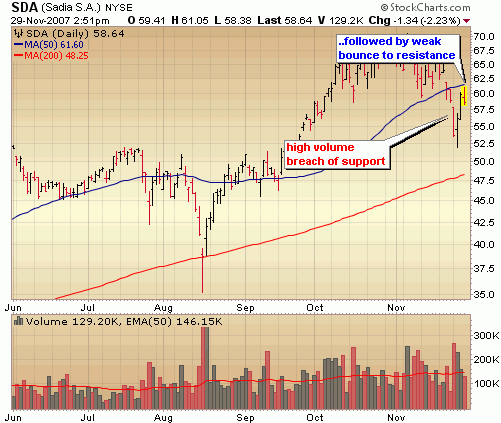
Today I thought I’d go against the grain of the past few days, perhaps to serve as a reminder that yes bears are still firmly in control and two days of big gains doesn’t change that at this point. Today I highlight a short setup in Sadia (SDA), a Brazilian processor of food products. This short setup is very characteristic of what I look for in most of shorts I look for – a high volume break down of support followed by a weak retest of what is new resistance, in this case the 50 day moving average. One of the better looking shorts out there in my opinion.
Disclaimer: I do not have a position in SDA at the time of this writing.

Looks like SDA started to flat line. There has been major short term weakness in the past few weeks, but it looks as if a major downturn may be in the works.
Weak Uptrend
SADIA SA ADS (NYSE:SDA)
Smart Scan Chart Analysis shows that positive longer term is weakening. The market action could signal the start of a major trend change Weak Uptrend Very tight money management stops.
Based on a pre-defined weighted trend formula for chart analysis, SDA scored +65 on a scale from -100 (strong downtrend) to +100 (strong uptrend):
+10 Last Hour Close Above 5 Hour Moving Average
-15 New 3 Day Low on Thursday
-20 Last Price Below 20 Day Moving Average
+25 New 3 Week High, Week Ending December 15th
+30 New 3 Month High in November
+65 Total Score
Everyone have a wonderful holiday and a prosperous new year,
Lindsay at the TradersBlog