All posts by Tate Dwinnell

I’ve Been Taking Google (GOOG) Profits

I have a confession to make.  I’ve been taking Google profits.  I first began highlighting Google to my premium members in 2006 and profiled it here in May of 2007 at 483.52 as the stock showed signs of an imminent breakout.  That was then, this is now.. and times have certainly changed.  For one thing, the market is on the verge of / in the beginning stages of a bear market (I’ll have more on this in a post tomorrow morning).  In this scenario, no stocks are immune to a sale, no matter how good the company. Google is no exception. 

On November 16th, 2007 I added to my long term Google position as the stock pulled back to the 50 day moving average, following a big fall run to nearly $750.  In an email to members, I said:

"I’m adding to my long term Google position here as it tests the 50 day moving average.  I still believe the market is going to get a decent run very soon and that a leading stock like Google will benefit greatly.  Also, remember that Nov, Dec and Jan are quite often great months for the stock market and techs in particular.  I  think that the greatest downside risk from here with Google is 600 and that only happens if we get another spike down to test the August lows of the major indices.  I’m confortable adding another $10K (less than 4% of portfolio) to my long term core position here at 623.26."

At the time of the trade off the 50 day moving average, I hadn’t really planned on trading it for a quick gain but given the uncertainty of the overall market and the quick bounce off support, I decided to lock in the trade for a quick profit.  On Nov 29th, 2007 I wrote to members:

"I added to my Google position after it was demolished and hitting the 50 day moving average just over a week ago, bringing my total portfolio position to a bit under 15% of the portfolio.  I believe the stock has come too far too fast and really needs to spend more time repairing the technical damage of early November.  I could see some kind of double bottom base forming with decent potential of retesting the low around 615 again.  I want to lock in this quick 12% profit on the 10K I took about a week ago and will consider adding to the position again once this base gets sorted out and I have a better idea of just how far the overall market will correct.  I’m out at 701.23."

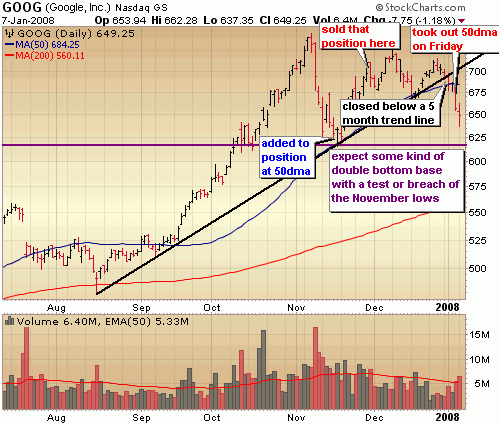
Roughly 3 weeks later on Dec 18th, Google would test the 50 day moving average once again, dipping well below this key support level intraday, but closing above support and keeping me in one of my long term positions (initiated in late 2006).  For awhile, it looked as if Google was going to break out of a bullish triangle formation (as you’ll see in the chart below).  However, on January 3rd, Google dipped below a 5 month upward trend line but managed to close just about on this line.  It wasn’t until the next day that the move was confirmed and the stock sold off fairly hard, taking out this trend line and support of the 50 day moving average with conviction.  It was on this day  I decided to lock in gains on a Google position I had been holding for 14 months.  I sent the following note to my premium members on Jan 4th 2007:

"I mentioned yesterday that core positions Mastercard and Google were not exempt from a potential sale.  Given the current market environment, nothing is immune to a sale.  Yesterday, Google bounced back and closed near the high of the day, so I gave it another chance to get back above the 50 day moving average today.  However, it’s taking out today’s lows, yesterday’s lows and support of a 5 month trend line.  So, I’m taking one of my $10K core positions off the table today at 673.25. and locking in a nearly 40% profit."

The action over the past few days indicates short term deterioration in Google, but longer term I still like Google very much.  Nothing has fundamentally changed for Google at this point and I would expect them to report another outstanding quarter in a couple weeks.  What I see happening is some sort of double bottom base formation with the first leg down low at 616.02, the middle "W" peak at 724.80 and the second leg down in the base at 616.02 or lower.  Typically a stock will take out the lows of that first leg down, to shake out a few more sellers, so a test of around 600 is highly likely.  This is an area where the 200 day moving average will approach in a few weeks as well so potentially a good spot to consider adding shares.  I’m still holding one core position with a 60% profit  that I got into in October of 2006.  I probably will NEVER unload this position.. but then again I should never say never!

Here’s a look at the 6 month chart of Google with highlights of where I added that last November position, then sold two positions. 

Disclaimer: I still own a position in Google and looking to add more, probably sometime after earnings.

Bulls, Bears Draw the Lines in the Sand

With the light holiday trading coming to a close we find ourselves in no man’s land but with the lines in the sand drawn.  I’m still in vacation mode and refreshing the batteries for 08 so will keep the analysis short tonight and move right into the charts. 

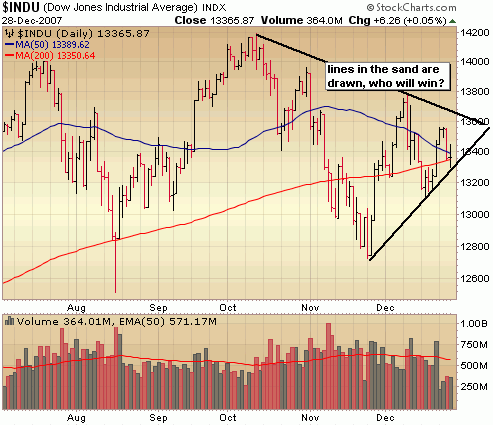
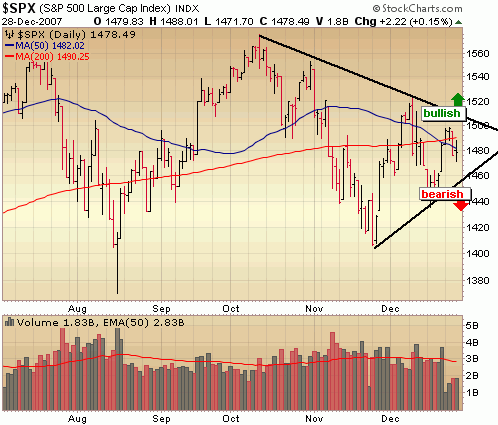
What you’ll see in both the Dow and S&P is channel trading over the past few weeks with price getting squeezed to a narrower point (which could eventually carve out a triangle formation).  With this formation, we have firm areas of resistance and support setting up with a breakout above or a breach below revealing much about this market.  I would guess that we’ll continue to trade fairly directionless for a couple more weeks until earnings start ramping up again. 

Note the Dow bounced off support of this trianlge formation on Friday so the odds are good for a bit of a push up this week.
You’ll see a similar formation in the S&P with price getting squeezed around 1480.  Eventually, the build in pressure must release and the it’s still up to the bulls to prove themselves.  The prevailing trend is still down, so odds are in favor of a break below out of this triangle.  Time will tell. 
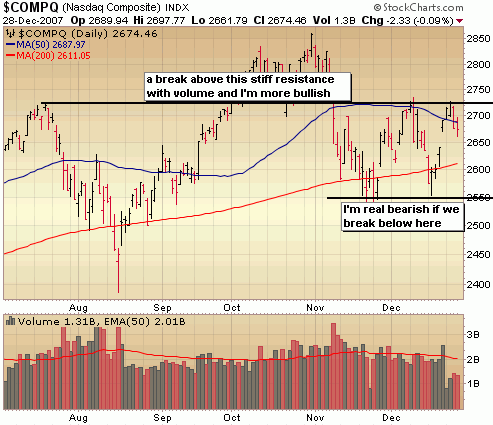
In the Nasdaq, current support and resistance levels are better defined within a channel with the upper bound around 2725 (an area it’s had trouble clearing) and the lower bound of support around 2550 (an area it has bounced from on 2 occassions in November and again here in December.  The market probably won’t make any significant moves out of this channel until normal trading levels resume and the earnings season begins in the 3rd week of January.  Until then, I continue to tread lightly, not making large bets on either side.
::: Recommended Reading :::

This is a new section that will appear in the Weekly Report for some time but will probably be moved to separate post at some point.  Usually my responsibilities in running SelfInvestors.com prevents me from doing much reading during the trading week but if you do get a chance to read some good articles from other blogs or news outlets send them my way and I’ll post them here.  Send to support at selfinvestors.com

**

Marc Faber in an article at Daily Reckoning discusses the credit crisis and inflation.   He says, "Will rate cuts be of much help to the asset markets and the economy? I believe we are in a war between two major adversaries. On the one side we have the Fed (and other central banks) pumping liquidity into the system in a desperate attempt to support the asset markets and the economy. On the other side we have the private sector, which, as Hatzius explained, is being forced to curtail lending due to heavy losses in the credit market and to fight the Fed’s reflation efforts by widening credit spreads. Complicating matters is the fact that both adversaries have powerful allies."Will rate cuts be of much help to the asset markets and the economy? I believe we are in a war between two major adversaries. On the one side we have the Fed (and other central banks) pumping liquidity into the system in a desperate attempt to support the asset markets and the economy. On the other side we have the private sector, which, as Hatzius explained, is being forced to curtail lending due to heavy losses in the credit market and to fight the Fed’s reflation efforts by widening credit spreads. Complicating matters is the fact that both adversaries have powerful allies."

Is Starbucks a good barometer of the economy?

Pressure on revenues and cost increases contributed to the dismal performance of earnings in the third quarter of 2007. For example, Starbucks (SBUX) increased prices by an average of 9 cents a cup in July. However, customer visits to US stores fell 1% for the quarter ended September 30. Starbucks’ CFO noted that a "similar decline may occur in the fourth quarter although they will be positive for the full year". (This would seem to indicate that the economy slowed down considerably in the second half.) According to him, "unbeknownst to us, we saw economic headwinds that quite frankly came up probably stronger than I thought." Earlier, Starbucks’ CEO had remarked: "The consumer is being faced with rising costs in every sector of their lives, and so part of that is reflecting on us." An informed friend of ours suggested that declining traffic at Starbucks stores in the US is of particular concern, since Starbucks serves all income levels.

**

Bill Bonner of Daily Reckoning puts China in perspective. 

"Per-capita income in China is less than 1/10 of America’s and its per-capita greenhouse gas emission is less than 1/5 of ours. But if 1.3 billion Chinese were to consume at the level Americans do, we’d need several more Earths.

**

Jim Cramer has evolved but continues his flip flopping ways.

Cramer says, "trying to game short-term movements in stocks (is) almost impossible," Oh really?  I think many, including myself can prove him wrong on this point.

On the much publicized Fed rant:  "I’m very proud of that call," Cramer says, saying the Fed really had no idea of the severity of the crisis. Arguably, Cramer was proved right by the market turmoil that followed. "I subsequently heard from people at the Fed that it had an impact," he says.  The Fed listens to you?  In your dreams.

**

Tom Lydon of ETF Trends reviews his ETF predictions for 2007 and makes some new ones for 2008.

1. Global markets will no longer be in sync with the U.S. market, and ETFs are the way to take advantage of global growth.
2. Actively managed ETFs fail to generate excitement.
3. ETFs hit $1 trillion in assets.
4. More ETFs will appear on global exchanges.
5. Bigger players will enter the market.
6. Commodity ETFs will continue their expansion and gain even more popularity.
7. Fixed-income assets will grow.
8. U.S. investors will begin realizing that they can look abroad for their investments.
9. Individual investors will start asking their financial advisors why ETFs aren’t part of their portfolios.
10. An ETF of ETFs will finally hit the U.S. market.

**

Really there is inflation.. really there is. 

Even with gasoline prices soaring, milk still tops gas prices. The nationwide average for a gallon of whole milk is $3.80, according to the U.S. Department of Agriculture. That dwarfs the nationwide average of $2.99 for a gallon of unleaded, according to AAA.

"A lot of basic foodstuffs seem to be going up and dairy products are going through the roof," said Norris of Oakworth Capital.

It’s not just milk-drinking kids – coffee drinkers are taking a hit from higher dairy prices as well. Back in August, Starbucks Corp. (SBUX, Fortune 500) chief executive Jim Donald blamed "rising expenses, particularly higher dairy costs" for a 9-cent rise in the price of coffee drinks. For the first time in three years, Starbucks reported a 1 percent drop in customer visits to their stores, even as the value per transaction increased 5 percent.

**

Hugo Chavez is proving yet again that socialism doesn’t work.

The strength of the Venezuelan economy has long been a key factor in the popularity of President Hugo Chávez. With oil prices surging and government coffers bulging, Chávez has been able to offer generous social programs and price controls to keep basics affordable for all. But now the first cracks in the economic boom are starting to show. Inflation is surging, shortages of certain products are spreading, and the value of the bolivar, the local currency, is sliding, at least on the black market.

**

Did Bear Stearns (BSC) provide the spark that kicked off the credit crisis?

It’s too soon to tell whether authorities will find any wrongdoing. But a BusinessWeek analysis of confidential hedge fund reports and interviews with lawyers, investors, and securities experts reveals just how pivotal a role Cioffi’s funds played in the mortgage market’s dramatic rise, dizzying peak, and disastrous fall.

**

Ah, when to sell your stock?  That’s the million dollar question and the most difficult part of trading.  I would argue that it’s more art than science.  Chris Perruna provides key points from a book by Justin Mamis called appropriately "When To Sell"

A few examples include: 

1. Rule One of the professional trader is: When a stock doesn’t do what you expect it to do, sell it.
2. Stocks are bought not in fear but in hope. They are typically sold out of fear.

**

Will joint ventures bury the homebuilders?  Lennar (LEN) has the most exposure here.

**

Zach provides some excellent analysis of Wuxi Pharma Tech (WX) and Interactive Brokers (IBKR)

 ::: Self Investors Model Portfolio :::

** This section will now appear as a separate report to be published on Wednesdays.

Would you like to receive buy and sell alerts within minutes of each transaction of the Model Portfolio?  You can receive these along with ALL of the tracking tools and reports with the very popular Gold membership.  Don’t delay, get started today and join me for many more highly profitable months here at SelfInvestors.com.

::: Best/Worst Performers :::

– Top 10 Performing Industries For the Week –

1. Silver: 12.05%
2. Gold: 9.70%
3. Computer Peripherals: 7.50%
4. Nonmetallic Mineral Mining: 5.65%
5. Oil & Gas Refining & Marketing: 5.45%
6. Oil & Gas Drilling & Exploratoin: 5.20%
7. Telecom Services – Domestic:  5.10%
8. Agricultural Chemicals: 5.00%
9. Oil & Gas Equipment & Services: 4.80%
10. Packaging & Containers: 4.65%

– Top 10 Worst Performing Industries For the Week –

1. Semiconductor – Memory Chips: -6.30%
2. REIT – Hotel/Motel: -5.50%
3. Electronic Stores: -4.30%
4. Water Utilities: -4.05%
5. REIT – Office: -3.95%
6. Toy & Hobby Stores: -3.90%
7. Broadcasting – Radio: -3.50%
8. Savings & Loans: -3.45%
9. Recreational Goods: -3.40%
10. Sporting Goods: -3.35%

– Top 5 Best Performing ETFs For the Week –
 
1. ASA Gold
(ASA) 13.30%
2. iPath India (INP) 13.25%
3. Morgan Stanley India (IIF) 10.60%
4. Latin America Discovery (LDF) 10.20%
5. Market Vectors Gold Miners
(GDX) 8.75%

– Worst 5 Performing ETF’s –

1. Mexico Fund (MXF)  -12.05%
2. Japan Small Cap (JOF)
 -7.85%
3. Chile Fund (CH)  -3.00%
4. Ishares
Homebuilders (ITB) -2.75%
5. 
Market Vectors Nuclear Energy (NLR)  -2.30%

:::  IPO’s Worth Watching for This Week :::

This section will now appear as a separate report on Mondays. 
Note: there are no IPO’s scheduled for the next few weeks, so you won’t see IPO posts on Mondays for awhile

::: Upcoming Economic Reports (12/31/07 – 1/4/08) :::

Monday:         None
Tuesday:       Holiday
Wednesday: FOMC Minutes, ISM Index, Construction Spending
Thursday:      Auto/Truck Sales, Initial Claims, Factory Orders
Friday:            Nonfarm Payrolls, Unemployment Rate, Hourly Earnings, ISM Services

::: Upcoming Notable Earnings Reports :::

None

::: In Case You Missed It – SelfInvestors Blog Entries of the Past Week :::

1. Solar Stocks Still Energized – Solarfun (SOLF) Pennant Breakout
 

Solar Stocks Still Energized – Solarfun (SOLF) Pennant Breakout

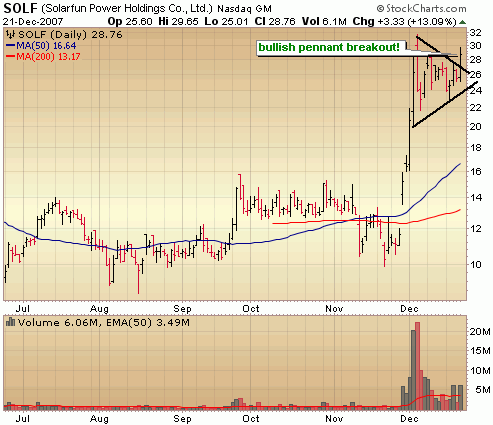
People have been trying to call a top in the solar energy stocks for months now but the good news just keeps on coming in this sector and it remains white hot.. Now I’m in no way recommending initiating aggressive positions in the leading solar stocks at this point.  It’s more a situation of a short term trade over the next few weeks or a hold if you’ve been the names for awhile.  These stocks are far too extended for large positions.

Leading solar stocks such as First Solar (FSLR), JA Solar (JASO), Suntech Power (STP), MEMC Materials (WFR) and Solarfun Power Holdings (SOLF) aren’t showing any technical deterioration despite massive runs but at some point the music will stop and you better find a chair.  With that disclaimer out of the way I’d like to highlight a Solar Trade of the Day. 

Despite an amazing run that saw Solarfun (SOLF) nearly triple in just one week, the stock is breaking out of a bullish pennant formation and looks poised for more.  Volume wasn’t great today, so it could pull back a bit offering a better entry.  New support is just above 26.

Disclaimer: I own a position in SOLF

Model Portfolio Update

It was another good week for the Self Investors Model Portfolio and I continue to tread lightly here, not making large bets on either side.  For the week, the Model Port outperformed the S&P500 which was down 2.2% over the past week, VS. down .6% for my portfolio.  That drops the year to date performance to 29.4% which is still 10 times the return of the S&P
The losses were mitigated this week with my short hedge positions, led by AIRM which was closed this week for a quick 14% gain.  I am looking to replace this short position with another possibly tomorrow, depending on the action of the overall market.  Today, I did add a small long position in a leading stock.

The longer we stall here, with the Dow and S&P submerged below their 200 day moving averages, the greater the likelihood we’re testing those November lows BEFORE testing those December highs.  The market seems to be a bit in no man’s land with the bears exerting some control, but the bulls looking like they could strike and stage a year end holiday rally at any time.  If the bulls are going to run, they better do so very soon.  If we take out yesterday’s lows, I may close out a couple long positions as well.

At this point, I don’t really care what the market does from here to the end of the year.  I’m going to maintain a conservative approach and sit on around 40% cash.  If I don’t make another dime from now until the end of the year, I can be satisfied with the 30% gain here in 2007 and looking forward to next year when I anticipate a shorting strategy will be critical.  I’m ready and waiting.  Bring it on bears!

::::::::::::::::::::::::::

Would you like to receive buy and sell alerts within minutes of each transaction of the Model Portfolio?  You can receive these along with ALL of the tracking tools and reports with the very popular Gold membership.  Don’t delay, get started today and join me for many more highly profitable months here at SelfInvestors.com.  Look forward to having you aboard.

Under the Radar China Breakouts – Harbin Electric (HRBN), Shengdatech (SDTH), Fushi (FSIN)

It’s been a little while since I’ve taken a look at the SelfInvestors Breakout Tracker for a review of the top breakouts.  It’s not a  great time to be pursuing breakout stocks with aggression, but in this report I hope to highlight a few potential leaders if this market turns around.  I personally initiate positions in breakout stocks in difficult markets, but they have to be the best and showing tremendous accumulations.  I limit my risk by initiating smaller positions and take profits and cutting losses much sooner.

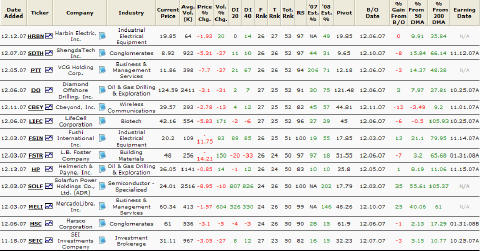
In reviewing the breakouts of the past two weeks, it’s clear that it’s still a difficult market for leading stocks (most stocks for that matter).  Just 20 breakouts occurred with ONLY 6 finishing the period with a gain.  On the bright side only Cbeyond (CBEY) and Shengdatech (SDTH) have losses of 8% or more.  So while most leading stocks aren’t providing big gains, they aren’t exactly falling apart quite yet either. 

:::::::::::::::::::::::::::::::::

Did you know that you can get access to the Breakout Tracker all day everyday and keep on top of fresh breakouts in undiscovered companies for a measly $19.95 month!  You can!  Get all the details here.

:::::::::::::::::::::::::::::::::

You may click on the image below for a larger view to see the top breakouts of the past 2 weeks.  These are breakout stocks with a total rank (fundamentals + technicals) of 50/60 or above.  Have a look at the Breakout Center tutorial for a complete rundown of what the data in the table indicates (some is not self explanatory such as the DI scores)

There were a few big winners to tell you about, most of which are China based but another that’s considered the Ebay of Latin America, Mercadolibre.com (MELI).  Once it broke out from its first base since going public, it was off to the races and is currently up 25% from the breakout point.  This is why I don’t think it’s a bad idea to dabble in the best of breed breakouts.

There were four big China breakouts over the past few weeks, none of which in companies most are familiar with.  These four could potentially be the next big winners coming out of China so are worth keeping an all eye on.  All 4 are money makers with very good looking charts, including Solarfun Power (SOLF) which I won’t highlight in detail because it’s way too extended from a proper entry point (up 35% from the breakout point!) and not quite as under the radar as the other 3/

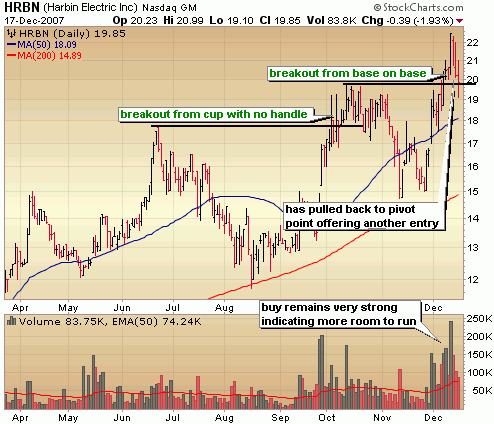
The highest rated breakout (score of 52/60) of the period was Harbin Electric (HRBN), a Chinese manufacturer of motor products and systems.  You can see in the chart below that that HRBN broke of a base on base patternn in early December and volume continued to spike higher indicating  tremendous demand.  I see this pullback to the pivot as another opportunity to get in.  I’ll certainly be dabbling a bit more down here.

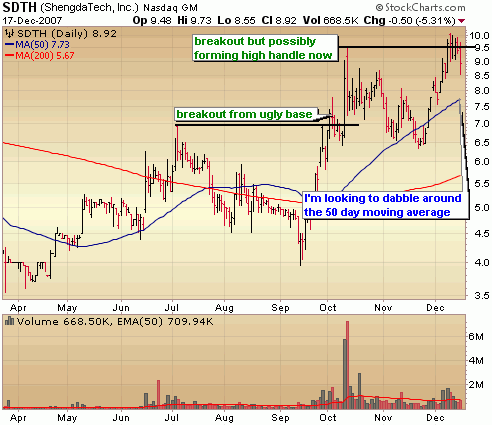
Shengdatech (SDTH) is the 2nd highest rated breakout of the week and just so happens to be another China play.  SDTH is a China nanotech play.  Bet you haven’t heard that buzzword in awhile!  It too broke out of a base on base pattern just a few days ago but doesn’t quite have the buy conviction behind it that HRBN does.  I’m looking to get into SDTH if it pulls back to the 50 day moving average around 8.  Considering the run it’s had I’m just not willing to put money to work up at these levels.

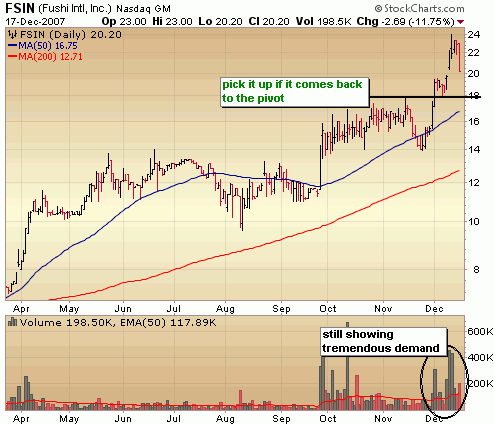
Fushi International (FSIN) is the 3rd "under the radar China play" I want to highlight today.  The maker of electric wire products and components has been showing nothing but accumulation since it was listed on the Nasdaq just a few short months ago.  Like HRBN, volume levels indicate tremendous demand, so any pullback to the breakout point (or pivot) around 18 would provide an entry point.

Disclaimer: I am personally long HRBN and looking to get longer.

Gushan Environmental Energy (GU) Leads the IPO Pack

This is the last week of IPO’s before the holiday lull and probably won’t see them popping up again with any frequency until around the middle of January.  Another hot China IPO hits the street this week on Wednesday along with a couple other decent looking IPO’s

1.  Gushan Environmental Energy (GU):  Chinese biodiesel maker Gushan Environmental Energy produces nearly 200,000 tons of this renewable fuel per year out of vegetable oil, animal fat, and recycled cooking oil. The company buys these raw materials from local vegetable oil and waste management companies, then once processed, the biodiesel is sold directly to marine vessel operators, petroleum wholesalers, and retail gas stations for use in boats, buses, trucks, generators, and other engines. Sales of biodiesel account for more than 80% of Gushan’s revenues, while the remainder comes from selling biodiesel’s by-products, such as glycerine, to food and drug companies.  This is a big company making a whole lotta money.  Trading is expected to begin on Wednesday.

Note: Chris Perruna has a nice analysis of Gushan Environmental (GU)

2. Orion Energy Systems (OESX):  designs, manufactures, and installs energy management systems that include HIF lighting, intelligent lighting controls, and its Apollo Light Pipe product, which collects and focuses daylight without consuming electricity. The firm estimates its products can help cut customers’ lighting-related electricity costs by up to 50% and reduce related carbon dioxide emissions. Since Orion’s inception in 1996 it has installed lighting in nearly 2,000 North American commercial and industrial facilities. Clients include such companies as GE, Kraft, and OfficeMax.  Trading set to begin on Wednesday.

3. Milestone AV Technologies (MLS):  develops and markets a variety of audiovisual and display equipment such as projector and flat panel display mounting, as well as audiovisual furniture and accessories. Established in 2003, Milestone AV Technologies serves more than 4,500 clients, including consumer electronics retailers (Best Buy) and home theater dealers (Abt Electronics). The company markets its products under the Sanus, Chief, and Vuepoint brand names, among others. Third-party suppliers in China, Malaysia, New Zealand, and the US make most of its products.  Trading set to begin on Wednesday.

Stock Charts Are Leading Indicators

In my last weekly report I urged you to Not Be Greedy and take the gift as the indices pushed higher into resistance levels with little conviction on expectations of another Fed rate cut.  Sure, a 50bp cut may have propped up the market for a bit longer, but the bulk of the rate cute hopes were priced in already.  That was your cue to take some profit and think about adding some short exposure.

As it turned out, the Fed didn’t surprise anyone by hitting the homerun with a 50bp cut (maybe due to the much hotter than expected inflation readings on Thursday and Friday), but had another trick up its sleeve, which proved to temporarily save the day and inject more liquidity, but more importantly a bit more confidence that the Fed will do anything to save the mortgage industry.  However, confidence doesn’t last long and more liquidity doesn’t always work, so this market still finds itself mired in a state of uncertainty both fundamentally and technically.  I’m not an economist and prefer not to spend precious hours debating inflation, recession or if the Fed is doing the right thing.  Those are all LAGGING indicators anyway.  Remember, LOOOOONNNGGGGG before those calling for a recession are proven right, the stock market will have already tanked and WE will have already bagged big profits on the short side and looking to get long again.

With that said, I turn to the ONLY leading indicators available.  The charts.  What are they telling us?  Generally, they tell us what the big fellas are doing.  The Banks, the Pension Funds, the Mutual Funds and increasingly so, the Hedge Funds.  Actions speak louder than words and the big fellas reveal their actions in the price and volume movements.

Unfortunately, there are times when the charts indicate more uncertainty.  Just a few days ago, there was much more certainty that the market would drop.  It was oversold and buy volume was diminishing as overhead resistance loomed.  Now that we have pulled back some, I’ve become a bit more neutral but still giving the bears the upper hand.  The onus is still on the bulls now.

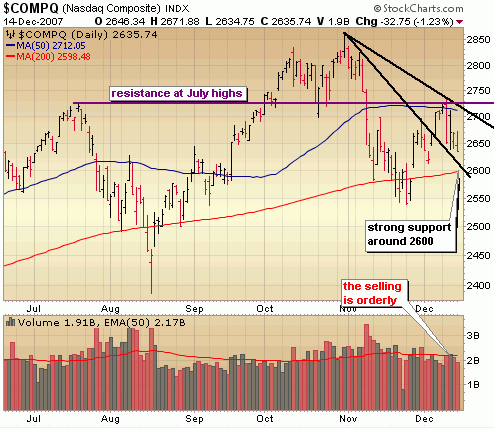
In the Nasdaq below we see that the first, steeper, downward trend was cleared and we are now pulling back to what is now a new support levels (around 2600).  Despite the distribution (institutional selling) on the Fed rate cut day, the selling has actually been fairly orderly.  Notice that there wasn’t much selling intensity on Friday despite the big price move down on those higher inflation numbers.  I would have expected to volume to be more severe.  It was not, so for bulls that’s encouraging.  More orderly selling, could very well set us up for another run at key resistance levels but like I said I’m not making large bets on that just yet.  I continue to sit on a sizable cash position and hedge with short positions.

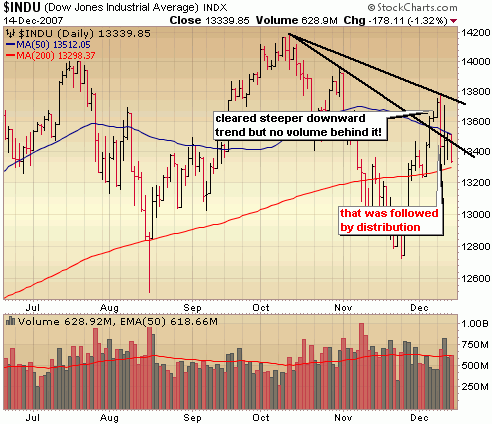
The Dow also cleared a downtrend, but pulled back below that level late in the week, so now faces stiff resistance of two downward trend lines (in black) and the 50 day moving average (blue).  Until the Dow can clear those resistance levels (above about 13700) some big volume behind it, I will not get aggressive on the long side and continue to hedge with short positions.

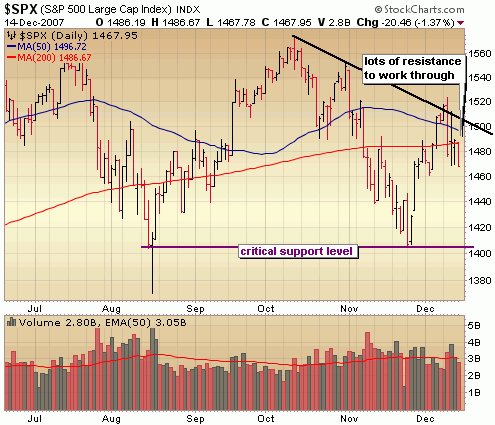
The financial heavy S&P of course remains the weakest of the indices and just barely nudged above its downward trend line before failing and taking out support of both moving averages.  At this point, I would certainly put the odds of testing those November lows higher than the S&P breaking out above the downward trend with heavy volume. 

While I won’t call this a bear market just yet, the bears continue to exert more control with each passing week.  Play accordingly, play cautiously.


 ::: Model Portfolio :::

** This section will now appear as a separate report to be published on Wednesdays.

Would you like to receive buy and sell alerts within minutes of each transaction of the Model Portfolio?  You can receive these along with ALL of the tracking tools and reports with the very popular Gold membership.  Don’t delay, get started today and join me for many more highly profitable months here at SelfInvestors.com.

::: Best/Worst Performers :::

– Top 10 Performing Industries For the Week –

1. Home Health Care: 3.90%
2. Multi Media & Graphic Software: 3.65
3. Networking & Comm Devices: 2.40%
4. Semiconductor Specialized: 1.75%
5. Cleaning Products: .75%
6. Oil & Gas Drilling & Exploratoin: .35%
7. Metal Fabrication:  -.20%
8. Chemicals – Major Diversified: -.20%
9. Building Materials Wholesale: -.25%
10. Publishing – Periodicals: -.40%

– Top 10 Worst Performing Industries For the Week –

1. Major Airlines: -12.00%
2. Silver: -11.95%
3. Banks – SE: -11.60%
4. Lodging: -11.00%
5. Auto Parts Stores: -10.85%
6. Home Furnishing Stores: -10.50%
7. Toy & Hobby Stores: -10.50%
8. Surety & Title Insurance: -10.00%
9. REIT – Hotel/Motel: -9.90%
10. REIT – Residential: -9.80%

– Top 5 Best Performing ETFs For the Week –
 
1. Templeton
Russia and E. Europe (TRF) 8.40%
2. US Oil (USO) 4.10%
3. Powershares Clean Energy (PBW) 3.35%
4. Ishares Commodities (GSG) 3.15%
5. Morgan Stanley
E. Europe (RNE) 2.30%

– Worst 5 Performing ETF’s –

1. Herzfeld Caribbean Basin (CUBA)  -16.70%
2. Ishares 
China (FXI) -9.45%
3. Templeton Dragon Fund (TDF)  -9.20%
4. Ishares
Taiwan (EWT)  -8.80%
5. 
Korea Fund (KF)  -8.75%

:::  IPO’s Worth Watching for This Week :::

This section will now appear as a separate report on Mondays.

::: Upcoming Economic Reports (12/17/07 – 12/21/07) :::

Monday:         None
Tuesday:       Housing Starts, Building Permits
Wednesday: Crude Inventories
Thursday:      GDP Final, Chain Deflator Final, Initial Claims, Leading Indicators, Philly Fed
Friday:            Personal Income/Spending, Core PCE Inflation,
Mich Sentiment

::: Upcoming Notable Earnings Reports :::

Tuesday: Goldman Sachs (GS)
Wednesday: Oracle (ORCL), Heico (HEI)
Thursday: Research in Motion (RIMM)

::: In Case You Missed It – SelfInvestors Blog Entries of the Past Week :::

1. Offshore Crude Oil Exploration & Production Perspective

2. Best IPO’s Trading This Week – Xinyuan Real Estate (XIN), VanceInfo (VIT) & More

3. A Classic "Sell the News" Result to Fed Rate Cut; Stock of Day – Synchronoss Technologies (SNCR)

4.  Barry on Navigating the Emotions of Stock Options Trading

5.  Stock Market Model Portfolio Review 12.12.07

6.  Preventing Online Identity Theft With Insurance From LifeLock

Preventing Online Identity Theft With Insurance From LifeLock

It’s time again to deviate a bit from the de facto stock market speak du jour.  I want to discuss Identity Theft.  I know, it won’t happen to you.  We all tend to think that way.  BUT it can and COULD happen even to you.  Identity theft is something I’ve been increasingly concerned about ever since I noticed multiple charges on my credit card from companies I have never done business with.  This came just a few weeks after my brother had checks stolen from his mailbox.  How the thieves were able to retrieve my credit card info I will probaby never know, but it’s unnerving to say the least.  What other info do they have? I was forced to close the account which was a minor headache.  Identity theft is no minor headache.  It can ruin lives, but the good news is that the growing problem (now 10 million identity theft victims a year!) has created some solutions.

Government is starting to step in and force the credit bureaus to offer a credit freeze.  According this article "Consumers can have a sigh of relief as of November 1st, 2007. All three credit bureaus gave into security freeze options for all states, including the 11 states without laws, before they all forced it by mandatory laws.

Now that the security freeze is available to everyone, here is how it works: Once a security freeze is desired a consumer needs to write a letter to each credit bureau and pay a fee of about $10 for each bureau. Once the freeze is in place, it prevents the big three credit bureaus from releasing information without the consent of the consumer.

A consumer can allow access to their credit report to either a specific business or organization, or they can choose a specific amount of time they want their credit report to be available without authorization. When a consumer freezes their credit report they are given a unique PIN that is used to lift the security freeze. Lifting a security freeze is also referred to as thawing your credit report."

Writing and paying each credit bureau for the freeze seems like a hassle to me.

Perhaps the better solution is going with a company like LifeLock which automates the process of protecting your identity, not to mention putting a halt to all that junk mail.  WallStrip founder Howard Lindzon is an investor and I first read about this service at his blog.  You can use the discount code "wallstrip" for a small discount.  I personally have signed up and the $100 bucks a year is a small price to pay knowing I’ll never have to worry about identity theft again. 

The LifeLock service does the following:

1. Insures you up to 1 million dollars in case of identity theft
2. Sets fraud alerts so that you are contacted when new lines of credit are requested
3. Provides credit reports
4. Removes your name from junk mail lists (worth the cost right there!) in addition to pre-approved credit card offers
5. 24 hour support

There are a couple other companies out there offering similar services but LifeLock appears to the best of the bunch.  I highly recommend checking them out and protecting your identity.

Additional Resources:

Federal Trade Commission – Identity Theft
Department of Justice Identity Theft
Non-Profit ID Theft Resource Center

Stock Market Model Portfolio Review 12.12.07

I used to provide the weekly Self Investors Model Portfolio review in the weekly market reports but will begin publishing these every Wednesday night as a stand alone post.  That should help ease the work load on those Sunday afternoons when I’d rather be on the couch with football and a few beers.

The last review of the model portfolio was a week and a half ago as the market was reaching the tail end of an oversold bounce.  Since that review, I haven’t really deviated from my plan of sitting on a sizable cash position (currently at 34% of the portfolio) and hedging long positions in leading stocks with a few short positions.  I did add a decent sized core position in Microsoft (MSFT) to go along with existing core positions in Google (GOOG), Cisco (CSCO) and Mastercard (MA).  Core positions are stocks I generally hold for longer periods and add to the position on the dips.  In addition I initiated a position in one of those high flying stripper stocks looking to score another round of big gains.  Both RICK and PTT were traded for gains of 54% and 19% in October and my current postion in PTT is already up another 18% in just a few days.  To hedge these long positions, I’ve been playing the short side as well and initiated two new short positions since the last review.  One short position in SBAC  was just closed this afternoon for a quick 10% gain.

As I’ve been mentioning in recent months I’ll continue to tread lightly as long as this market remains volatile and unpredictable.  It’s a strategy that has certainly paid off in the latter part of the year.  If you’ve been a reader of the blog for awhile you might remember that the Model Portolio struggled to keep up with the S&P in the spring and part of the summer as I missed much of the rally.  However, I stuck to what has worked for me and didn’t lose confidence in what I was doing.  I can’t stress how important that is. 

Despite sitting on nearly 50% cash for almost the entire year and NEVER using a dime of margin, the Model Portfolio is still up over 6 times the S&P with a year to date performance of right at 30% (a rise of 3% in the last week and a half).  Just goes to show that you don’t need to take on excessive risk to generate outstanding returns!  You have to pick and choose your time to get aggressive and leverage with margin.  My technical analysis this year just never provided a clear entry point to get overly aggressive.  There will come a  time again when a fresh bull market begins and I have the opportunity to double my portolio by leveraging with margin but that time is not now and probably won’t be for at least another couple years.   That’s OK, I’ll gladly take the 30% returns until that time comes.

Would you like to receive buy and sell alerts within minutes of each transaction of the Model Portfolio?  You can receive these along with ALL of the tracking tools and reports with the very popular Gold membership.  Don’t delay, get started today and join me for many more highly profitable months here at SelfInvestors.com.  Look forward to having you aboard.