In my last weekly report I urged you to Not Be Greedy and take the gift as the indices pushed higher into resistance levels with little conviction on expectations of another Fed rate cut. Sure, a 50bp cut may have propped up the market for a bit longer, but the bulk of the rate cute hopes were priced in already. That was your cue to take some profit and think about adding some short exposure.
As it turned out, the Fed didn’t surprise anyone by hitting the homerun with a 50bp cut (maybe due to the much hotter than expected inflation readings on Thursday and Friday), but had another trick up its sleeve, which proved to temporarily save the day and inject more liquidity, but more importantly a bit more confidence that the Fed will do anything to save the mortgage industry. However, confidence doesn’t last long and more liquidity doesn’t always work, so this market still finds itself mired in a state of uncertainty both fundamentally and technically. I’m not an economist and prefer not to spend precious hours debating inflation, recession or if the Fed is doing the right thing. Those are all LAGGING indicators anyway. Remember, LOOOOONNNGGGGG before those calling for a recession are proven right, the stock market will have already tanked and WE will have already bagged big profits on the short side and looking to get long again.
With that said, I turn to the ONLY leading indicators available. The charts. What are they telling us? Generally, they tell us what the big fellas are doing. The Banks, the Pension Funds, the Mutual Funds and increasingly so, the Hedge Funds. Actions speak louder than words and the big fellas reveal their actions in the price and volume movements.
Unfortunately, there are times when the charts indicate more uncertainty. Just a few days ago, there was much more certainty that the market would drop. It was oversold and buy volume was diminishing as overhead resistance loomed. Now that we have pulled back some, I’ve become a bit more neutral but still giving the bears the upper hand. The onus is still on the bulls now.
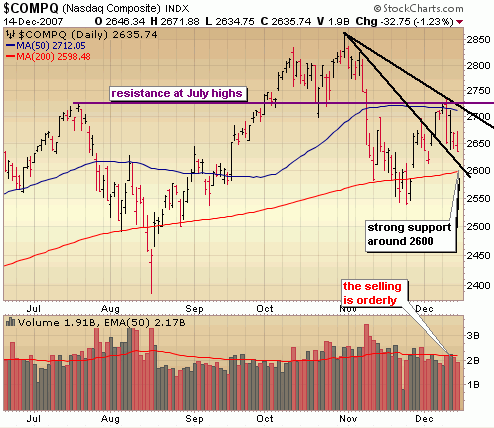
In the Nasdaq below we see that the first, steeper, downward trend was cleared and we are now pulling back to what is now a new support levels (around 2600). Despite the distribution (institutional selling) on the Fed rate cut day, the selling has actually been fairly orderly. Notice that there wasn’t much selling intensity on Friday despite the big price move down on those higher inflation numbers. I would have expected to volume to be more severe. It was not, so for bulls that’s encouraging. More orderly selling, could very well set us up for another run at key resistance levels but like I said I’m not making large bets on that just yet. I continue to sit on a sizable cash position and hedge with short positions.

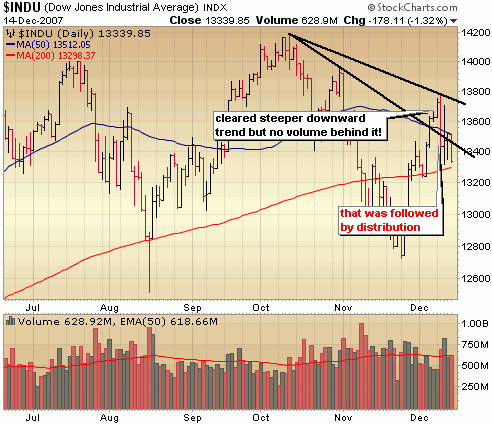
The Dow also cleared a downtrend, but pulled back below that level late in the week, so now faces stiff resistance of two downward trend lines (in black) and the 50 day moving average (blue). Until the Dow can clear those resistance levels (above about 13700) some big volume behind it, I will not get aggressive on the long side and continue to hedge with short positions.

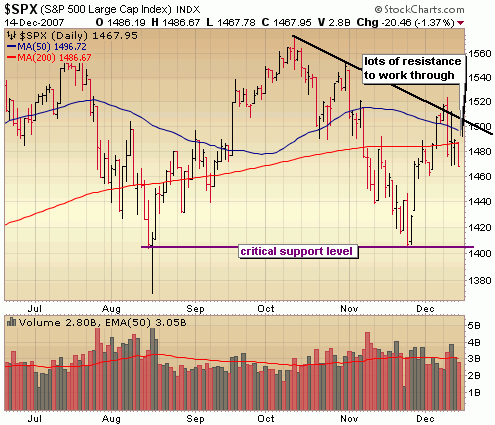
The financial heavy S&P of course remains the weakest of the indices and just barely nudged above its downward trend line before failing and taking out support of both moving averages. At this point, I would certainly put the odds of testing those November lows higher than the S&P breaking out above the downward trend with heavy volume.
While I won’t call this a bear market just yet, the bears continue to exert more control with each passing week. Play accordingly, play cautiously.

::: Model Portfolio :::
** This section will now appear as a separate report to be published on Wednesdays.
Would you like to receive buy and sell alerts within minutes of each transaction of the Model Portfolio? You can receive these along with ALL of the tracking tools and reports with the very popular Gold membership. Don’t delay, get started today and join me for many more highly profitable months here at SelfInvestors.com.
::: Best/Worst Performers :::
– Top 10 Performing Industries For the Week –
1. Home Health Care: 3.90%
2. Multi Media & Graphic Software: 3.65
3. Networking & Comm Devices: 2.40%
4. Semiconductor Specialized: 1.75%
5. Cleaning Products: .75%
6. Oil & Gas Drilling & Exploratoin: .35%
7. Metal Fabrication: -.20%
8. Chemicals – Major Diversified: -.20%
9. Building Materials Wholesale: -.25%
10. Publishing – Periodicals: -.40%
– Top 10 Worst Performing Industries For the Week –
1. Major Airlines: -12.00%
2. Silver: -11.95%
3. Banks – SE: -11.60%
4. Lodging: -11.00%
5. Auto Parts Stores: -10.85%
6. Home Furnishing Stores: -10.50%
7. Toy & Hobby Stores: -10.50%
8. Surety & Title Insurance: -10.00%
9. REIT – Hotel/Motel: -9.90%
10. REIT – Residential: -9.80%
– Top 5 Best Performing ETFs For the Week –
1. Templeton
2. US Oil (USO) 4.10%
3. Powershares Clean Energy (PBW) 3.35%
4. Ishares Commodities (GSG) 3.15%
5. Morgan Stanley
– Worst 5 Performing ETF’s –
1.
2. Ishares
3. Templeton Dragon Fund (TDF) -9.20%
4. Ishares
5.
::: IPO’s Worth Watching for This Week :::
This section will now appear as a separate report on Mondays.
::: Upcoming Economic Reports (
Monday: None
Tuesday: Housing Starts, Building Permits
Wednesday: Crude Inventories
Thursday: GDP Final, Chain Deflator Final, Initial Claims, Leading Indicators, Philly Fed
Friday: Personal Income/Spending, Core PCE Inflation,
::: Upcoming Notable Earnings Reports :::
Tuesday: Goldman Sachs (GS)
Wednesday: Oracle (ORCL), Heico (HEI)
Thursday: Research in Motion (RIMM)
::: In Case You Missed It – SelfInvestors Blog Entries of the Past Week :::
1. Offshore Crude Oil Exploration & Production Perspective
2. Best IPO’s Trading This Week – Xinyuan Real Estate (XIN), VanceInfo (VIT) & More
3. A Classic "Sell the News" Result to Fed Rate Cut; Stock of Day – Synchronoss Technologies (SNCR)
4. Barry on Navigating the Emotions of Stock Options Trading
5. Stock Market Model Portfolio Review 12.12.07
6. Preventing Online Identity Theft With Insurance From LifeLock
Great title…stock charts are leading indicators. Leading stocks as well.
Great analysis. This is becoming a must read for me on mondays!