All posts by Tate Dwinnell

Top Breakout Stocks With Greatest Demand: Watch Digital Ally (DGLY)

A few weeks ago I put up a list of the Top 15 IPO’s showing the greatest demand over the past 30 trading days and several of the stocks in that list have tacked on big gains since I posted it.  Stocks like Gushan Environmental (GU) up around 60%, LDK Solar (LDK) up over 30%,  VisionChina (VISN) up about 30%, Vanceinfo Tech (VIT) up 30%, First Solar (FSLR) up 30%, Trina Solar (TSL) up 25% and ReneSola (SOL) up around 20%.

To give you head start on research for the weekend, I thought I’d post the Top 10 Breakout Stocks showing the greatest demand over the past 20 days.  It should be noted that several of these are well extended from a proper buy point and should be avoided for now.  As for the rest, they are not buy recommendations but simply ideas for further research.  Now get on with that further research!

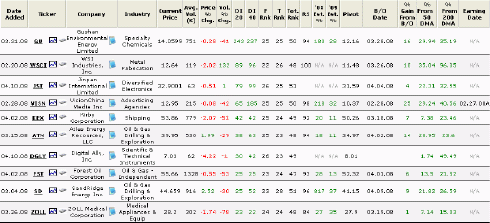
The following is a screenshot of the SelfInvestors Breakout Tracker database.  A database of only the highest quality companies leading the market.  The table is sorted by DI 20 so that those stocks showing the greatest demand over the past 20 days are listed at the top.  The DI (or demand indicator) is a proprietary indicator that I use to track price and volume movement in a stock.

Please click on the image below to launch a larger image that you can actually see.

41108_topDIthumb

Notice that a few IPO’s that I highlighted in the last report appear here as well.  That’s because IPO’s are included in the Breakout Tracker too once they have formed their first base.

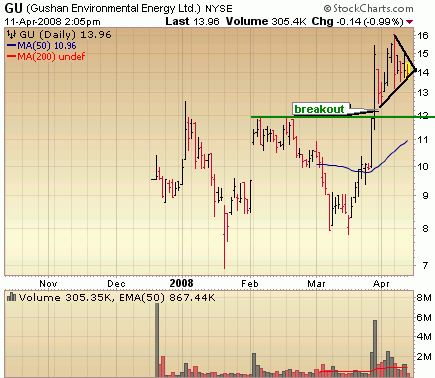
Let’s take a look at the charts starting right from the top with Gushan Environmental (GU).  The stock broke out above 12 with very heavy volume and offered an entry there.  It ran up another 30 from there before consolidating into a triangle formation which is where it sits now.  It’s still a bit overextended and I could see it breaking that triangle below and retesting the breakout point around 12 as many breakout stocks do.

41108_gu

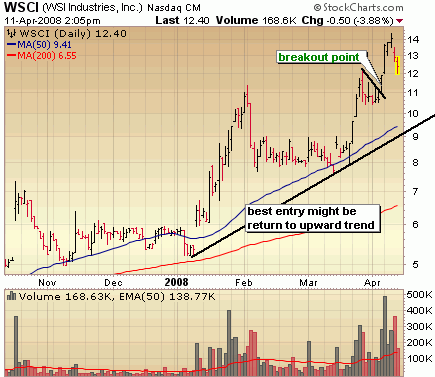
WSI Industries (WSCI) is an interesting one off the radar of many but it’s had a tremendous run in recent weeks.  This is another one that’s over extended but should be watched closely for a return to the upward trend line where it may offer a decent entry point.

41108_wsci

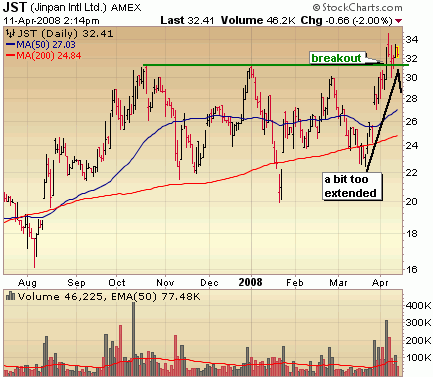
Jinpan International (JST) is one of my favorite breakout plays currently, but I’d like to see it come in a bit more after its recent breakout.  Buy vs sell volume is excellent and with the stock trading up around all time highs, there is lots of room to run if this market can get going again.

41108_jst

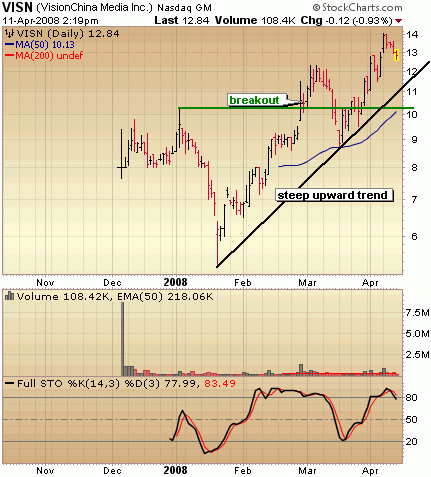
VisionChina (VISN) is another one I highlighted in that IPO report a few weeks back and it has done nothing but surge higher.  It’s well extended, but this is shaping up as a home run stock and should be watched closely for pull backs.  A return to that steep upward trend line might offer an initial spot to get in if you missed it. 

41108_visn

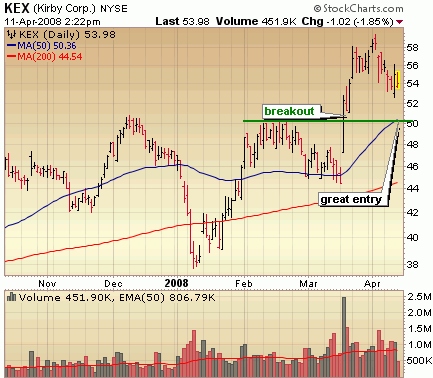
Put Kirby (KEX) on the radar as well.  It’s pulling back in a healthy manner after soaring to new all time highs with big volume.

41108_kex

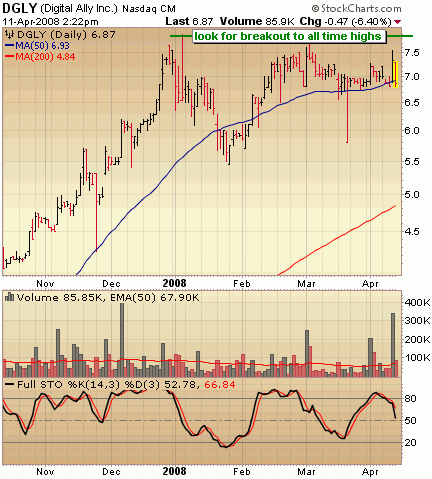
Digital Ally (DGLY) is one of the more obscure of the bunch and it didn’t hit my radar until it moved off the 50 day moving average yesterday with big volume.  The company posted its first profitable year in 2007 and has been showing huge growth in recent quarters.  Add to that great margins and ROE and you have the ingredients for a big winner.  It has yet to break out.  Set your alerts!

From MSN:

Digital Ally, Inc. produces digital video imaging and storage products for use in law enforcement and security applications. Its products include in-car digital video rear view mirror and a digital video flashlight. These products make self-contained video and audio recordings onto flash memory cards that are incorporated into the body of the digital video rear view mirror and the flashlight. It sells its products to law enforcement agencies and other security organizations and for consumer and commercial applications through direct sales and third-party distributors.

For more on Digital Ally, there is a good write up over at Seeking Alpha.

41108_dgly

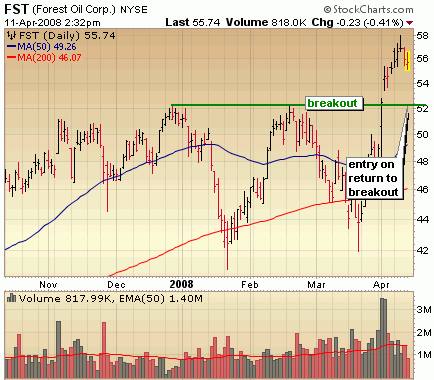
I think oil is overdone in the short term, so look for a healthy pull back in Forest Oil to the breakout point around 52 as possible entry point.

41108_fst

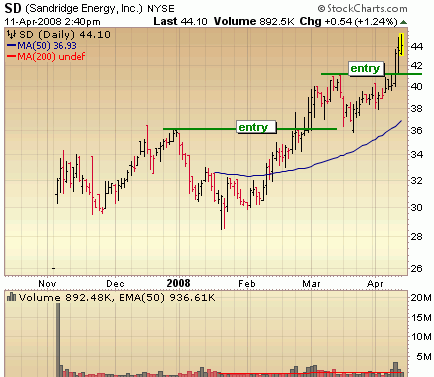
The IPO Tracker alerted me to a breakout in SandRidge Energy (SD) on Wednesday, allowing me to put on quick swing trade for a nice profit.  I still like it long term, but think it needs to digest gains a bit.  One of the better oil plays out there at least from a technical perspective.

41108_sd

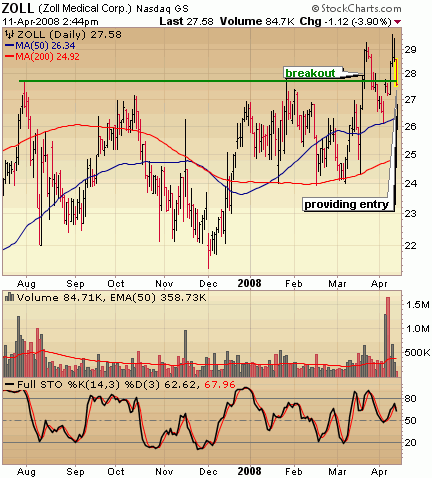
Last but not least is Zoll Medical (ZOLL).  Not quite as bullish as the rest with quite a bit of overhead resistance up to 36, but one of the safer plays.  It’s currently trading around its 52 week high and recently broke out from a base.

41108_zoll

This is one of many powerful screens that the Breakout Tracker offers.  Get it along with the IPO and ETF Tracker with the darn cheap Silver service today.
Coiling For Big Rally? Leaders With Momentum – ATW, MTL, SD, ECOL

As the market quietly digests the big gain of last Tuesday, the big story continues to be oil which hit an all time intraday high today of 112.21/barrel and held on to much of the gains to mark an all time closing high of 110.93.  The market was certainly weighed down with oil breaking out again, but overall not a bad day today.  Sell volume came in below average just as it has for the past few weeks and I think we’re still in good shape for the possibility of another big rally attempt… BUT, time is running out.  The longer we meander and don’t follow through from last Tuesday, the greater the chances of taking out new support levels which sets us up for another test of the lows of this correction.  I think the odds are greater for another leg higher and am trading accordingly.  Bad news of late has little impact on this market and when it does, there is little conviction of sellers. 

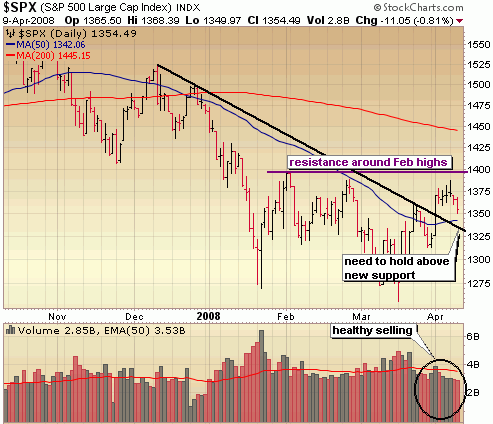
Taking a look at the S&P you see we took out the lows of the past few trading days setting up a show down with the 50 day moving average in the coming days and possibly a test of new support of the downward trend line which was broken with the big surge last Tuesday.  So, a bit more room to go on the downside before a failure of this rally is a concern. 

4908_spy

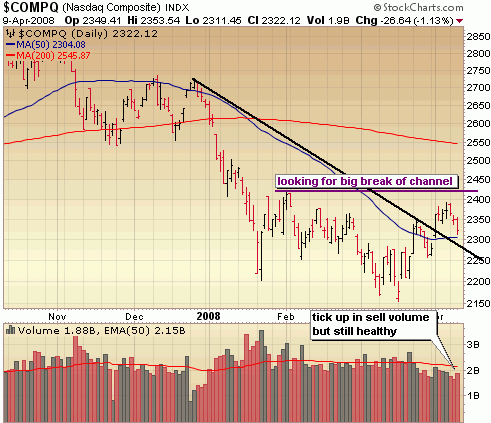
Sell volume ticked up a bit in the Nasdaq, but still came in well below average.  As far as I’m concerned a healthy day of consolidation, but a test of the 50 day moving average around 2300 is almost a given with the possibility of dropping a bit further to test new support of the downward trend and the gap of last Tuesday around 2275. 

4908_naz

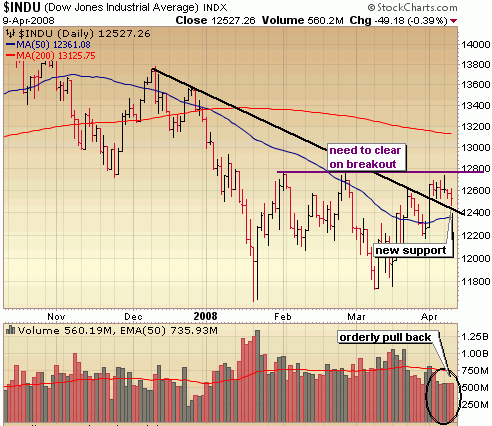
The Dow actually came very close to testing new support of the downward trend line but that was averted with a fairly impressive last hour rally today.  The critical area for the Dow is around 12400.  We need to hold above there to keep this rally intact.

4908_dow

::: Major Indices Performance – The Numbers :::

(Note: volume averages are based on the average over the past 50 days)
Data as of 4:00EST – End of Day April 9th, 2008
Nasdaq: DOWN 1.13% today with volume 1% BELOW average
Nasdaq ETF (QQQQ) DOWN 1.12%, volume 20% BELOW average
Dow: DOWN .39%, with volume 24% BELOW the average
Dow ETF (DIA): DOWN .38%, with volume 5% BELOW the average
S&P ETF (SPY): DOWN .72%,  with volume 17% BELOW the average
Russell Small Cap ETF (IWM): DOWN 1.7%, with volume 19% BELOW the average

::: SelflInvestors Leading Stocks :::

The Self Investors Leading Stocks Index is comprised of stocks in the Breakout Tracker, which is a database of the fastest growing companies near a breakout or having already broken out of a base.  There continues to be no leadership in this market and that was reflected today with Self Investors Leading Stocks down significantly more than the general market.

Summary:
* Decliners led Advancers 139 to 65
* Advancers were up an average of 1.44% today, with volume 2% ABOVE average
* Decliners were down an average of 1.88% with volume 20% BELOW the average
* The total SI Leading Stocks Index was DOWN .82% today with volume 13% BELOW average

::: Where’s the Money Flowing :::
Many investing websites provide leading industries based on price performance alone. However, without accompanying volume levels, this can sometimes be misleading.  The only way that I know of to gauge industry/sector strength WITH volume levels is through the analysis of ETF’s.  A couple years ago this was not possible, but as more traders/investors use ETF’s they become a much better tool for gauging the health of the market and seeing where the money is flowing (or not flowing).  Using the proprietary SelfInvestors Demand Indicator score which measures price and volume movements, I’m able to quickly see which sectors/industries are seeing the greatest inflows of cash.  For a detailed look at how I go about gauging sector/industry strength please see the following post: http://selfinvestors.com/si/industry_tracking/

* Current Leading Sectors/Industries (over last 30 trading days measuring price AND volume):  
Intl Utilities, Global Timber, Staples

you might be thinking.. where is oil and commodities? those sectors have shown too much distribution over the past 30 days to be considered leaders under my criteria

* Current Lagging Sectors/Industries (over last 30 trading days measuring price AND volume): 
Health Care Providers, Nuclear Energy, Networking, Aerospace/Defense

* Today’s Market Moving Industries/Sectors (UP):
Precious Metals, Oil, Commodities, Semis (liking the action in semis recently)

* Today’s Market Moving Industries/Sectors (DOWN):
Home Construction, Transports, Retail, Realty, Consumer Discretionary

::: Stocks :::

The stocks section will be an area where I highlight one stock selected from a group of stocks moving up with volume well above average and most likely breaking out of a base or consolidation.  No time to highlight a stock of the day today, but you might want to take a look at this handful of leading stocks moving up with volume today (listed in order of Total Rank – fundamentals + technicals)

Atwood Oceanics (ATW) – double bottom breakout
Mechel (MTL) – bullish triangle breakout
Sand Ridge Energy (SD) – ascending triangle breakout
American Ecology (ECOL) – breakout of nearly 2 year base
Atlas Energy (ATN) – testing all time highs

Gold Heading Lower, Natural Gas & Uranium Headed Higher? Transports Showing Leadership

Not much has happened with the major indices since my last report, so for the weekly report I thought I’d go ahead and take a look at a few ETF’s. 

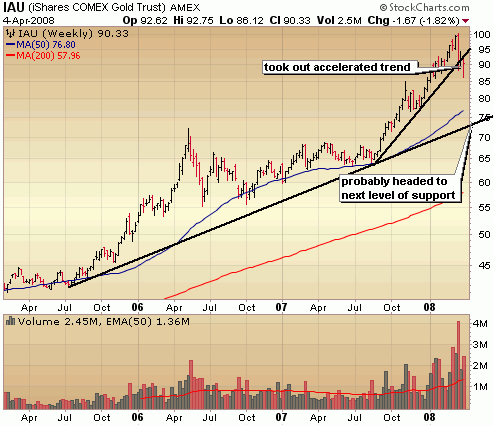
Gold, specifically the iShares Comex Gold Trust (IAU), has taken out an accelerated trend line from last summer and appears headed to the next level of support at the longer term trend line around 75 – 80.  The long overdue correction is underway.

4508_iau

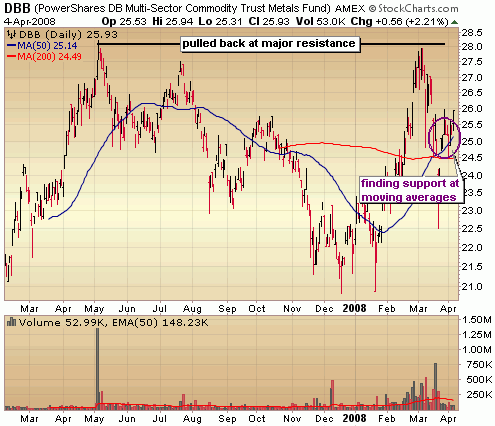
While Gold undergoes a correction, so too has the PowerShares Metals Fund (DBB) which is comprised mostly of copper, aluminum and zinc futures.  It had a tremendous run at the beginning of the year up to major resistance around the highs of last April.  It’s digested those gains in a healthy manner and is finding support around the 50 and 200 day moving averages. 

4508_dbb

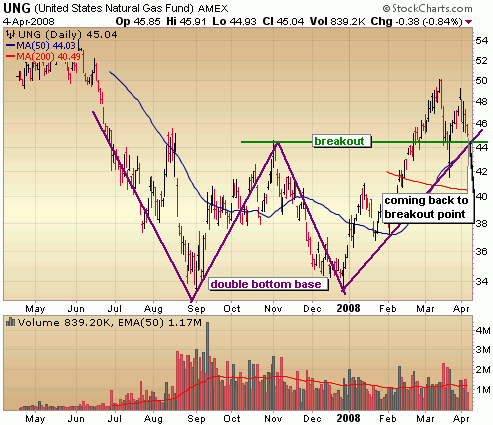
Natural gas has been red hot in 08, running up nearly 50% and is now digesting those gains.  Natural gas hasn’t had nearly the run that oil has and might soon offer a  good entry point for the long haul as it pulls back to the breakout point of a double bottom base.

I4508_ung

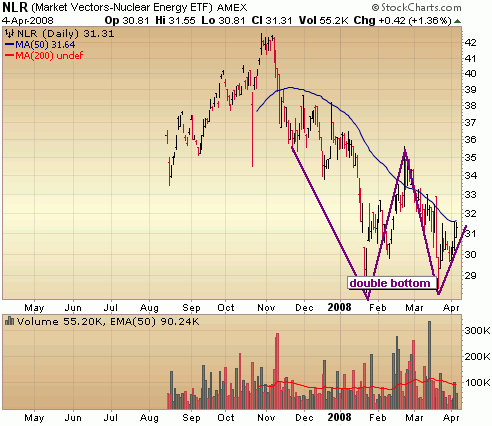
Is uranium/nuclear the next commodity/energy play to run?  That appears to be the case as it carves out the bottom of a double bottom base. 

4508_nlr

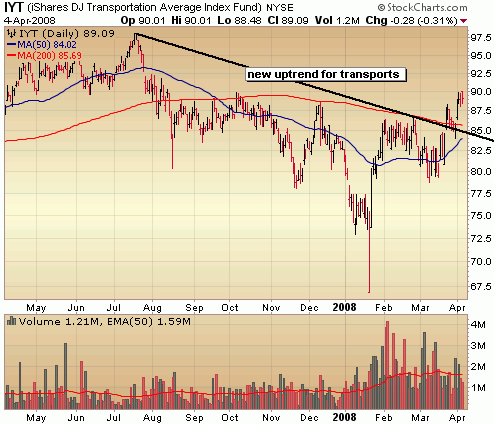
Transports, particularly trucking and railroads have done extremely well and several stocks in this space have been breaking out. Notice the Ishares DJ Transportation Fund (IYT) has begun a new uptrend.

4508_iyt

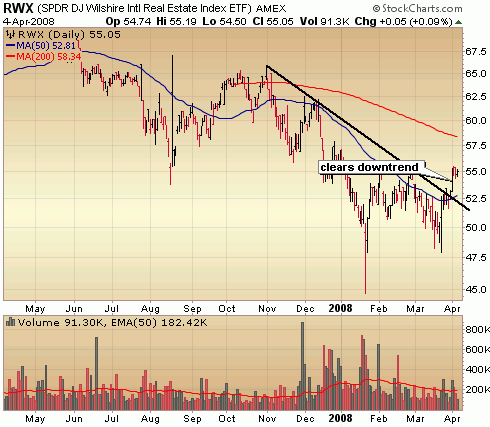
The US real estate sector has been improving, but for the long haul I like the potential of international real estate much better.  A good, diversified way to play it is with the SPDR Intl Real Estate Index (RWX), which has cleared a downtrend. 

4508_rwx

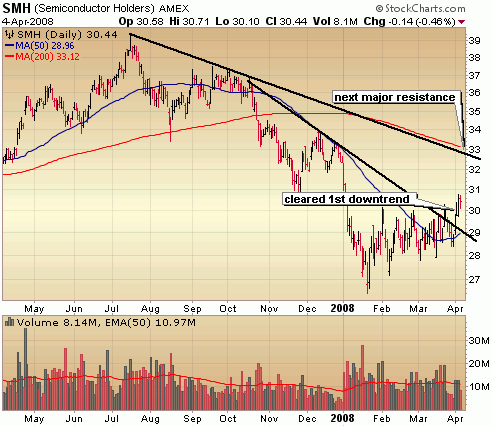
Remember the semis?  You don’t hear much about this sector anymore and with the semis still confined within a 4 year channel, it’s easy to forget about.  The Semiconductors Holders Trust (SMH) hit a nearly 4 year low in January and has cleared a short 5 month downtrend, paving the way for a test of the next level of resistance around 32 in the coming weeks/months.

4508_smh 

::: Model Portfolio :::

** This section will now appear as a separate report about every other Wednesday. 

The Self Investors Model Portolio wrapped up 2007 with a 30.2% gain.  Would you like to receive buy and sell alerts within minutes (NEW! now get them via instant messaging in near real time) of each transaction in the portfolio?  You can receive these along with ALL of the tracking tools and reports with the very popular Gold membership.  Don’t delay, get started today and join me for many more highly profitable months here at SelfInvestors.com.

::: Best/Worst Performers :::

– Top 10 Performing Industries For the Week –

1. Investment Brokerage: 39%
2. Education & Training Services: 19.85%
3. Semiconductor – Memory Chips: 16.90%
4. Processing Systems & Products: 11.60%
5. Manufactured Housing: 11.40%
6. Industrial Metals & Minerals: 11.00%
7. Credit Services:  10.05%
8. Residential Construction: 10.05%
9. Mortgage Investment: 9.50%
10. Copper: 9.30%

– Top 10 Worst Performing Industries For the Week –

1. Consumer Services: -.95%
2. Auto Manufacturers: -.70%
3. Food Wholesale: -.50%
4. Networking & Communication Devices: .10%
5. Business Equipment: .10%
6. Drug Stores: .20%
7. Medical Practitioners: .20%
8. Healthcare Info Services: .40%
9. Silver: .50%
10. Beverages – Soft Drinks: .55%

– Top 5 Best Performing ETFs For the Week –

1. Herzfeld Caribbean Basin (CUBA)  14.65%
2. iShares Home Construction (ITB) 13.80%
3. SPDR Homebuilders (XHB) 13.10%
4. Claymore China Real Estate (TAO) 11.85%
5. SPDR Metals & Mining (XME) 9.85%

– Worst 5 Performing ETF’s –

1. US Natural Gas (UNG) -5.15%
2. iPath India (INP) -3.75%
3. Indonesia Fund (IF) -3.05%
4. Malaysia Fund (MAY)  -2.95%
5. iShares Malaysia (EWM) -2.40%

:::  IPO’s Worth Watching for This Week :::

This section will now appear as a separate post on Mondays.

While 2008 should be a much slower year for IPO’s considering the deterioration of the market, there will continue to be some good companies coming to market here and there.  I’ll be highlighting the best IPO’s every Monday.

::: Upcoming Economic Reports (4/7/2008- 4/11/2008) :::

Monday:        Consumer Credit
Tuesday:       Pending Home Sales, FOMC Minutes
Wednesday:  Wholesale Inventories, Crude Inventories
Thursday:      Trade Balance, Initial Claims, Treasury Budget
Friday:            Export/Import Prices, Mich. Sentiment

::: Earnings I’m Watching This Week :::

Monday:
Alcoa (AA)

Tuesday:
Chattem (CHTT)

Thursday:
FCStone Group (FCSX), Genentech (DNA)

Friday:
Fastenal (FAST), General Electric (GE)

::: In Case You Missed It – SelfInvestors Blog Entries of the Past Week :::

1. ETF’s Showing Greatest Demand: iShares Taiwan (EWT) Breaks Out

2. Insider Buying at Ceco Environmental (CECE) Signals Another Big Run?

3. Put PUTs To Work As Insurance Against Disintermediation

4. Market Breaks Out But Volume Suspect; Stock of Day – AsiaInfo (ASIA)

5.
Visa (V) Breakout From Bullish Triangle

Visa (V) Breakout From Bullish Triangle

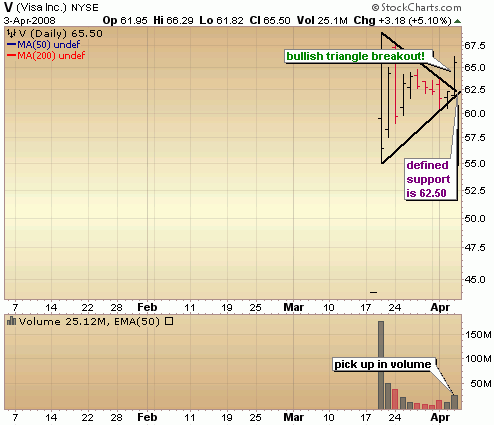
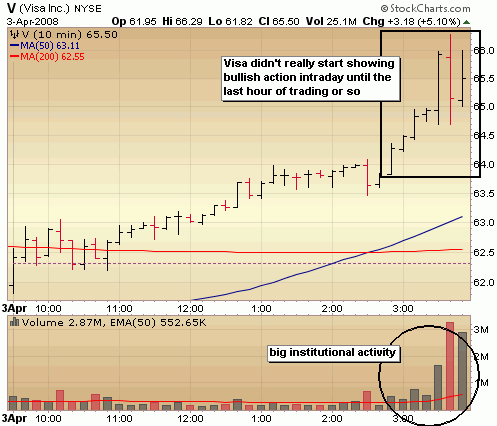
I’ve mentioned in the new IPO Community forum recently (which you can sign up for here if you haven’t), that the best way to trade new IPO’s is to wait.  You give the stock at least 2 weeks to play out and let the dust settle on the volatility.  It often doesn’t take long for the best IPO’s to break out from a bullish pattern.. often a short flat base or a triangle formation.  Today in Visa (V), after just 2 weeks of trading, the stock broke out from a bullish triangle formation pattern with a tick up in volume.  So now the lines in the sand are drawn for Visa.  Support at 62.50, with the next level of resistance at the highs of 69.

Here’s a look at the breakout from the triangle formation on the daily.

visaipo_trianglebreakout

I really didn’t get interested in trading Visa (V) for much of the day.  Although the price action was decent in Visa throughout the day, volume levels didn’t reveal that institutions were doing much buying until the last hour of trading when volume levels picked up substantially.  Granted, there was some big selling going on as well but ultimately bulls won out with a nice breakout today.  Considering support is nearby at 62.50, in my opinion it’s a good high reward, lower risk trade.

visaipo_intraday

Disclaimer:  This is not a recommend to buy or sell, but an idea for further research.  Trade according to your own tolerance for risk.  I do own a position in Visa (V).

Market Breaks Out But Volume Suspect; Stock of Day – AsiaInfo (ASIA)

The morning began with big write downs out of UBS and Deutche and LEH needed to raise 4 billion to shore up its balance sheet. Once analyst called the UBS write down a "kitchen sink job", saying "It’s a kitchen sink job. They’ve separated all their toxic waste. If they’re going to finance that then everyone is saying this is the beginning of the end; this is the last capital increase." 

Several weeks ago we’d probably be down a few hundred, but this is a different market than the pre Bear Stearns market.  On that day of the BS debacle, the character of this market changed from one that focused on the bad news to one that rallied on any positives.  The market always prices in future events and when the bad news flows day after day, week after week, eventually you hit a tipping point where it’s clear that much of it has been priced in.  That’s why in the case of an individual stock, it rallies before a company begins reporting big earnings and sales growth numbers and falters well before the fundamentals crack.  I’ve said it many times before here and I’ll say it again:  stock charts are the best leading indicators.

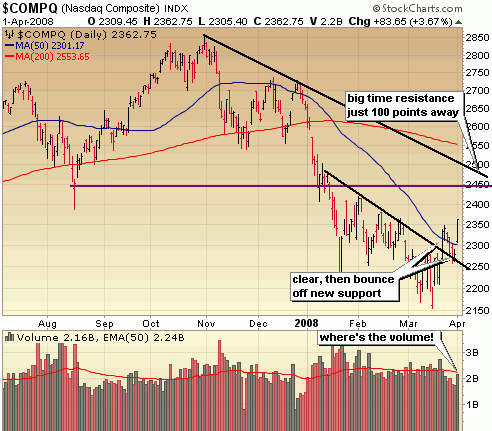
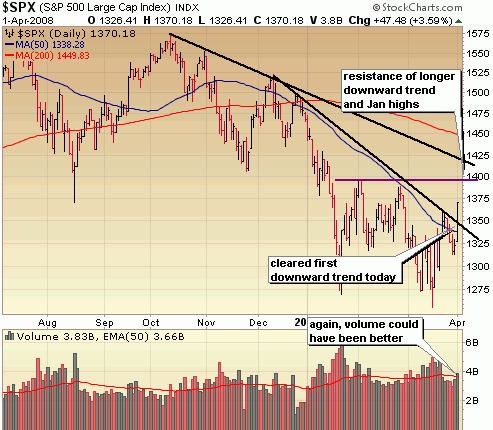
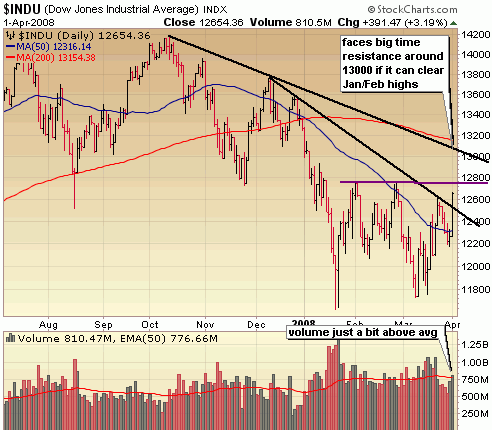
We’ve been in this mode for a couple of weeks now and I think today was another good reminder of that, but was today as bullistic (I know it’s not a word but I like it and I’m using it) as it appeared to be?  Yes and no.  Yes on price, no on volume and leading stock moves.  Technically, today could be considered an accumulation day because volume levels came in higher than the day before, but with the market up 3.5% I want to see HUGE volume indicating that institutions are buying hand over fist.  This looked more like mad scrambling short covering to me.  In addition, there were very few leading stock breakouts on my radar today.  In fact there were very few leading stocks moving with volume period!  There is some room to run given the magnitude of today’s move, but I would absolutely not be chasing stocks on the long side.  If you didn’t add long positions on the pull backs in recent days it’s probably best to remain patient for another pull back.  You will get your chance.  This is still  a bear market and as you’ll see in the charts below, we’re still well within a major bearish downtrend.

The Nasdaq has a bit more breathing room to run before hitting major resistance, than do the Dow or S&P.  Notice that volume actually came in a touch below average.  That is very surprising considering today’s price move.  The big fellas were not doing any major buying today.

4108_naz

Volume came in a bit better in the financials dominated S&P, but not exactly impressive.  Today’s move clears the way for a move to the next level of resistance around 1400 – 1415 which is right around the area of the bear downtrend.  It isn’t far away so I wouldn’t be getting aggressive on the long side here.

4108_sp

Lots of major resistance ahead for the Dow as well.  If it can clear the Jan/Feb highs, it won’t be long before it runs smack into major resistance of the downward trend around 13,000.

4108_dow1 


::: Major Indices Performance – The Numbers :::

(Note: volume averages are based on the average over the past 50 days)
Data as of 4:00EST – End of Day April 1st 2008
Nasdaq: UP 3.67% today with volume 1% BELOW average
Nasdaq ETF (QQQQ) 4.28%, volume 23% BELOW average
Dow: UP 3.19%, with volume 5% ABOVE the average
Dow ETF (DIA): UP 3%, with volume 18% ABOVE the average
S&P ETF (SPY): UP 3.52%,  with volume 4% BELOW the average
Russell Small Cap ETF (IWM): UP 3.66%, with volume 33% BELOW the average

::: SelflInvestors Leading Stocks :::

The Self Investors Leading Stocks Index is comprised of stocks in the Breakout Tracker, which is a database of the fastest growing companies near a breakout or having already broken out of a base.  Leading stocks significantly underperformed the major indices today as beaten down stocks saw much of the gains today.

Summary:
* Advancers led Decliners 160 to 31
* Advancers were up an average of 3.57% today, with volume 6% ABOVE average
* Decliners were down an average of 1.88% with volume 44% ABOVE the average
* The total SI Leading Stocks Index was UP 2.68% today with volume 12% ABOVE average

::: Where’s the Money Flowing :::

Many investing websites provide leading industries based on price performance alone. However, without accompanying volume levels, this can sometimes be misleading.  The only way that I know of to gauge industry/sector strength WITH volume levels is through the analysis of ETF’s.  A couple years ago this was not possible, but as more traders/investors use ETF’s they become a much better tool for gauging the health of the market and seeing where the money is flowing (or not flowing).  Using the proprietary SelfInvestors Demand Indicator score which measures price and volume movements, I’m able to quickly see which sectors/industries are seeing the greatest inflows of cash.  For a detailed look at how I go about gauging sector/industry strength please see the following post: http://selfinvestors.com/si/industry_tracking/

* Current Leading Sectors/Industries (over last 30 trading days):  
Internet Infrastructure, Homebuilders, Intl Utilities, REIT, Biotech, Transports

* Current Lagging Sectors/Industries (over last 30 trading days):  
Health Care Providers, Coal, Clean Energy, Utilities

* Today’s Market Moving Industries/Sectors (UP):
Financials, Real Estate, Broker Dealers, Homebuilders, Semis

* Today’s Market Moving Industries/Sectors (DOWN): 
Gold

::: Stocks :::

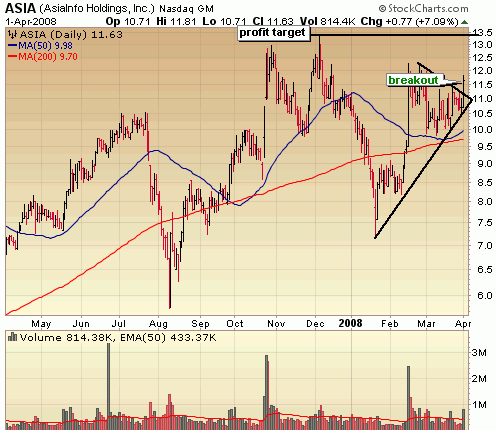
The stocks section will be an area where I highlight one stock selected from a group of stocks moving up with volume well above average and most likely breaking out of a base or consolidation.  It’s been many weeks since I featured a Stock of the Day.  The last was BCPC several weeks ago and before that PRXL.  The market just hasn’t yielded many high quality breakouts over the past few months.  Even with today’s big market move, there were just two leading stock breakouts in my database today – AsiaInfo Holdings (ASIA) & Intuitive Surgical (ISRG).  I like to highlight stocks that are relatively off the radar in this section so tonight I take a look at ASIA.

ABOUT:

Asiainfo Holdings, Inc. (AsiaInfo) provides telecommunications software solutions and information technology (IT) security products and services in China. The Company’s operations are organized into two divisions: AsiaInfo Technologies and Lenovo-AsiaInfo. AsiaInfo Technologies encompasses the Company’s traditional telecommunications business and provides software and solutions to China’s telecommunications carriers, while Lenovo-AsiaInfo provides IT security products and services. During the year ended December 31, 2007, approximately 86% of the CompanyGÇÖs total revenue was contributed by AsiaInfo Technologies, while the remaining revenue was contributed by Lenovo-AsiaInfo. On October 15, 2007, the Company acquired telecommunications Business Support Systems business (BSS), of Shenzhen Modern Computer Manufacturer Co., Ltd.

FUNDAMENTALS: 
ASIA is a company with a fairly erratic history which resulted in a loss in 2005.  Since that time, the company has bounced back with excellent growth in the last 2 years.  Earnings jumped from a loss of .02/share in 05 to a gain of .16/share in 2006 and a near tripling of profits in 2007 with .45/share.  Growth is expected to moderate a bit in 08 and 09 but remain very strong at 20 – 30%.  While ROE isn’t outstanding at about 11%, it has been rising in the past couple years and continues to do so.  Net margins are quite good at about 15%.  Management ownership looks good at 25% and many institutions are adding initial positions

TECHNICAL:

ASIA has really rocketed off the January lows and carved out the right side of a steep, V like cup with handle base.  I don’t particularly like sharp bases like this but given the healthy volume levels throughout the base and a healthy breakout from a 6 week consolidation today, I think this stock is good for a trade and poised to test the December highs above 13.  This is an area I’m looking to take profits.  Usually, I’d hold leading breakout stocks longer, but we’re still in a bear market and this isn’t the best looking base around.

4108_asia

SELFINVESTORS RATING: With a total score of 49/60 (25/30 for fundamentals, 24/30 for technical), AsiaInfo (ASIA) is a good SelfInvestors leading stock and should be near the top of any watch list.

Full Disclosure/Disclaimer: The stock of the day is by no means a buy recommendation.  Please do your own research and make a personal decision based on your own tolerance for risk.  I currently do own a position in AsiaInfo Holdings (ASIA)

Insider Buying at Ceco Environmental (CECE) Signals Another Big Run?

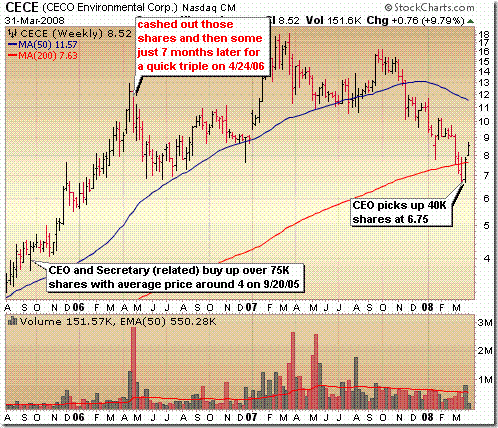
Insiders are at it again over at Ceco Environmental (CECE).  The last time the CEO and the Secretary (they are related) bought up shares, the stock tripled in just seven months.  On September 20th, 2005, CEO Phillip Dezwirek and Secretary Jason Dezwirek bought up a combined 77,799 shares (if you include purchases made by the investment firm Icarus, of which they co-own) for around 4/share.  Less than 7 months later, they both cashed out on that purchase and then some by unloading 100,000 shares at the near top of the run at 12/share for a quick triple.  More than 600K profit in a few months time.  It should be noted that we are talking about less than 10% of their entire holdings, so it’s not like they were making large bets on the company. 

After cashing out in April of 2006, it would be more than 2 years before another insider purchase was made by either Phillip or Jason.  One week ago, CEO Phillip Dezwirek decided it was buy time again and picked up 40K shares on March 24/25th at around 6.75.  Is it any coincidence that just one week later, the company announced 33 new orders, each valued at more than 200K?  I think not. 


33108_cece

ETF’s Showing Greatest Demand: iShares Taiwan (EWT) Breaks Out

Tracking ETF’s is a great way to track the flow of big money and spot sector/industry rotation.  It’s said that half the move in a stock is directly related to the health of the industry it’s in, so sticking to stocks in industries where the money is flowing keeps you outperforming!  Of course, you could just trade the ETF for better diversification. 

The following table is a portion of the ETF Tracker, a Self Investors database which tracks only the most liquid ETF’s (currently about 200).  It’s sorted by DI 15 which is a Demand Indicator score over 15 trading days.  It measures the demand in an ETF by using price and volume data. 

Ticker

Name

Description Current
Price
Price
%
Change
Vol
%Chg
DI
15
DI
30
% From
50 DMA
% From
200 DMA
SMN ProShares Ultra Short Basic Materials Basic Materials Short 2x 38.16 -1.67 12 41 44 -9.49 -18.53
UYG ProShares Ultra Financials Financials Long 2x 31.59 -6.51 141 35 28 -6.92 -35.48
DUG ProShares Ultra Short Oil & Gas Oil & Gas Short 2x 38.55 -3.14 66 34 33 -7.33 -9.89
TAO Claymore China Real Estate China Real Estate 19.15 0.26 -79 26 27 -9.24 -9.24
IIH HLDRS Internet Infrastructure Internet Infrastructure 5.53 -1.25 -84 18 19 1.28 2.98
EFU ProShares Ultra Short MSCI Emerging Markets Short 2x 85.59 -0.09 -46 17 19 -3.66 5.99
ITB IShares Home Construction Home Construction 19.54 -6.73 143 17 17 6.72 -10.9
EWT Ishares Taiwan Taiwan 16.47 -2.43 21 14 20 11.74 6.67
MVV ProShares Ultra Midcap Midcaps Long 2x 64.53 -1.99 4 13 15 -1.63 -21.39
URE ProShares Ultra Real Estate Real Estate Long 2x 33.44 -6.2 28 12 17 7.46 -17.25
XHB SPDR Homebuilders Home Builders 21.55 -5.9 38 11 15 6.84 -5.94
IGM Ishares Technology Technology 51.84 -0.86 -74 11 15 1.55 -8.46
IGW Ishares Semis Semiconductors 51.07 -1.07 194 10 23 0.69 -16.02

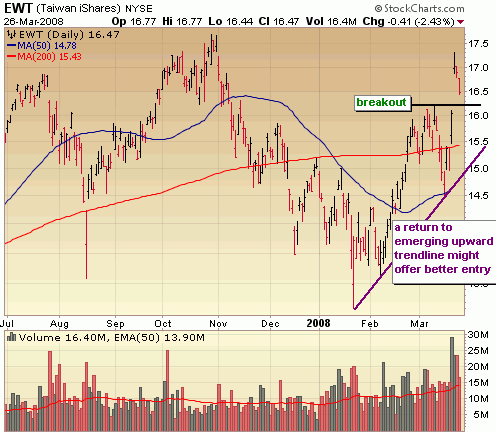
Notice that only 2 ETF’s are above both moving averages, the Internet Holders Trust (IIH) and the iShares Taiwan (EWT).  IIH is a bit too illiquid for my taste (trades just under 40K shares a day) but Taiwan looks great and recently broke out on news of victory for the opposition party, the Kuomintang (KMT) which is expected to repair relations with China.  It’s overbought in the short term though and I’d be looking at an entry on a return to the trendline in purple

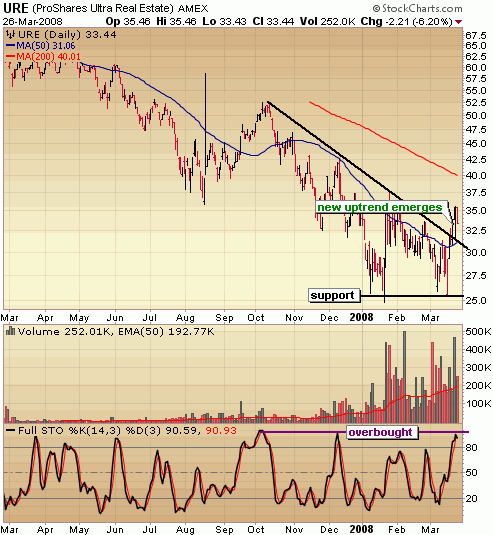
All the other ETF’s listed are coming off bottoms, but are also a bit overbought in the short term.  I’m really liking the leveraged ProShares Ultra Real Estate ETF (URE) and a pull back to around 30 would offer a decent entry for the long haul.  I just want to see stochastics get more neutral at least and preferably in oversold territory. 

The ETF Tracker is one of  3 great tracking systems that Self Investors provides.  Breakout Stocks and IPO Trackers are also available to Silver, Gold and Platinum members.  See all membership options here.  Your support of my independent research and tools with the purchase of premium memberships is greatly appreciated 🙂

Disclaimer:  I personally own a position in DUG.  None of the ETF’s mentioned above are recommendations to buy.  Please do your own research.

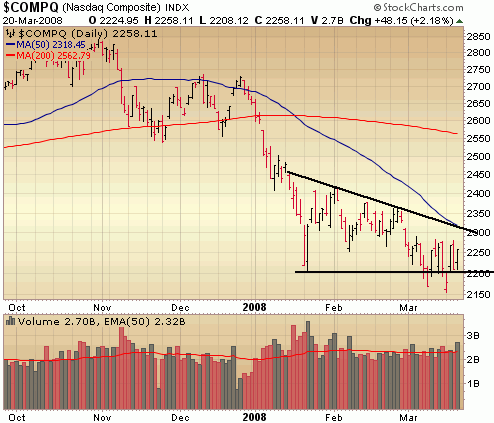
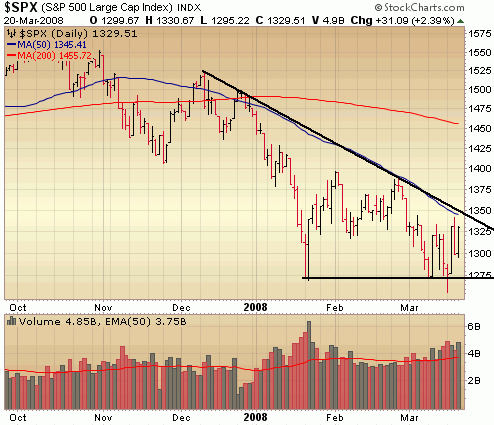
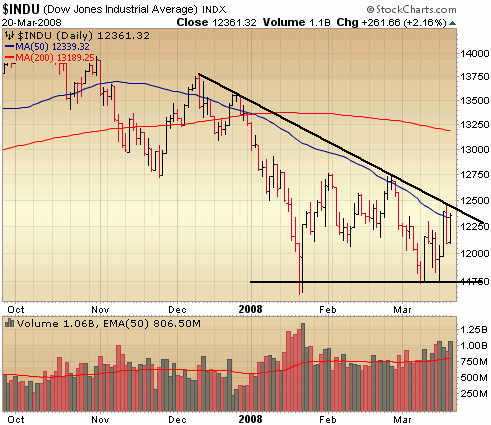
Despite Market March Madness, Indices Remain In Trading Range

It’s Easter, the best tournament of any sport at any level is on and I’m not in the mood to dissect the market today.  I’ll keep it short with charts.  Happy Easter all.

 Despite all the news and the wild swings we’re still in a trading range and waiting for an explosive move in either direction.  I’m leaning toward an explosive move to the upside very soon and it won’t be led by commodities!


::: Model Portfolio :::

** This section will now appear as a separate report to be published every other Wednesday

Following a 27.6% return in 2006 and a 30.2% return in 2007, the Self Investors Model Portfolio maintains an annualized return of 24.5% since inception in 2004.  Would you like to receive buy and sell alerts within minutes (NEW! now get them via instant messaging in near real time) of each transaction in the portfolio?  You can receive these along with ALL of the tracking tools and reports with the very popular Gold membership.  Don’t delay, get started today and join me for many more highly profitable months here at SelfInvestors.com.

::: Best/Worst Performers :::

– Top 10 Performing Industries For the Week –

1. Mortgage Investment: 36.75%
2. Residential Construction: 8.25
%
3. Surety & Title Insurance: 8.20%
4. Home Furnishing Stores: 7.90%
5. Auto Dealerships: 7.30%
6. Catalog & Mail Order Houses: 7.25%
7. REIT – Healthcare Facilities:  7.25%
8. Sporting Goods Stores: 7.15%
9. Department Stores: 6.80%
10. Home Improvement Stores: 6.45%

– Top 10 Worst Performing Industries For the Week –

1. Gold: -16.00%
2. Silver: -13.50%
3. Copper: -11.85%
4. Industrial Metals & Minerals: -11.80
6. Independent Oil & Gas: -10.35%
7. Aluminum: -10.30%
8. Agricultural Chemicals: -10.10%
9. Oil & Gas Drilling & Exploration: -8.65%
10. Nonmetallic Mineral & Mining: -8.60%

– Top 5 Best Performing ETFs For the Week –
 
1. SPDR Homebuilders (XHB) 9.10%
2. HLDRS Regional Banks (URE) 8.55%
3. iShares Home Construction (ITB)  8.10%
4. Powershares Dynamic Banking (PJB) 7.40%
5. iShares Realty (ICF) 7.30%

– Worst 5 Performing ETF’s –

1. iShares Silver (SLV) -18.15%
2. 
Powershares Agriculture (DBA) -15.20%
3. Market Vectors Gold Miners (GDX) -14.75%
4. Central Fund of Canada (EWM)
 -14.35%
5. Asa Gold (ASA) -13.95%

:::  IPO’s Worth Watching for This Week :::

This section will now appear as a separate post on Mondays (if there are some interesting IPO’s coming to market).

While 2008 should be a much slower year for IPO’s considering the deterioration of the market, there will continue to be some good companies coming to market here and there.  I’ll be highlighting the best IPO’s every Monday.

::: Upcoming Economic Reports (3/24/08 – 3/28/08) :::

Monday:         Existing Home Sales
Tuesday:       Consumer Confidence
Wednesday:  Crude Inventories, Durable Orders, New Home Sales
Thursday:      GDP – Final, Initial Claims
Friday:            Personal Income/Spending, Core PCE Inflation

::: Earnings I’m Watching This Week :::

Tuesday:
Neogen (NEOG)

Wednesday:
China Sunergy (CSUN), Oracle (ORCL)

Thursday:
Accenture (ACN), Apollo Group (APOL), Lennar (LEN)

Friday:
KB Homes (KBH)

Model Portfolio Update: Down But Not Out

It’s been a few weeks since my last Self Investors Model Portfolio update, but now that the IPO Community is up and running for the most part I’ll have more time to dedicate to the blog.  I haven’t been doing too much trading since the last update, choosing to remain in a large cash position while  cutting losses and locking in gains quickly on a few positions.  It’s just difficult to make any head way in this volatile market, so my strategy is to just chip away at the losses that my big cap holdings in Google, Cisco and Microsoft have handed me.  I’ve been relatively successful with the strategy of playing both sides of the market and have gained significant ground on the S&P in recent weeks with gains in AUY (17%), FCSX (9%), CYNO (14%), HCBK (8%), CLHB (9%), PWRD (8%), TOL (8%) and DHI (10%).  Not large gains, but you take ’em where you can get ’em in this environment.  For much of the year, I had been lagging the S&P by a few percentage points but have made up significant ground and am now outperforming the S&P by 3%.  The losses are still there and a bit of a hole to dig out of if I’m going to repeat my performance of last year, but I’ve remained patient for the right time to get more aggressive and am confident I’ll greatly outperform the S&P again this year.

I did get a bit more aggressive today and added a few long positions with the big pull back.  In fact, I added more long positions today than I have in several months.  I just like the way the market reacted to the Bear Stearns situation and managed to hold at the January lows.  We were overbought in the short term with the indices hitting some short term resistance, so today’s pull back wasn’t too surprising and the lack of severity in the volume indicated a good spot to dabble in a few longs.  If I’m wrong I’m out with small losses and riding my 2 short plays down.

I now offer buy and sell alerts in the Model Portfolio through Yahoo or MSN instant messenger.  If interested in tracking my trades in near real time along with the IPO, ETF and breakout stock tracking features, the Gold membership here might be right for you.  Your membership is greatly appreciated and helps to support the long hours of research and implementation of new features and products.  Thank you.

Existing members may upgrade their accounts here.
New members may create a new account here.