Trade of the Day – Score With Stripper Stocks: VCG Holdings (PTT)

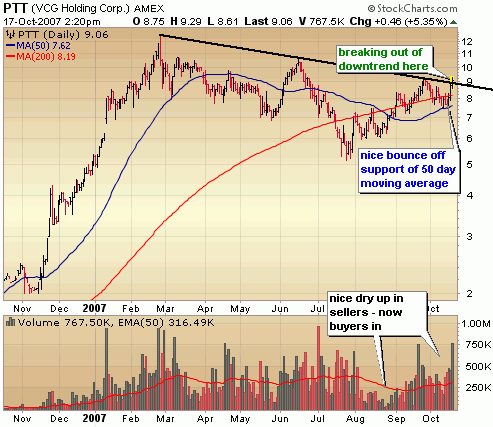
The stripper stocks (for those into political correctness the "adult entertainment providers") have been getting their move on to the upside of late with Rick’s Cabaret (RICK) in pole position and leading the way.  I alerted premium members to a purchase in the Model Portfolio a couple weeks ago and it’s been a great performer ever since.  Not far behind is VCG Holdings (PTT) another stripper stock busting out here above a long downward trend and hungry for more.  There isn’t any resistance until it hits 12 so quite a bit of room to run. 

Hey even Playboy (PLA) is bouncing and worth a look ๐Ÿ™‚


More Distribution & Broken Trend Lines

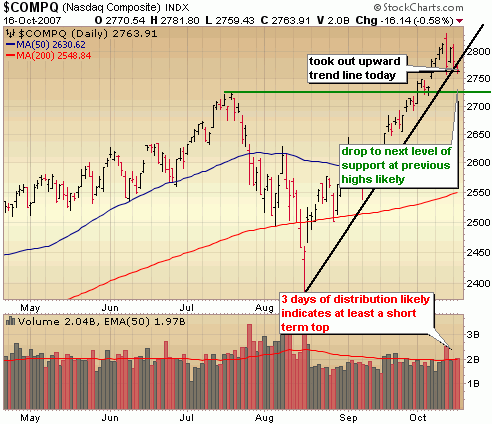
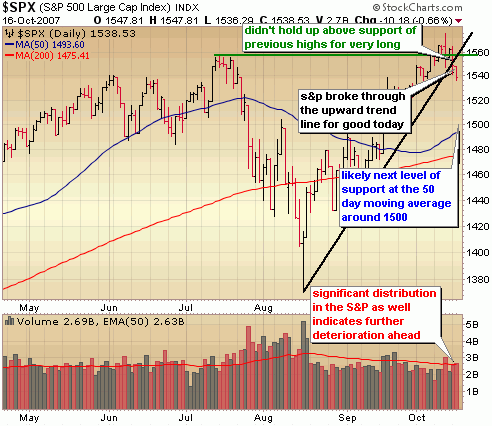
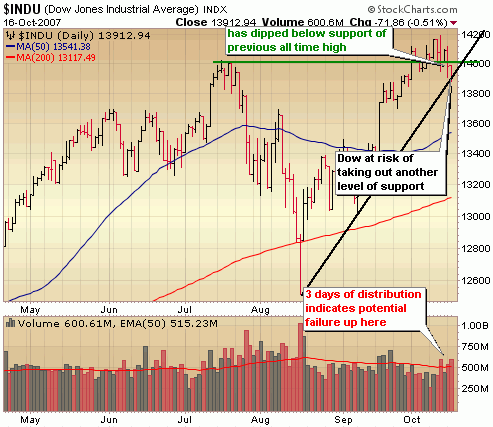
The credit woes that plagued the market in August got a bit of reprieve following the euphoria of the big Fed rate cut, but stark reminders are emerging within the financial statements of financial companies as  they begin reporting earnings.  The ramp up in oil prices may be finally be causing some concern as well.  From my perspective the reasons for selling don’t matter much though.  All I’m concerned with is price and volume movement and support/resistance levels.  We can all debate until we’re blue in the face how severe the credit woes are or how long housing will remain mired in a slump or at what point oil prices become a major concern for the economy.  What stands out to me most is the high volume reversal of last Thursday and subsequent back to back distribution days yesterday and today resulting in a break of the upward trend lines of the major indices.  The action indicates a top at least temporarily.  In my after market report last Thursday, I discussed the major resistance area of the Nasdaq but after re-reading what I wrote I realized that I didn’t highlight the selling intensity as well as I should have.  It was very important, topping like action and I should have centered around that more than I did.  The bottom line is that all indications point to further deterioration in the coming weeks.  Preserve that capital and consider locking in profits quicker.

Note the big intraday reversal in the Nasdaq on Oct 11th.  The intraday high on that day just happened to touch major resistance at the top of a long upward trend.  Coincidence?  No way.  Today we broke through a steep shorter term upward trend line and there is a good chance that the Nasdaq will deteriorate further and test the next level of support at those July highs around 2725.

The S&P wasn’t able to hold above the July highs very long and broke through its own upward trend line for good today with some significant volume behind it.  While the selling wasn’t particularly intense today, it does mark the 3rd day of distribution in just the last 4 trading days.  There isn’t any major support from here until we get to around 1500 so there is some room left to the downside from here.

The Dow is hanging on by a thread at support of its upward trend line but volume levels indicate that won’t last long.  I think we’ll at the very least test 13600 in the coming days.

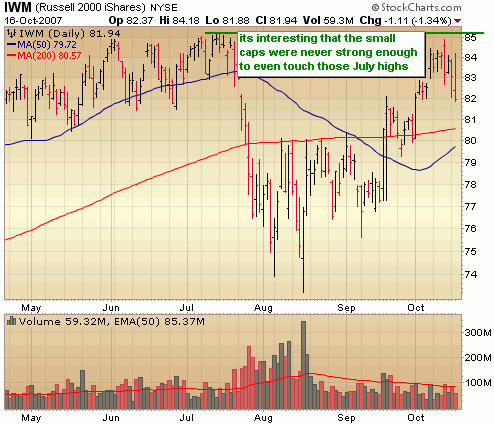
It’s interesting that the Russell never touched the July highs.

::: Major Indices Performance – The Numbers :::

(Note: volume averages are based on the average over the past 50 days)
Data as of 4:00EST – End of Day October 16th 2007

Nasdaq: DOWN .58% today with volume 2% ABOVE  average
Nasdaq ETF (QQQQ) DOWN .47%, volume 52% ABOVE average
Dow: DOWN .51%, with volume 17% ABOVE the average
Dow ETF (DIA): DOWN ..61%, volume 10% BELOW the average
S&P ETF (SPY): DOWN .79%, volume 12% BELOW the average
Russell Small Cap ETF (IWM): DOWN 1.1%, volume 42% BELOW the average

::: SelflInvestors Leading Stocks :::

The Self Investors Leading Stocks Index is comprised of stocks in the Breakout Tracker, which is a database of the fastest growing companies near a breakout or having already broken out of a base.  Today’s selling wasn’t particularly intense as indicated by the action in leading stocks.  Volume levels did not indicate institutions were dumping large numbers of shares.

Summary:

* Decliners led Advancers 251 to 112
* Advancers were up an average of 1.46% today, with volume 3% ABOVE average
* Decliners were down an average of 1.94% with volume 4% BELOW average
* The total SI Leading Stocks Index was DOWN .89% today with volume 2% BELOW average

::: Where’s the Money Flowing :::

Many investing websites provide leading industries based on price performance alone. However, without accompanying volume levels, this can sometimes be misleading.  The only way that I know of to gauge industry/sector strength WITH volume levels is through the analysis of ETF’s.  A couple years ago this was not possible, but as more traders/investors use ETF’s they become a much better tool for gauging the health of the market and seeing where the money is flowing (or not flowing).  Using the proprietary SelfInvestors Demand Indicator score which measures price and volume movements, I’m able to quickly see which sectors/industries are seeing the greatest inflows of cash.  For a detailed look at how I go about gauging sector/industry strength please see the following post: http://selfinvestors.com/si/industry_tracking/

* Current Leading Sectors/Industries (over last 30 trading days):  
Gold,  Internet Infrastructure, Gold Miners, Software, Agriculture
                                          
* Current Lagging Sectors/Industries (over last 30 trading days): 
Retail, Homebuilders, Semis

* Today’s Market Moving Industries/Sectors (UP):
Oil

* Today’s Market Moving Industries/Sectors (DOWN):
Home Construction, Biotech, Internet, Financial, Realty, Oil & Gas Services (fairly broad selling today)

::: Stocks :::

The stocks section will be an area where I highlight one stock selected from a group of stocks moving up with volume well above average and most likely breaking out of a base or consolidation.  Sorry, short on time tonight so no stock of the day today but you might like to have a look at these leading stocks that above the 50 and 200 day moving averages and moved up with significant volume today:

QMAR, LULU, RICK, TEF, ESLT, DAR, SOLF and RVBD

A Silver Membership at SelfInvestors for just $19.95/month gets you all the tracking tools for leading stocks, IPO’s and ETF’s!  More details here.

Breakout Stocks Highlights! China, Shipping & Oil

Hola fellow earthlings.  It’s time again for another extraordinary edition of the breakouts stocks review.   With the Dow and S&P in unchartered territory comes breakouts and lots of them.  The highest of the high quality breakouts were made in China and the shippers didn’t fare too badly either.

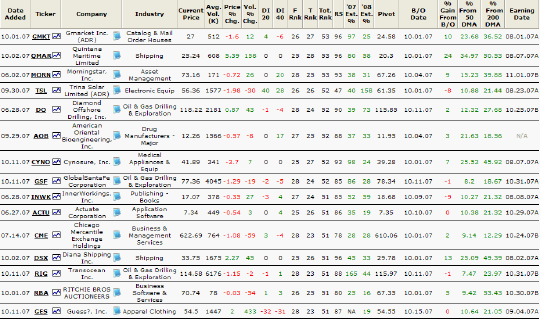
As always, please click on the image below for an enhanced "eyeball ready" version of the breakouts list.
If you’re at all curious about how the Breakout Tracker was put together and what all that data means here’s a good resource: A detailed look at all the Breakout Tracker data.

Over the past few weeks there were an unusually high number of high quality breakouts.  This is just an appetizer.. the full, all you can eat buffet of breakouts is provided to the appreciated people who support my research with a kind donation from time to time.

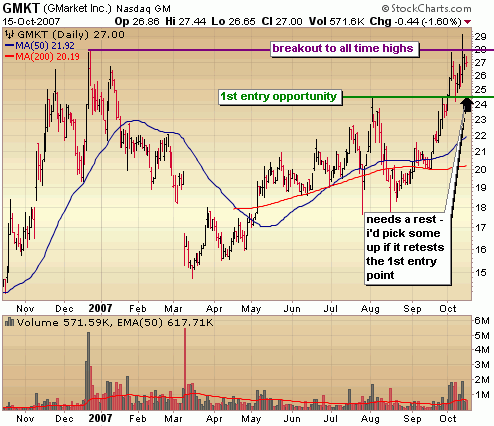
At the top of the list we begin with.. I thought that was a China play! No,  Gmarket (GMKT) hails from the freedom loving, tech savvy  nation of South Korea.  Either way, this is a company with tremendous growth since posting profitability in 2005.  The stock went public in summer of ’06 and provided the first opportunity to get in after breaking out just a couple months later in October.  It’s October once again and the stock is up to its old tricks, breaking out with a vengeance.  It offered the first entry opportunity on a break above the handle formation of a cup with handle formation .10 above the pivot point at 24.58 on October.1st.  Since then it’s gone on to bust out to new all time highs.  Considering the run it’s had and the vulnerability of the overall market right now, I’d be patient with this one if you don’t already have a position.  I personally don’t own a position and will wait for a pull back to around the first point of entry which would provide a good lower risk entry.

There were China breakouts in the past 2 weeks.. really there were.  Check out Trina Solar (TSL) but don’t be fooled into thinking that’s the best China solar play.  That award belongs to JA Solar (JASO), which broke out at the end of September.  Another China breakout on the list is medicinal plant producer [Medicinal plant producer makes it sounds like they grow grass.  Let me rephrase that.  Developer of plant based pharmaceutical and nutraceutical products.  Ok, now they sound legit.] American Oriental Bioeng (AOB), one of the few China plays that doesn’t sport an "off the charts" valuation.    It looks like it might pull back a bit more here, so keep an eye on it for another entry point (it broke out at 11.95 from a double bottom base).

..and how about those Greek Shippers!  Quintana Maritime (QMAR) and Diane Shipping (DSX) were both featured as trades of the day on October 2nd as they busted out to new all time highs.

Last but not least, you have to pay attention to a few of the highest rated oil breakouts over the past couple weeks – Diamond Offshore (DO), GlobalSanaFe (GSF) and Transocean (RIG).  Is it any coincidence that all three are offshore drillers? NO!  These guys find oil under hundreds of miles of ocean water.  Barrier to entry.  Stronger than the US/Mexico border.  Profit margins through the roof.  Your profits over time .. not too shabby.

Disclaimer: The only stock I currently own personally is Diana Shipping (DSX) but am considering them all for purchase in the future.

Avalanche of Earnings Begins; Another China IPO – Noah Education (NED)

It’s been a busy weekend for me so no market analysis this weekend.  I’ll have an update on the technicals mid next week. 

::: Best/Worst Performers :::

– Top 10 Performing Industries For the Week –

1. Nonmetallic Mineral Mining: 9.15%
2. Copper: 7.65%
3. Oil & Gas – Independent: 6.40%
4. Agricultural Chemicals: 6.30%
5. Gold: 6.25%
6. Silver: 6.05%
7. Oil & Gas Major Integrated:  5.55%
8. Industrial Metals & Minerals: 8.30%
9. Oil & Gas Equipment & Services: 4.95%
10. Data Storage Devices: 4.70%

– Top 10 Worst Performing Industries For the Week –

1. Semiconductor – Memory: -5.05%
2. Office Supplies: -5.00%
3. Toy & Hobby Stores -4.90%
4. Consumer Services: -4.20%
5. Semiconductor – Specialized: -4.00%
6. Banks – SE: -3.70%
7. Apparel – Clothing: -3.65%
8. Home Health Care: -3.25%
9. Banks – Pacific: -3.25%
10. Semiconductors – Integrated: -3.15%

– Top 5 Best Performing ETFs For the Week –
 
1. Internet Infrastructure  (IIH)  12.05%
2. Ishares China (FXI) 5.90%
3. India Fund (IFN) 5.35%
4. Central European & Russia Fund (CEE) 5.15%
5. Market Vectors Gold Miners  (GDX) 4.85%

– Worst 5 Performing ETF’s –

The China Funds are beginning to crack a bit with distribution over the past 2 weeks.

1. Greater China Fund  (GCH)  -9.10%
2. HLDRS Semis (SMH) -5.50%
3. Turkish Investment Fund (TKF)  -4.70%
4. Ishares Home Construction (ITB) -4.65%
5. Morgan Stanley China (CAF)  -3.60%

:::  IPO’s Worth Watching for This Week :::

Just one IPO  worth watching this week and  it’s another China IPO – Noah Education Holdings (NED)

1. Noah Education Holdings (NED): a leading provider of interactive education content in China.  Develops and markets interactive, multimedia learning materials mainly to complement prescribed textbooks used in China’s primary and secondary school curriculum, covering subjects such as English, Chinese, mathematics, physics, chemistry, biology, geography, political science and history. They deliver content primarily through hand held digital learning devices, or DLDs, into which the content is embedded or subsequently downloaded at over 8,500 points of sale, approximately 2,000 download centers, or through the website, www.noahedu.com. In addition, they sell electronic dictionaries, or E-dictionaries. In July 2007, the company began offering after-school tutoring programs as they build upon experience and brand to capture more market opportunities in the supplemental education market..  Trading set to begin on Friday.

::: Upcoming Economic Reports (10/15/07 – 10/19/07) :::

Monday:         None
Tuesday:       Industrial Production, Capacity Utilization
Wednesday: CPI, Housing Starts, Building Permits, Crude Inventories, Fed Beige Book
Thursday:      Leading Indicators, Initial Claims
Friday:            None

::: Upcoming Notable Earnings Reports :::

Earnings Season Kicks Off In Full Force This Week!

Monday:  New Oriental Education (EDU), Nuveen Investments (JNC), Citigroup (C), Genentech (DNA)

Tuesday: Intel (INTC), Wells Fargo (WFC), Yahoo (YHOO)

Wednesday: Noble (NE), NVE Corp (NVEC), Ebay (EBAY), BlackRock (BLK), Altria (MO), Cavium Neworks (CAVM)
                        JP Morgan (JPM), Washington Mutual (WM)

Thursday:  Google (GOOG), Ametek (AME), Intuitive Surgical (ISRG), Sunpower (SPWR), Gilead Sciences (GILD)
                    Bank of America (BAC), Capital One Financial (COF),

Friday: Caterpillar (CAT), Schlumberger (SLB), 3M (MMM),

::: In Case You Missed It – SelfInvestors Blog Entries of the Past Week :::

1 .An Excuse to Sell; Smorgasbord Of Leading Stocks

2. More Price, Volume Divergence; Stock of Day: Innerworkings (INWK)

3. Napoleon Hill of Think and Grow Rich Discusses Carnegie, Power of Mind

4. Top Rated IPO Qiao Xing Mobile (QXM) Cup With Handle Breakout; Globecomm (GCOM) Breaks to Record Highs

5.  Case Study: Trading Cardica (CRDC) For a 45% Profit

An Excuse to Sell; Smorgasbord Of Leading Stocks

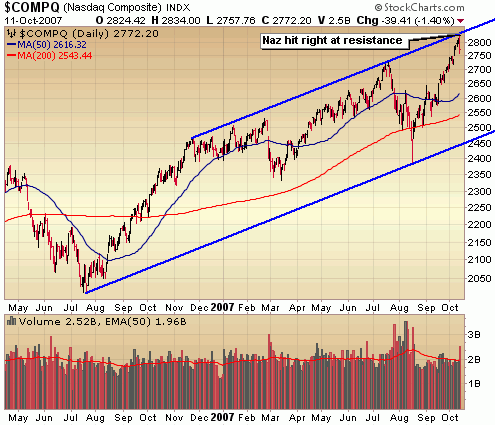
Today’s action shouldn’t have been too much of a surprise given the run we’ve had off that big capitulation day back in August.  With volume levels waning and the Nasdaq approaching key resistance of its upward trend line, the move was simply unsustainable.  When you consider that the Nasdaq is up over 18% in two months, a pull back of 5 to 10% wouldn’t be out of the ordinary. Eventually, the market looks for an excuse to sell and today it got it in the form of hawkish comments from European Central Banker Alex Weber.  Yes it is truly a global economy with world markets intertwined.   If the US Fed won’t get tough on inflation, leave it up to our neighbors to be the buzz kill.

Said Weber:

“If risks to price stability are threatening to materialize, monetary policy can’t lose sight of its primary mandate — even if that means no longer supporting the robust economy or becoming restrictive,” Weber, who also heads Germany’s Bundesbank, said in the text of a speech in Munich today. There may be an “additional need” to raise interest rates, given the “expected acceleration in euro-region inflation over the coming months.”

Today’s action was certainly a change of character for this market as sell volume picked up substantially but I don’t think this is the beginning of the end.  Key support levels at those July highs remain intact so we’ll just have to see how we hold up there.  It isn’t time to abandon ship and head for the exits, although taking profits in those China high fliers and some of the IPO’s would have been a good idea this week.  I think tomorrow’s action will be fairly important.  Will retail sales and PPI data on the agenda for tomorrow, will it send the the market into another tailspin and confirm the selling of today?  It’s anyone’s guess but as I’ve been saying for several days now it’s best to remain cautious up here.

Tonight I have just one chart for you which illustrates how far the Nasdaq has come within a longer term upward trend.. and how far it could drop and still be considered in a bull market.

::: Major Indices Performance – The Numbers :::

(Note: volume averages are based on the average over the past 50 days)
Data as of 4:00EST – End of Day October 11th 2007

Nasdaq: DOWN 1.4% today with volume 28% ABOVE  average
Nasdaq ETF (QQQQ) DOWN 1.59%, volume 83% ABOVE average
Dow: DOWN .45%, with volume 17% ABOVE the average
Dow ETF (DIA): DOWN .37%, volume 32% ABOVE the average
S&P ETF (SPY): DOWN .48%, volume 16% ABOVE the average
Russell Small Cap ETF (IWM): DOWN 1.13%, volume 12% BELOW the average

::: SelflInvestors Leading Stocks :::

The Self Investors Leading Stocks Index is comprised of stocks in the Breakout Tracker, which is a database of the fastest growing companies near a breakout or having already broken out of a base.  Leading stocks led the way today but as with the general market, there was no volume conviction behind the move.

Summary:

* Decliners led Advancers 257 to 94
* Advancers were up an average of 2.02% today, with volume 103% ABOVE average
* Decliners were down an average of 1.05% with volume 31% ABOVE average
* The total SI Leading Stocks Index was DOWN 1.32% today with volume 51% ABOVE average

::: Where’s the Money Flowing :::

Many investing websites provide leading industries based on price performance alone. However, without accompanying volume levels, this can sometimes be misleading.  The only way that I know of to gauge industry/sector strength WITH volume levels is through the analysis of ETF’s.  A couple years ago this was not possible, but as more traders/investors use ETF’s they become a much better tool for gauging the health of the market and seeing where the money is flowing (or not flowing).  Using the proprietary SelfInvestors Demand Indicator score which measures price and volume movements, I’m able to quickly see which sectors/industries are seeing the greatest inflows of cash.  For a detailed look at how I go about gauging sector/industry strength please see the following post: http://selfinvestors.com/si/industry_tracking/

* Current Leading Sectors/Industries (over last 30 trading days):  
Gold, Broker/Dealers, Internet Infrastructure, Gold Miners, Agriculture, Software
                                          
* Current Lagging Sectors/Industries (over last 30 trading days): 
Homebuilders

* Today’s Market Moving Industries/Sectors (UP):
Gold, Retail, Oil Services

* Today’s Market Moving Industries/Sectors (DOWN):
Internet, Semis, Water Resources, Clean Energy, Ishares Software

::: Stocks :::

The stocks section will be an area where I highlight one stock selected from a group of stocks moving up with volume well above average and most likely breaking out of a base or consolidation.  Today’s stock is ..  a choose your own adventure. 

Here’s a list of SelfInvestors Leading Stocks that moved with volume today and are above both the 50 and 200 day moving averages (in order of fundamental rank)::

JA Solar (JASO)
Sterlite Industries (SLT)
Zumiez (ZUMZ)
Yingli Green Energy Holdings (YGE)
GigaMedia (GIGM)
Qiao Xing Mobile (QXM)
Global Sources (GSOL)
T-3 Energy Services (TTES)
Telefonica S.A. (TEF)
China Petroleum (SNP)
TomoTherapy (TTPY)

Interested in tracking leading stocks throughout the day.. how about IPO’s and ETF’s?  It’s all here.

More Price, Volume Divergence; Stock of Day: Innerworkings (INWK)

Today, as it has been for much of the past few weeks, the market seemed to go up not because of any great news, but a lack of any major bad news that could jolt the market into believing that the credit/subprime concerns ARE NOT just an aberration.  For much of the day, we meandered sideways but after the Fed released its minutes a surge of buying hit sending the indices to a sizable gain.  It seems these days that the market will never go down and with uninspiring volume behind these moves it’s enough of a reason to play mr. contrarian and avoid getting overly aggressive up here.  There continues to be outstanding short term trading opportunities, particularly in the China plays but to be initiating positions for the long haul here is probably a mistake.  The retail numbers come out Friday and we ramp up earnings next week.  With the Nasdaq nearing some resistance at the upper level of a wide channel, the market may be soon be looking for excuses to take profits.  Now may be a good time to find excuses to take profits of your own. 

::: Major Indices Performance – The Numbers :::

(Note: volume averages are based on the average over the past 50 days)
Data as of 4:00EST – End of Day October 9th 2007

Nasdaq: UP .59% today with volume 2% BELOW  average
Nasdaq ETF (QQQQ) UP .43%, volume 31% BELOW average
Dow: UP .87%, with volume 19% BELOW the average
Dow ETF (DIA): UP .93%, volume 47% BELOW the average
S&P ETF (SPY): UP .94%, volume 55% BELOW the average
Russell Small Cap ETF (IWM): UP .81%, volume 48% BELOW the average

::: SelflInvestors Leading Stocks :::

The Self Investors Leading Stocks Index is comprised of stocks in the Breakout Tracker, which is a database of the fastest growing companies near a breakout or having already broken out of a base.  Leading stocks led the way today but as with the general market, there was no volume conviction behind the move.

Summary:

* Advancers led Decliners 242 to 105
* Advancers were up an average of 2.17% today, with volume 2% BELOW average
* Decliners were down an average of 1.05% with volume 14% BELOW average
* The total SI Leading Stocks Index was UP 1.22% today with volume 5% BELOW average

::: Where’s the Money Flowing :::

Many investing websites provide leading industries based on price performance alone. However, without accompanying volume levels, this can sometimes be misleading.  The only way that I know of to gauge industry/sector strength WITH volume levels is through the analysis of ETF’s.  A couple years ago this was not possible, but as more traders/investors use ETF’s they become a much better tool for gauging the health of the market and seeing where the money is flowing (or not flowing).  Using the proprietary SelfInvestors Demand Indicator score which measures price and volume movements, I’m able to quickly see which sectors/industries are seeing the greatest inflows of cash.  For a detailed look at how I go about gauging sector/industry strength please see the following post: http://selfinvestors.com/si/industry_tracking/

* Current Leading Sectors/Industries (over last 30 trading days):  
Gold, Broker/Dealers, Internet Infrastructure, Gold Miners, Agriculture, Software
                                          
* Current Lagging Sectors/Industries (over last 30 trading days): 
Homebuilders

* Today’s Market Moving Industries/Sectors (UP):
Nanotech, Nuclear Energy, Energy, Real Estate, Oil & Gas Services, Internet Infrastructure

* Today’s Market Moving Industries/Sectors (DOWN):
None

::: Stocks :::

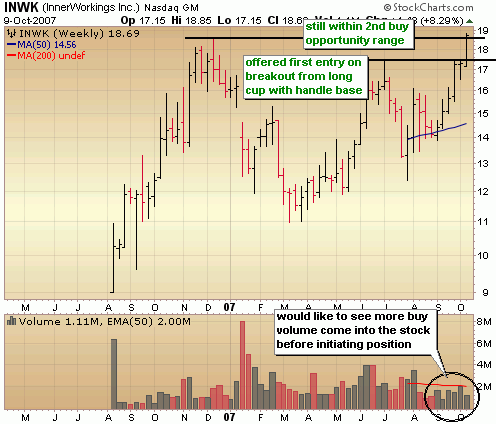
The stocks section will be an area where I highlight one stock selected from a group of stocks moving up with volume well above average and most likely breaking out of a base or consolidation.  Today’s stock is Innerworkings (INWK), another highly rated IPO that debuted in the 4th quarter last year and broke out of a long base to a new all time high today.

ABOUT: 

InnerWorkings, Inc. is a provider of print procurement solutions to corporate clients in the United States. The Company creates bid process to procure, purchase and deliver printed products as part of an outsourced enterprise solution and in individual transactions. Its applications and database, PPM4, creates an integrated solution that stores, analyzes and tracks the production capabilities of its supplier network, as well as quote and price data for each bid the Company receives and print job it executes. Through its network of over 5,000 suppliers, the Company offers a range of print, fulfillment and logistics services. It procures printed products for clients across a range of industries, such as advertising, consumer products, publishing and retail. In October 2006, the Company acquired Applied Graphics, Inc., a provider of print management and print-on-demand services. In March 2007, it acquired Spectrum Printing Systems. In July 2007, the Company acquired Brown+Partners, Inc.

FUNDAMENTALS: 

Innerworkings (INWK) is in the publishing business so it doesn’t receive some of the hype that the hot China or solar IPO’s receive, but it is one of the highest rated IPO’s that I track with a fundamental score of 27/30.  The small company has been profitable since 2003 and has been roughly doubling profits ever since.  Growth is expected to moderate a bit, but the company is still expected to post earnings growth of more than 50% this year and next.  If the company has a negative, it’s the low margin printing business that it works in with net margins around 5%.  Return on Equity is an excellent 24% so management is strong and they own a good portion of their company with 25% ownership.  Both key characteristics of a big winner. 

TECHNICAL:  

Below is a look at the weekly chart and shows a long cup with handle base (handle a bit steep) with a subsequent breakout around 17.50 from the large handle.  This offered the first chance at an entry in the stock.  It wasn’t long before the stock tackled all time highs around 19 which it cleared today with above average volume and remains in a buyable entry for a 2nd entry point.  You should be paying particular attention to top IPO’s breaking out of bases with volume and INWK is no exception.  The only thing I’d like to see is more volume come into the stock.  It’s been a little weak during the rise over the past couple weeks.  Considering the overall market is overbought and looking tired, the best course of action is to probably wait it out on INWK and get on a pullback to the first entry around 17.50 if it does so with light selling volume. 
SELFINVESTORS RATING: With a total score of 51/60 (27/30 for fundamentals, 24/30 for technical), Innerworkings (INWK) is a very good SelfInvestors breakout candidate.

Full Disclosure/Disclaimer: The stock of the day is by no means a buy recommendation.  Please do your own research and make a personal decision based on your own tolerance for risk.  I currently do not own a position in INWK.
Napoleon Hill of Think and Grow Rich Discusses Carnegie, Power of Mind

Napoleon Hill is one of the greatest personal success gurus that ever lived and was certainly a big influence on all the self proclaimed gurus you see today.  Hill first read his classic Think and Grow Rich about 4 years ago and I credit that book with giving me the extra push I needed to begin building SelfInvestors.com from scratch.  I purchased the audio set several months ago and have been listening to those as well.  To hear this man speak his passionate wisdom in his own voice is a great way to pass the time in the car!  (I have to thank Chris Perruna for the heads up on the audio set Your Right to Be Rich).  Keep in mind this is not a recitation of the book, but rather of lectures he did around the country.

I just came across some rare video footage of Napoleon Hill over at YouTube.  There is very little video footage of Hill out there so it’s certainly worth a look.  He discusses a lecture from Andrew Carnegie and the one principle that Carnegie spoke of that changed the course of his own life forever.  The power to take possession of your own mind and direct it to whatever ends you may desire.


Top Rated IPO Qiao Xing Mobile (QXM) Cup With Handle Breakout; Globecomm (GCOM) Breaks to Record Highs

It’s been a few days since I’ve featured a trade of the day.  I’ve just been too busy to post much of late but will be getting back into a flurry of posting at the beginning of next week.  Today, I’d like to highlight two outstanding looking breakout stocks – one in top rated IPO Qiao Xing Mobile (QXM) and another in Globecomm (GCOM).  Both are breaking out with big volume and look poised to move higher from here.

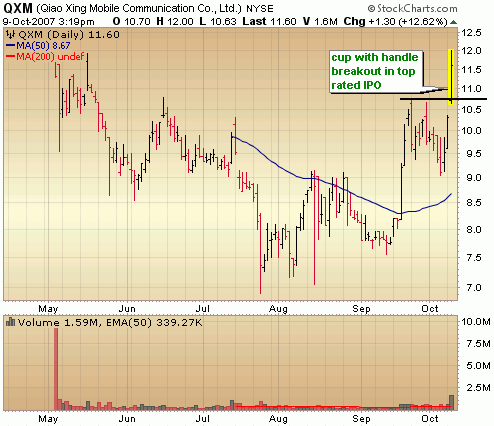
QXM is a top rated IPO here at SelfInvestors.com and if you’ve been checking out my new IPO portal page, you would have noticed that QXM is one of the highest rated with a fundamental score of 27/30.  Today, the stock broke out of a cup with handle base formation with heavy volume, it’s first base and breakout since going public back in May.

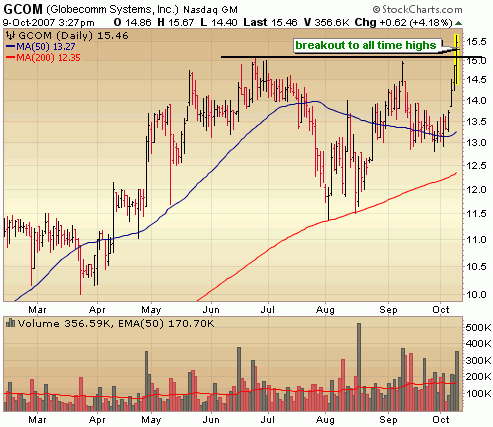
Another great looking breakout today occurred in Globecomm a company with great fundamentals which broke out to a new all time high.  Volume is more than double the daily average today.

Case Study: Trading Cardica (CRDC) For a 45% Profit

Extraordinary profits can be had in low priced momentum stocks and they aren’t too much riskier than any other stock if you’re sure to keep your losses small by dumping the position on any sign of weakness. Any increase in risk is certainly more than made up by the increase in profit potential.

I call these kinds of trades Quick Strike Profit (QSP) plays here at SelfInvestors.com but in general they are shorter term swing trades in high momentum, lower priced stocks. I use them when the time is right (in a strong market) to accelerate the returns of my portfolio. Gold and Platinum members are alerted to several of these every month when I initiate a trade in the Model Portfolio. One such trade in Cardica (CRDC), yielded a quick 45% profit in just a few hours of trading.

Before I go into the details of how I traded CRDC, I wanted to illustrate an example of how I minimize my losses in these kinds of trades by dumping the position quickly at the first sign of weakness. This was illustrated perfectly today in a QSP trade in Silverstar Holdings (SSTR), which I closed for a small loss.  This morning I issued the following alert on SSTR:

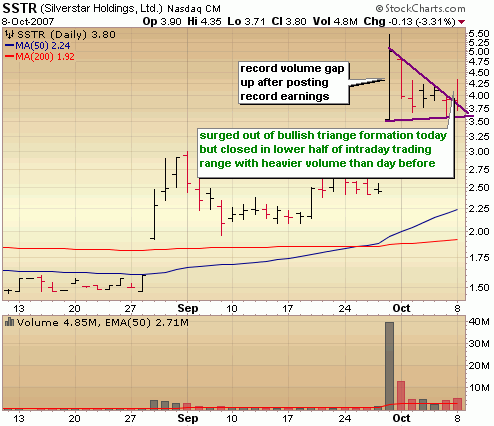
I’m initiating another QSP trade this morning, this time in SSTR.  The stock gapped up to a record high with record volume on Sept. 28th after posting an outstanding earnings report.  The stock has been digesting that gain and now looks poised to begin running again.  I’m in here with a very small $7500 position at 4.07. and am just looking for a quick 20 – 30% over the next several days.

Here’s a look at the chart which shows that the stock surged out of a bullish triangle formation with decent volume.  However, the stock kept pushing lower throughout the day and the selling picked up by the end of the day, sending the stock below $4/share.  When a stock closes in the lower half of the intraday range with above average volume, that is an indication of weakness.  This kind of action almost always results in me closing a QSP trade because it often results in further deterioration.  As I’ve said, I cut my losses quickly in these trades at the first sign of weakness.  When in doubt, get out.  I issued the following sell alert to members before the close today:

SSTR flashed all the signals of another run, but it’s proving to be a false alarm at least at this point. The stock is staging a significant reversal today indicating the stock isn’t quite yet ready to resume the run.  I’m going to go ahead and take the small loss and will look to try again if it flashes a buy signal in the coming days.  The key in playing these is to keep your losses very small and close the trade at the first sign of weakness to avoid large losses.  I’m out at 3.94.

The SSTR trade today shows that sometimes the trade doesn’t work out as you expect.  Take the small loss and move on knowing that another trade will prove to be highly profitable just as CRDC was (which I highlight below).

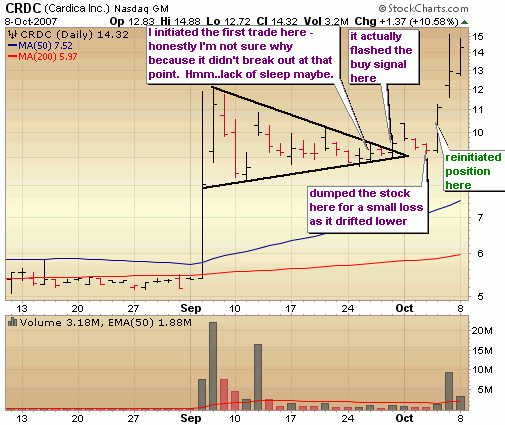
I began featuring CRDC in my #1 Longs List (a new feature of the Gold and Premium membership package) on September 14th as it began to carve out a picture perfect bullish triangle.  CRDC would appear on my #1 Longs List for the next couple weeks when it finally began to move on September 26th.  I issued the following alert:

I’m going to go ahead and play my hand in CRDC, a highly speculative company with a very bullish looking stock chart.  The stock has carved out a picture perfect bullish triangle formation and looks poised for a big move out of this pattern.  The stock has just begun moving with some good volume.  I’m in at 9.34 with a very small position of $7500.  The only reservations I have about this pattern is that it’s too perfect so may be watched by too many making it more prone to failure.  I definitely feel it’s worth the gamble and will have a tight stop in place.

Here’s the chart below.  Looking back on the trade I honestly don’t remember why I initiated the trade for the first time on the 26th because it hadn’t yet cleared the triangle formation yet ๐Ÿ™ .  Call it over eager, call it lack of sleep but it was too soon to initiate.  As it turned out, I got in at a better price, but you really should wait for a breakout of the pattern.  Two days later, it did just that and looked as if it was ready for the big run, but on Oct 1st stalled out and closed at the low of the day.  Remember that I closed the SSTR trade following a high volume reversal.  CRDC reversed on Oct 1 and closed in the lower half of its intraday range, but it didn’t do so with big volume so I held on for a couple more days.  On Oct 3rd I decided to go ahead and dump the stock for a 1% loss.  I have seen too many trades like this stall out and just drift lower and lower with no real conviction.  I could always get back in if CRDC began to show some life again, so I dumped it and issued the following sell alert to members:

I’m closing my last QSP trade in the portfolio.. in CRDC.  It looked like a couple days ago it was going to bust out for good from its  very bullish looking triangle formation as the stock gapped up in the morning.  It proved to be a false alarm at least for now.  Since then, the stock has stalled and continues to meander lower.  As with all QSP trades, I’m quick to pull the sell trigger if the stock shows any kind of weakness.  No exception here.  I may get in again down the road, but for now it’s best for me to exit with a very small loss and look for stronger positions.  I’m out at 9.27

… and show some life it did!  At the end of the day the very next day, CRDC got a surge of buying and I issued another alert to members:

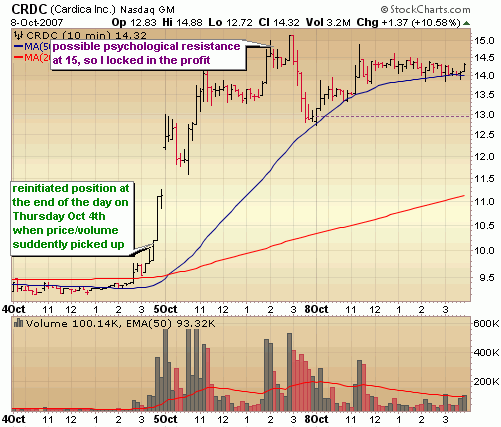
Cardica (CRDC), a QSP trade I exited just yesterday is finding some life here, so I’m going to try again and see if it can break out for good this time.. It looks good and is getting a ton of buying here at the end of the day and is on the verge of breaking big.  I’m in at 10.17 with a small $7500 position.

The chart below shows my entry and exit on the intraday chart.  Notice the big surge in buying at the end of the day on Oct 4th where I re-initiated the position.  Once the stock cleared resistance at 12 the following day, there was no overhead resistance in its path but I thought that a new source of resistance could be at the psychological level around 15 so I was looking to take profits up there.  I wasn’t about to get greedy.. a 45% profit in literally just a few hours of trading is an exceptional move that doesn’t come around everyday.  I issued the following sell alert to members:

It’s time to take the profit in CRDC.. what a 2 day run!  Up 45%.  These kinds of home runs don’t happen very often but the reason I play the QSP trades is because just one of these can really accelerate your returns.  By keeping losses small in these and hitting a home run every now and then you will do extremely well.  I’m out of CRDC at 14.77 and looking for another QSP trade

As the trades in SSTR and CRDC illustrate, trading isn’t always textbook, certainly isn’t always pretty and mistakes do occur.  Hopefully you’ve learned a bit from this case study just as I have.  It’s always a good idea to review all your trades (even your winners) to discover ways you can continue to improve.  Just remember, you can enjoy big gains in the market year after year if you exercise discipline and keep those losses small.

Also keep in mind that the run in CRDC could certainly continue up from there.  Look for some kind of bullish basing action (perhaps a flat base or another triangle formation) and a breakout from that base as an opportunity for another trade.

ETF, IPO & Breakout Stocks Analysis, Tracking & Research