Today’s action shouldn’t have been too much of a surprise given the run we’ve had off that big capitulation day back in August. With volume levels waning and the Nasdaq approaching key resistance of its upward trend line, the move was simply unsustainable. When you consider that the Nasdaq is up over 18% in two months, a pull back of 5 to 10% wouldn’t be out of the ordinary. Eventually, the market looks for an excuse to sell and today it got it in the form of hawkish comments from European Central Banker Alex Weber. Yes it is truly a global economy with world markets intertwined. If the US Fed won’t get tough on inflation, leave it up to our neighbors to be the buzz kill.
Said Weber:
“If risks to price stability are threatening to materialize, monetary policy can’t lose sight of its primary mandate — even if that means no longer supporting the robust economy or becoming restrictive,” Weber, who also heads Germany’s Bundesbank, said in the text of a speech in Munich today. There may be an “additional need” to raise interest rates, given the “expected acceleration in euro-region inflation over the coming months.”
Today’s action was certainly a change of character for this market as sell volume picked up substantially but I don’t think this is the beginning of the end. Key support levels at those July highs remain intact so we’ll just have to see how we hold up there. It isn’t time to abandon ship and head for the exits, although taking profits in those China high fliers and some of the IPO’s would have been a good idea this week. I think tomorrow’s action will be fairly important. Will retail sales and PPI data on the agenda for tomorrow, will it send the the market into another tailspin and confirm the selling of today? It’s anyone’s guess but as I’ve been saying for several days now it’s best to remain cautious up here.
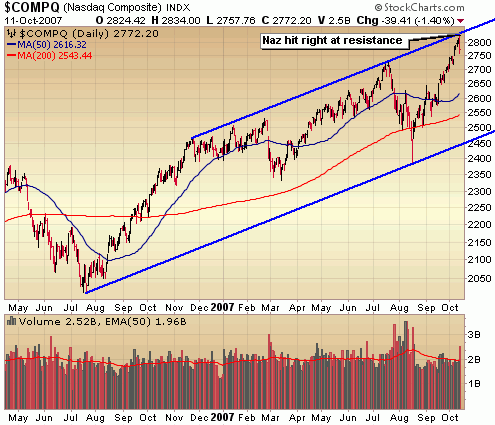
Tonight I have just one chart for you which illustrates how far the Nasdaq has come within a longer term upward trend.. and how far it could drop and still be considered in a bull market.
::: Major Indices Performance – The Numbers :::
(Note: volume averages are based on the average over the past 50 days)
Data as of 4:00EST – End of Day October 11th 2007
Nasdaq: DOWN 1.4% today with volume 28% ABOVE average
Nasdaq ETF (QQQQ) DOWN 1.59%, volume 83% ABOVE average
Dow: DOWN .45%, with volume 17% ABOVE the average
Dow ETF (DIA): DOWN .37%, volume 32% ABOVE the average
S&P ETF (SPY): DOWN .48%, volume 16% ABOVE the average
Russell Small Cap ETF (IWM): DOWN 1.13%, volume 12% BELOW the average
::: SelflInvestors Leading Stocks :::
The Self Investors Leading Stocks Index is comprised of stocks in the Breakout Tracker, which is a database of the fastest growing companies near a breakout or having already broken out of a base. Leading stocks led the way today but as with the general market, there was no volume conviction behind the move.
Summary:
* Decliners led Advancers 257 to 94
* Advancers were up an average of 2.02% today, with volume 103% ABOVE average
* Decliners were down an average of 1.05% with volume 31% ABOVE average
* The total SI Leading Stocks Index was DOWN 1.32% today with volume 51% ABOVE average
::: Where’s the Money Flowing :::
Many investing websites provide leading industries based on price performance alone. However, without accompanying volume levels, this can sometimes be misleading. The only way that I know of to gauge industry/sector strength WITH volume levels is through the analysis of ETF’s. A couple years ago this was not possible, but as more traders/investors use ETF’s they become a much better tool for gauging the health of the market and seeing where the money is flowing (or not flowing). Using the proprietary SelfInvestors Demand Indicator score which measures price and volume movements, I’m able to quickly see which sectors/industries are seeing the greatest inflows of cash. For a detailed look at how I go about gauging sector/industry strength please see the following post: http://selfinvestors.com/si/industry_tracking/
* Current Leading Sectors/Industries (over last 30 trading days):
Gold, Broker/Dealers, Internet Infrastructure, Gold Miners, Agriculture, Software
* Current Lagging Sectors/Industries (over last 30 trading days):
Homebuilders
* Today’s Market Moving Industries/Sectors (UP):
Gold, Retail, Oil Services
* Today’s Market Moving Industries/Sectors (DOWN):
Internet, Semis, Water Resources, Clean Energy, Ishares Software
::: Stocks :::
The stocks section will be an area where I highlight one stock selected from a group of stocks moving up with volume well above average and most likely breaking out of a base or consolidation. Today’s stock is .. a choose your own adventure.
Here’s a list of SelfInvestors Leading Stocks that moved with volume today and are above both the 50 and 200 day moving averages (in order of fundamental rank)::
JA Solar (JASO)
Sterlite Industries (SLT)
Zumiez (ZUMZ)
Yingli Green Energy Holdings (YGE)
GigaMedia (GIGM)
Qiao Xing Mobile (QXM)
Global Sources (GSOL)
T-3 Energy Services (TTES)
Telefonica S.A. (TEF)
China Petroleum (SNP)
TomoTherapy (TTPY)
Interested in tracking leading stocks throughout the day.. how about IPO’s and ETF’s? It’s all here.