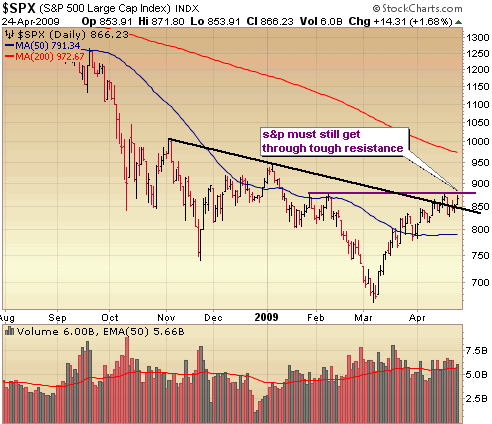
This week, I’ll keep it VERY brief with a short analysis of the charts. As I mentioned in last week’s report, the market has shown signs of cracking up here, but going into next week bulls remain in control. Just when it appears the market may follow through to the downside, buyers step into support this market. I thought there was a very good chance that traders would “sell the news” following the release of the stress test parameters but the market held in quite well all the way into the close. The level I’ll be watching closely next week is that 875 level in the S&P which is an area of failure 3 times now. Getting through there would be very bullish and signal a move to the 900 level.

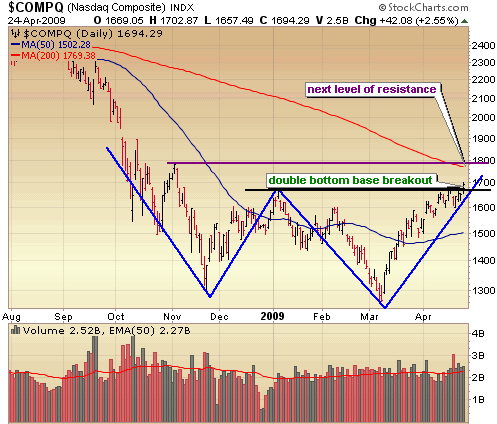
The Nasdaq remains the most bullish of the major indices and continues to trade above that double bottom base breakout level around 1665. I’ll be watching 1700 as potential resistance but that is really just minor psychological resistance. It really looks like the Nasdaq wants to test that next major level of resistance around the 200 day moving average and November high around 1780 – 1800. If we do hit that level, it would be a beauty of a spot to short this market with some aggression.

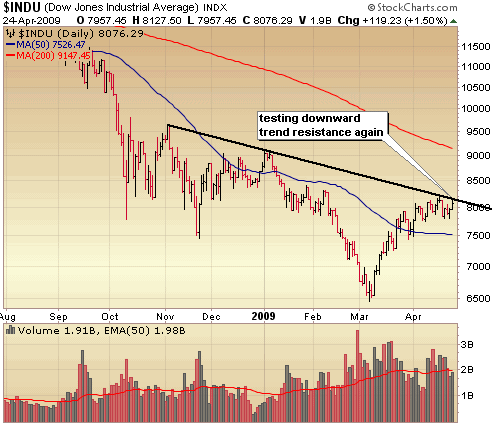
The laggard is the Dow and it continues to have trouble with that downward trend line off the Nov, Jan and April highs. It hit that line again on Friday before pulling back.

To sum up, this market has certainly shown some signs of weakening, but considering the strength of tech right now I believe there is a 50/50 chance of vaulting another 5% or so before a more pronounced correction can begin. Get those watch lists of short opportunities together now so you’ll be ready!
:::::::::::::::::::::::::::::::::::::::::::
Isn’t Time You Took Control of Your Financial Future?
The Self Investors Model Portfolio wrapped up 2006 with a gain of 27.6%, 2007 with a gain of 30.2%, finished nearly 35% ahead of the S&P in a very difficult 2008 and is off to a good start here in 2009, ahead of the S&P YTD performance by 5%. This is a REAL portfolio with position sizing and not based on extrapolated hypothetical gains for each trade. On average it beats the S&P by 20% per year. The result?
* Putting $100K into an S&P tracking index at the beginning of 2004 and you’re down more than $20K.
* The Self Investors Model in the same time period would have more than doubled your money. That’s the power of not buying and holding!
Would you like to receive buy and sell alerts in the Model Portfolio within minutes (NEW! now get them via instant messaging in near real time) of each transaction? You can receive these along with ALL of the tracking tools and video reports with the very popular Gold membership. Don’t delay, get started today and join me for many more market beating months here at SelfInvestors.com.
::: Best/Worst Performers :::
– Top 10 Performing Industries For the Week –
1. Textile Manufacturing: 22.45%
2. Resorts & Casinos: 17.80%
3. REIT – Hotel Motel: 16.95%
4. Silver: 13.60%
5. Paper & Paper Products: 12.35%
6. Office Supplies: 11.15%
7. Gold: 10.95%
8. Lumber & Wood Production: 10.60%
9. Hospitals: 10.00%
10. Small Tools & Accessories: 9.85%
– Top 10 Worst Performing Industries For the Week –
1. Research Services: -11.30%
2. Diagnostic Substances: -10.10%
3. Music & Video Stores: -9.60%
4. Farm Products: -8.75%
5. Surety & Title Insurance: -8.00%
6. Banks – Midwest: -6.75%
7. Copper: -6.40%
8. Banks – SE: -6.25%
9. Broadcasting Radio: -6.00%
10. Education & Training Services: -5.35%
– Top 5 Best Performing ETFs For the Week –
(excluding leveraged ETFs)
1. Market Vectors Gold Miners (GDX) 11.90%
2. iShares Silver (SLV) 8.50%
3. Claymore Global Timber (CUT) 8.25%
4. Central Fund of Canada (CEF) 7.70%
5. Market Vectors Nuclear Energy (NLR) 6.75%
– Worst 5 Performing ETF’s –
1. Herzfeld Caribbean Basin (CUBA) -16.05%
2. US Nat Gas (UNG) -12.80%
3. SPDR Series Trust (KBE) -7.55%
4. PowerShares Base Metals (DBB) -6.40%
5. SPDR Regional Banking (KRE) -4.95%
::: Upcoming Economic Reports (4/27/2009- 5/1/2009) :::
Monday: None
Tuesday: Consumer Confidence, Case/Shiller Home Price Index
Wednesday: FOMC Rate Decision, GDP, Crude Inventories
Thursday: Personal Income/Spending, Initial Claims, Chicago PMI
Friday: Factory Orders, ISM Index, Auto/Truck Sales
::: Earnings I’m Watching This Week :::
Monday: Baidu.com (BIDU), BE Aerospace (BEAV), Compass Minerals (CMP), Grand Canyon Education (LOPE), Smith Intl (SII), Southwestern Energy (SWN), Tyler Technologies (TYL),
Tuesday: Amedisys (AMED),Deutsche Bank (DB), eHealth (EHTH), FPL Group (FPL), Icon (ICLR), Jacobs Engineering (JEC), Mead Johnson Nutrition (MJN), OptionsXpress (OXPS), Sociedad Quimica (SQM), Stericycle (SRCL), Vision China Media (VISN),
Wednesday: Akeena Solar (AKNS), China Offshore (CEO), First Solar (FSLR), Green Mountain Coffee (GMCR), Itron (ITRI), Rubicon (RBCN), Tetra Tech (TTEK), Trinity Industries (TRN), Visa (V),
Thursday: Athena Health (ATHN), Capella Education (CPLA), Compellant Technologies (CML), Comscore (SCOR), Corinthian Colleges (COCO), Evergreen Solar (ESLR), Forrester Research (FORR), Genoptix (GXDX), Neutral Tandem (TNDM), SourceFire (FIRE), Strayer Education (STRA), TeleCommunication Systems (TSYS)
Friday: Flir Systems (FLIR), Mastercard (MA)


