Once again the bears can’t take the bull (er, I mean ball) and score. There have been several indications over the past few weeks that this rally is on the verge of falling apart and each time the market is one move away from a key breakdown, buyers step in and push this market higher. Frankly, I’m baffled at the way the buying has taken place particularly over the past week and ESPECIALLY in the last 15 minutes on Friday. Window dressing? Perhaps. Goverment intervention/manipulation? Perhaps. Whatever it was, it wasn’t natural which was the capper on a week of mighty strange trading action (the sustained rally after the consumer confidence number was also a head scratcher). The thin, volatile market where choppiness and unnatural trading prevail, prompted me to move more to the cash side, until a firm break out (with volume) out of the consolidation appears. With Friday’s move and the overall resiliency of the market, it appears the odds are increasing of an upside breakout move, but let’s put an asterisk next to that Friday move and await more confirmation. It should be noted that technically, the Nasdaq broke out at the end of the day Friday but the S&P and Dow remain below the 200 day moving averages. So, while the Nasdaq remains relatively in the free and clear up here, the S&P and Dow still face significant hurdles. Suffice it to say, it’s going to set up one wild week of trading. In my opinion, where the market finishes the end of next week will determine the direction for the next several weeks. Be ready on either side at this point or better yet, go enjoy warmer days and longer nights while this bull/bear battle play out at key resistance. Let’s take a look at the charts..
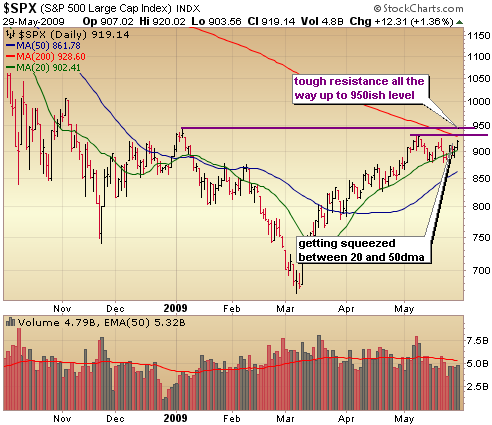
I should really redo this chart and add a few lines, but it’s Sunday and I’m lazy, so I’ll leave it be. I should have added another resistance line at the May 20 high at 924.60 which will be the next level of resistance. I’ve drawn out the next level of resistance around 930 from May 8th which happens to be just about on that 200 day moving average in red. Even if the S&P can manage to clear tough resistance between 925 – 930, it still must face resistance of the Jan high at 943.85. On the support side, notice the S&P bounced once again at the May lows, narrowly averting a double top confirmation. Apparently, bears also have 9 lives.
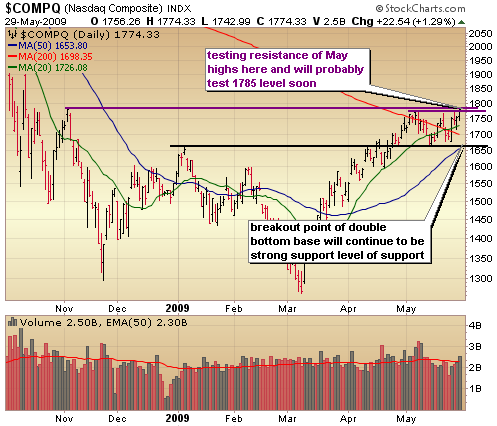
The late day Friday move, not only took out the high of the 2nd top of the double top, but cleared the May of 1773, so yes technically a failed double top and Nasdaq breakout Friday, setting up a possible move to 1785 and beyond. BUT, let’s remember how that was done and be somewhat suspicious. If however, the Nasdaq holds up at the levels in the first few days of next week, it lends validity to the move and we have to respect it.
:::::::::::::::::::::::::::::::::::::::::::
Isn’t Time You Took Control of Your Financial Future?
The Self Investors Model Portfolio wrapped up 2006 with a gain of 27.6%, 2007 with a gain of 30.2%, finished nearly 35% ahead of the S&P in a very difficult 2008 and is off to a decent start here in 2009, ahead of the S&P YTD performance by 5%. This is a REAL portfolio with position sizing and not based on extrapolated hypothetical gains for each trade. On average it beats the S&P by 20% per year. The result?
* Putting $100K into an S&P tracking index at the beginning of 2004 and you’re down more than $20K.
* The Self Investors Model in the same time period would have more than doubled your money. That’s the power of not buying and holding!
Would you like to receive buy and sell alerts in the Model Portfolio within minutes (NEW! now get them via instant messaging in near real time) of each transaction? You can receive these along with ALL of the tracking tools and video reports with the very popular Gold membership. Don’t delay, get started today and join me for many more market beating months here at SelfInvestors.com.
::: Best/Worst Performers :::
– Top 10 Performing Industries For the Week –
1. Copper: 12.00%
2. Trucking: 10.50%
3. Office Supplies: 10.50%
4. Oil & Gas Drilling & Exploration: 9.95%
5. Oil & Gas Equipment & Services: 9.90%
6. Steel & Iron: 9.75%
7. Semis – Memory Chips: 9.60%
8. Nonmetallic Mineral & Mining: 9.40%
9. Air Services – Other: 9.40%
10. Silver: 9.35%
– Top 10 Worst Performing Industries For the Week –
1. Education & Training Services: -4.70%
2. Major Airlines: -4.05%
3. Mortgage Investment: -2.45%
4. Computer Based Systems: -1.95%
5. Home Health Care: -1.70%
6. Staffing & Outsourcing Service: -1.20%
7. Specialized Health Service: -.85%
8. Residential Construction: -.80%
9. Computer Peripherals: -.60%
10. Publishing – Books: -.60%
– Top 5 Best Performing ETFs For the Week –
(excluding leveraged ETFs)
1. Templeton Russia & E Europe (TRF) 22.45%
2. Claymore China Real Estate (TAO) 17.95%
3. India Fund (IFN) 17.55%
4. Indonesia Fund (IF) 12.65%
5. Morgan Stanley E Europe (RNE) 11.50%
– Worst 5 Performing ETF’s –
1. iShares Municipal Bond (MUB) -1.20%
2. iShares 7 – 10 YR Treasuries (IEF) -.75%
3. iShares Home Construction (ITB) -.60%
4. iShares 20 Yr Treasury (TLT) -.45%
5. iShares Sweden (EWD) 0%
::: Upcoming Economic Reports (6/1/2009- 6/5/2009) :::
Monday: Personal Income/Spending, Construction Spending, ISM Index
Tuesday: Pending Home Sales, Auto/Truck Sales
Wednesday: ADP Employment, Factory Orders, ISM Services, Crude Inventories
Thursday: Initial Claims, Productivity
Friday: Nonfarm Payrolls, Unemployment Rate, Consumer Credit
::: Earnings I’m Watching This Week :::
Tuesday: Applied Signal Tech (APSG)
Wednesday: Joy Global (JOYG), Martek Biosciences (MATK), Shanda Interactive (SNDA), Toll Brothers (TOL)
Thursday: Guess (GES), Valence Technology (VLNC)