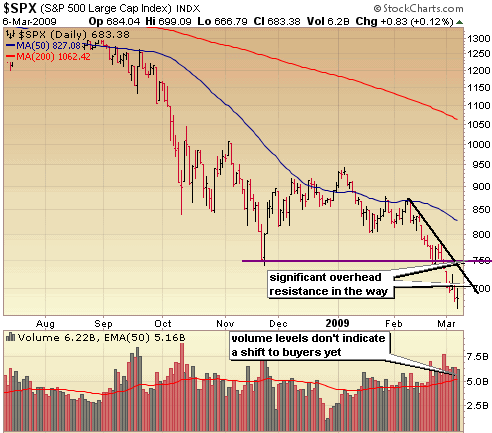
With each passing day, as the market plunges further into the abyss taking out critical long support levels along the way, questions surrounding Obama’s policies and whether he and his administration are to blame for the continuing losses dominate the blogs, the financial shows and even the nightly news. I chimed in on this a little bit last week alluding to the fact that traders are making bets on socialism following the passage of the stimulus package and bloated, big government budget & tax proposals. With the increasing skepticism that this administration can get this economy moving in the right direction along with the potential collapses in Citigroup, AIG, GM and BofA it’s no wonder the Nasdaq has joined the Dow and S&P500 in taking out the November lows.
The buy surge in the last 30 minutes of trading Friday provides some glimmer of hope that perhaps we are closing in on a relief rally, but as you’ll see in the charts below there is still considerable downside risk with lots of overhead resistance to work through.
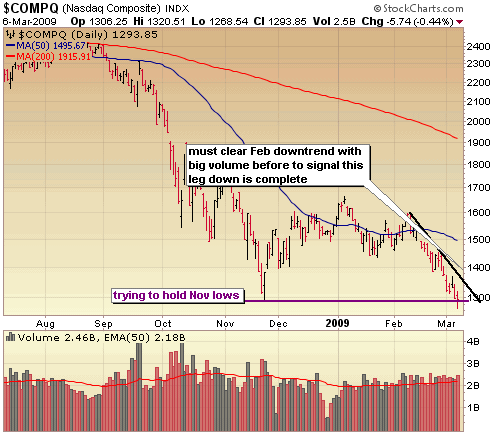
The Nasdaq joined the Dow and S&P in taking out its November lows Friday and despite a valiant end of day effort to reclaim that level of support, ultimately failed to do so. Perhaps Friday’s late surge can propel this market into an oversold relief rally. The bottom line is that this market has to build on Friday’s strength and get going right now and clear the February downtrend with big volume.
I do feel we are close to a big relief rally.. very close. However, with no sign of buyers stepping up in a big way yet, this market is prone to one big final flush move to shake out the last of the weak holders. What’s left of them anyway.
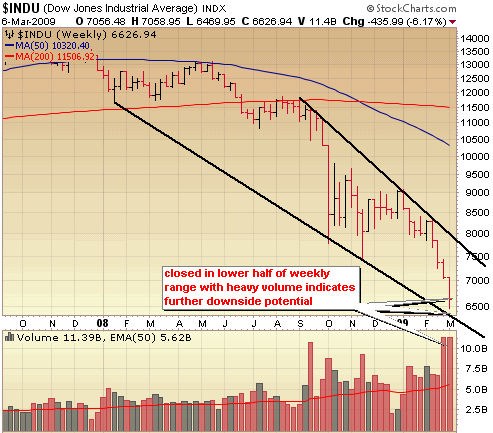
The Dow nearly touched the bottom of its downward channel on Friday, but there’s still room to run before hitting that level.. perhaps to the 6300 level or so. It’s concerning that we had yet another weekly close in the lower half of the trading range with heavy volume. We’re not out of the woods yet despite another 25% plunge in just two months.
I have a considerable cushion over the S&P 500 in the Self Investors Model portfolio, down just 1.8% YTD vs the 24.3% plunge in S&P500, so I did put some additional skin in the game on the long side on Friday. However, if the end of day Friday momentum turns out to be another dud, I won’t hesitate to exit positions quickly. You have to be incredibly nimble in this market.
:::::::::::::::::::::::::::::::::::::::::::
Isn’t Time You Took Control of Your Financial Future?
The Self Investors Model Portfolio wrapped up 2006 with a gain of 27.6%, 2007 with a gain of 30.2%, finished nearly 35% ahead of the S&P in a very difficult 2008 and is off to a great start here in 2009, ahead of the S&P YTD performance by 23%. This is a REAL portfolio with position sizing and not based on extrapolated hypothetical gains for each trade. On average it beats the S&P by 20% per year. The result?
* Putting $100K into an S&P tracking index at the beginning of 2004 and you’re down more than $35K.
* The Self Investors Model in the same time period would have more than doubled your money. That’s the power of not buying and holding!
Would you like to receive buy and sell alerts in the Model Portfolio within minutes (NEW! now get them via instant messaging in near real time) of each transaction? You can receive these along with ALL of the tracking tools and video reports with the very popular Gold membership. Don’t delay, get started today and join me for many more highly profitable months here at SelfInvestors.com.
::: Best/Worst Performers :::
– Top 10 Performing Industries For the Week –
1. Copper: 6.55%
2. Semis – Integrated: 4.25%
3. Toy & Hobby Stores: 3.10%
4. Auto Parts Stores: .45%
5. Gold: 0%
6. Music & Video Stores: -.25%
7. Semis – Specialized: -.55%
8. Consumer Services: -.90%
9. Semis – Equipment & Services: -.90%
10. Chemicals – Major Diversified: -1.25%
– Top 10 Worst Performing Industries For the Week –
1. Banks – Midwest: -24.05%
2. Major Airlines: -23.10%
3. Banks – Pacific: -22.80%
4. Resorts & Casinos: -22.15%
5. Nonmetallic Mineral/Mining: -22.10%
6. Textile Manufacturing: -21.65%
7. Lumber/Wood Production: -21.50%
8. Gaming Activities: -21.30%
9. Banks – NE: -20.15%
10. Broadcasting – Radio: -20.05%
– Top 5 Best Performing ETFs For the Week –
(excluding leveraged ETFs)
1. Morgan Stanley China (CAF) 10.85%
2. iShares Taiwan (EWT) 5.00%
3. PowerShares DB Base Metals (DBB) 4.90%
4.US Oil Fund (USO) 3.50%
5. Market Vectors Russia (RSX) 2.50%
– Worst 5 Performing ETF’s –
1. HLDRS Regional Banks (RKH) -27.70%
2. SPDR Series Trust (KBE) -23.30%
3. Herzfeld Caribbean Basin (CUBA) -23.00%
4. PowerShares Private Equity (PSP) -19.50%
5. SPDR Financials (XLF) -18.70%
::: Upcoming Economic Reports (3/9/2009- 3/13/2009) :::
Monday: None
Tuesday: Wholesale Inventories
Wednesday: Treasury Budget, Crude Inventories
Thursday: Retail Sales, Initial Claims, Business Inventories
Friday: Import/Export Prices, Trade Balance
::: Earnings I’m Watching This Week :::
Monday: AeroVironment (AVAV), American Oriental Bioengineering (AOB), Comtech Communications (CMTL), Digital Ally (DGLY), Gafisa (GFA)
Tuesday: China Digital TV (STV), JA Solar (JASO), LHC Group (LHCG)
Wednesday: Hot Topic (HOTT), LDK Solar (LDK), LMI Aerospace (LMIA), Buckle (BKE)
Thursday: Ener1 (HEV), Medifast (MED), Ocean Power Technologies (OPTT), PowerSecure Intl (POWR), ReneSola (SOL)


