You can’t help but marvel at the resiliency of this market following the sharp V shaped recovery in the indices over the past 2 months. Even during the first down week across the market, the pull back was fairly orderly, with a late day recovery on Friday keeping some key short term support intact (the 20 day moving averages of the S&P and Dow). Then, right out of the gates this week we get a 3% rally, erasing much of last week’s pull back. The action has prompted some analysts to compare the move to the 2003 rally which kicked off a 5 year bull market. I think it’s way too soon to be making those kinds of comparisons but I have to admit that I’m not nearly as confident that this market will come close to re-testing the March lows as I was just a few weeks ago. There are now several levels of considerable support that would need to breached to test those levels again. In the shorter term, I remain considerably bearish and still think that at the very least this market needs to spend some time sideways before a meaningful rally above the 200 day moving averages can take place. Let’s take a look at the charts.
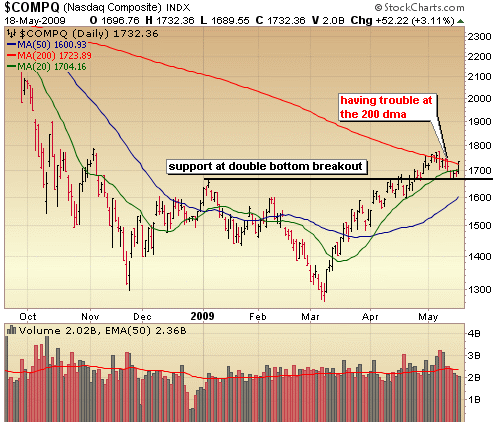
The Nasdaq has had ongoing trouble with that 200 day moving average over the past two weeks and ultimately took out the next level of support at the 20 day moving average in green, but notice that it’s finding some support at that big double bottom base breakout point at 1665. With today’s move, the Nasdaq reclaims that 20 day moving average and runs right into the 200 day moving average again.
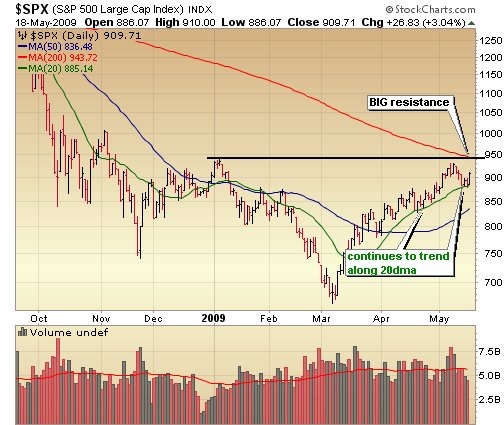
I really thought that the S&P would take out that 20 day moving average on Friday or today, but it didn’t happen. It just keeps on finding support there just as it did back in mid April. It sure looks like it wants to give that 200 day moving average a test before taking out the 20 day moving average. If today’s rally doesn’t fall apart quickly, look for that kind of move and if it happens it will be “the” short opportunity of the past year.
:::::::::::::::::::::::::::::::::::::::::::
Isn’t Time You Took Control of Your Financial Future?
The Self Investors Model Portfolio wrapped up 2006 with a gain of 27.6%, 2007 with a gain of 30.2%, finished nearly 35% ahead of the S&P in a very difficult 2008 and is off to a decent start here in 2009, ahead of the S&P YTD performance by 3%. This is a REAL portfolio with position sizing and not based on extrapolated hypothetical gains for each trade. On average it beats the S&P by 20% per year. The result?
* Putting $100K into an S&P tracking index at the beginning of 2004 and you’re down more than $20K.
* The Self Investors Model in the same time period would have more than doubled your money. That’s the power of not buying and holding!
Would you like to receive buy and sell alerts in the Model Portfolio within minutes (NEW! now get them via instant messaging in near real time) of each transaction? You can receive these along with ALL of the tracking tools and video reports with the very popular Gold membership. Don’t delay, get started today and join me for many more market beating months here at SelfInvestors.com.
::: Best/Worst Performers :::
– Top 10 Performing Industries For the Week –
1. Dairy Products: 11.05%
2. Agricultural Chemicals: 7.25%
3. Education & Training Services: 5.76%
4. Consumer Services: 3.70%
5. Nonmetallic Mineral & Mining: 2.50%
6. Cigarettes: 2.20%
7. Computer Based Systems: 2.20%
8. Meat Products: 2.10%
9. Application Software: 2.05%
10. Internet Service Providers: 1.15%
– Top 10 Worst Performing Industries For the Week –
1. REIT – Hotel/Motel: -20.30%
2. Resorts & Casinos: -17.80%
3. Banks – MidAtlantic: -17.65%
4. Recreational Vehicles: -15.15%
5. Banks – SE: -14.95%
6. Banks – Pacific: -14.55%
7. Building Materials Wholesale: -14.50%
8. Lumber/Wood Production: -14.30%
9. REIT – Retail: -13.75%
10. Banks – NE: -13.75%
– Top 5 Best Performing ETFs For the Week –
(excluding leveraged ETFs)
1. Herzfeld Caribbean Basin (CUBA) 8.75%
2. iShares 20 Yr Treasuries (TLT) 3.30%
3. Chile Fund (CH) 2.00%
4. HLDRS Software (SWH) 1.80%
5. SPDR Gold (GLD) 1.75%
– Worst 5 Performing ETF’s –
1. SPDR Series Trust (KBE): -15.35%
2. SPDR Banking (KRE) -13.65%
3. HLDRS Regional Banks (RKH) -13.65%
4. PowerShares Private Equity (PSP) -12.75%
5. PowerShares Dynamic Oil (PXJ) -12.35%
::: Upcoming Economic Reports (5/18/2009- 5/22/2009) :::
Monday: None
Tuesday: Building Permits, Housing Starts
Wednesday: FOMC Minutes, Crude Inventories
Thursday: Leading Indicators, Initial Claims, Philly Fed
Friday: None
::: Earnings I’m Watching This Week :::
Monday: AirMedia Goup (AMCN), China Distance Education (DL), Perfect World (PWRD),
Tuesday: E-House China (EJ), JA Solar (JASO), Solarfun Holdings (SOLF),
Wednesday: Hot Topic (HOTT), Netease (NTES), Toll Brothers (TOL),
Thursday: Chinaedu (CEDU), GameStop (GME), LDK Solar (LDK), ReneSola (SOL), SalesForce.com (CRM), Suntech Power (STP), The Buckle (BKE)
As a new bronze member, are your reports Candian,US or both. I trade only the Cdn. market.
Thank you