One key component to pin pointing market tops and bottoms is the market reaction to news. It’s something I’ve discussed quite a few times here in the past few years and with this V shaped market rally continuing into the stratosphere, it’s worth keeping an eye on to help determine when this rally might roll over for more than a few percentage points. Certainly, there have been a few technical indications that the rally is cracking in the foundation, but the house that the bulls built remains standing for now with Dow 9000 and S&P 1000 in the cross hairs. I mentioned last week that the inability of the bears to take control for than a day or two with buyers stepping in each time at key levels increasing the likelihood of an upside breakout out of consolidation. On Monday, we got the confirmation of Friday’s strange end of day breakout, so the next leg up is in process.
As the market battles more difficult levels of resistance, we’ll very likely we’ll see a shift from market rallies on any glimmer of hope (aka green shoots, or as one of my members Charlie likes to call green kudzu) to a market where “better than expected” won’t cut it and a focus on the negative returns. We saw that Friday for the first time since the rally began as it appeared traders focused on the surge in the unemployment rate to 9.4% (note that this already surpasses the 8.9% the Fed was using in its stress tests of banks for more adverse conditions in 09) and the continuing spike in Treasury yields. Can you imagine the magnitude of the rally had a big, unexpected drop in jobless claims occurred several weeks ago? Following an open gap up Friday morning, traders quickly sold into the news and each attempt at a rally was thwarted. This doesn’t derail the rally, but the reaction to news is something to keep a close eye on.
Let’s turn to the charts..
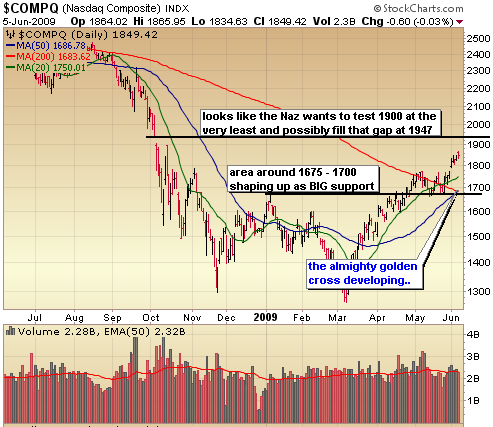
The Nasdaq remains the strongest of the major indices with a tremendous amount of support in place all the way down to 1600. The dramatic move over the past few months sets up a looming “golden cross” situation where the 50 day moving average (in blue) crosses above the 200 day moving average (in red) (Note: the Q’s have already confirmed the golden cross). It’s a bull market indicator for many analysts just as a cross of the 50 day moving average below the 200 day moving average signals a bear market (this last happened in early 2008) and proved to be a darn good exit signal. In my opinion it’s a bit too simplistic but generally it’s not a bad indication of the overall health of the market. Coming out of the internet bubble, the 50 day moving average crossed the 200 day moving average for the first time in early 2003 which kicked off a nearly 5 year bull market. I’ll have more on the comparison to today’s market collapse to the internet bubble collapse in an upcoming report.
I do think that this stage of the basing pattern is mighty extended with the potential for just a few more percent left before a major retracement takes place (again, more on this in an upcoming report). I’m looking for the Nasdaq to test the 1900 level and possibly fill the gap around 1947 before the major retracement begins. There is going to be tremendous support around the 1675 – 1700 level but given this sharp rise off the bottom we can’t rule out a 50% retracement which would put us in the 1600 range (another strong level of support). At this point, I don’t think there’s any way the Nasdaq touches those March lows again, but I’d have to reevaluate that if the Nasdaq takes out the 1600 level. I think the odds of that happening are quite slim.
The S&P is having some difficulty around resistance of the Jan highs but still closed the week above that 200 day moving average. It looks to me like there is enough juice left to test the next level of resistance around 1000. On the support side, the area where the 20 dma & 200 dma (labeled incorrectly on the chart) converge (around 925) will serve as strong support.
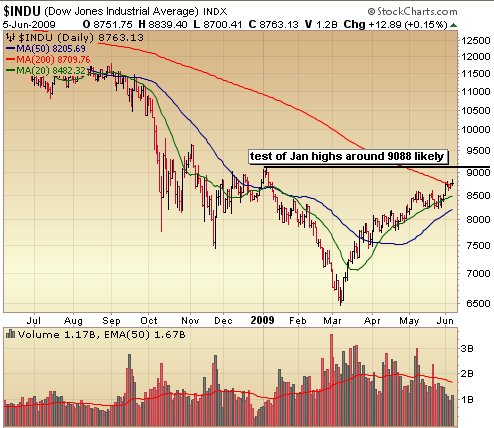
The Dow closed the week above its 200 day moving average as well and is looking poised to test the next level of resistance around the Jan highs. The market is getting back into overbought levels, so may need to come back a little or trade sideways, but there remains considerable strength in this market.
My trading strategy remains as it has over the past several weeks. I’m trading high momentum plays on the long side, primarily in small caps and specifically in the China and commodities areas while looking for spots to add longer term hedging.
:::::::::::::::::::::::::::::::::::::::::::
Isn’t Time You Took Control of Your Financial Future?
The Self Investors Model Portfolio wrapped up 2006 with a gain of 27.6%, 2007 with a gain of 30.2%, finished nearly 35% ahead of the S&P in a very difficult 2008 and is off to a decent start here in 2009, outperforming the S&P yet again. This is a REAL portfolio with position sizing and not based on extrapolated hypothetical gains for each trade. On average, it beats the S&P by 20% per year. The result?
* Putting $100K into an S&P tracking index at the beginning of 2004 and you’re down more than $20K.
* The Self Investors Model in the same time period would have more than doubled your money. That’s the power of not buying and holding!
When comparing the Self Investor Model Portfolio to the 535 Model Portfolios tracked by Hulbert Digest for annualized returns over the past 5 years, just four model portfolios produced better results and none of those used diversified approaches.
1. Cabot China & Emerging Markets: 22.2%
2. No Load Portfolios (Gold/Cash: 19.%
2. No Load Portfolios (Gold/Shorting): 19.9%
4. Outstanding Investments: 18.2%
(focuses on oil & precious metals – did extremely well until it was crushed in the market crash)
::: >> 5. Self Investors Model Portfolio: 17.5%
(The SI portfolio isn’t currently tracked by Hulbert (and I’ve never looked into it) but every trade alert is sent via IM and email as well as tracked in a database which includes trade notes, position size and entry price)
** Astonishing fact #1: Roughly a 1/3 of all model portfolios tracked by Hulbert Digest have lost money over the last 5 years!
** Astonishing fact #2: Just 6% of the model portfolios tracked have annualized returns over 5 years of 10% or more!
Would you like to receive buy and sell alerts in the Model Portfolio within minutes (NEW! now get them via instant messaging in near real time) of each transaction? You can receive these along with ALL of the tracking tools and video reports with the very popular Gold membership. Don’t delay, get started today and join me for many more market beating months here at SelfInvestors.com.
::: Best/Worst Performers :::
– Top 10 Performing Industries For the Week –
1. Aluminum: 13.60%
2. Auto Dealerships: 12.90%
3. Trucks & Other Vehicles: 11.55%
4. Textile Manufacturing: 11.40%
5. Aerospace/Defense: 11.35%
6. Major Airlines: 11.35%
7. Recreational Goods – Other: 10.85%
8. Department Stores: 10.40%
9. Industrial Equipment & Components: 10.20%
10. Research Services: 10.15%
– Top 10 Worst Performing Industries For the Week –
1. Gold: -6.15%
2. Drugs Wholesale: -5.50%
3. Silver: -5.25%
4. Oil & Gas Refining & Marketing: -3.40%
5. Internet Service Providers: -3.25%
6. Publishing – Periodicals: -3.25%
7. Banks – Midwest: -3.15%
8. Residential Construction: -2.65%
9. Semis – Integrated: -2.40%
10. Broadcasting – Radio: -2.35%
– Top 5 Best Performing ETFs For the Week –
(excluding leveraged ETFs)
1. Templeton Russia & E Europe (TRF) 19.10%
2. Herzfeld Caribbean Basin (CUBA) 18.60%
3. Claymore Global Solar Energy (TAN) 9.80%
4. PowerShares Clean Energy (PBW) 9.40%
5. Morgan Stanley Frontier Markets (FFD) 8.50%
– Worst 5 Performing ETF’s –
1. Market Vectors Gold Miners (GDX) -6.40%
2. iShares Taiwan (EWT) -4.90%
3. ING Global Dividend (IGD) -4.75%
4. Central Fund of Canada (CEF) -4.75%
5. iShares Sweden (EWD) 4.70%
::: Upcoming Economic Reports (6/8/2009- 6/12/2009) :::
Monday: None
Tuesday: Wholesale Inventories
Wednesday: Fed Beige Book, Treasury Budget, Trade Balance, Crude Inventories
Thursday: Retail, Initial Claims, Business Inventories
Friday: Export/Import Prices, Mich Sentiment
::: Earnings I’m Watching This Week :::
Tuesday: 99 Cents Only (NDN), Sina.com (SINA), Titan Machinery (TITN)
Thursday: ArcSight (ARST), Hoku Scientific (HOKU), Lululemon (LULU)


