Category Archives: Weekly/After Stock Market Review Archives

Every Sunday evening a full market review is sent to members of SelfInvestors.com which provides commentary on the technical and economic picture, a review of the SelfInvestors Model Portfolio, the best/worst performing industries and ETF’s for the week, IPOs to watch, upcoming economic reports as well as notable earnings reports. In addition, on days when the market makes a significant move I’ll highlight the technical action discussing price/volume movements and support/resistance levels, industries/sectors leading and lagging the market as well as a Stock of the Day. In the past these were sent in the middle of the trading day but I’ve since begun publishing them and sending them to members after the market closes. These reports will be archived here as well.

Watch Bulls/Bears Battle From Sidelines; Stock of Day – Cynosure (CYNO)

What a difference a day makes, but such is typical around a Fed announcement.  I mentioned in my report last night that yes the day’s action was strong, but considering that price and volume was not exceptional and that trading on the day of the Fed decision is often a false move to be careful.  I thought we could very well close down today but of course never imagined the selling intensity would be so swift and decisive.  I’ve been using the terms like jeckyll and hyde and schizo to describe the action of this market over the past several months so today’s action is just more of the same!  In the past, we have recovered quickly from these kinds of sell offs, making it difficult to profit consistently in short positions.  Perhaps now that the Fed has indicated that their hand holding is now probably off the table, the kind of correction that the market has been flirting with for weeks will now ensue.  Today, there was no rumor of Fed action to save the day, just waves of institutional selling.  It was an ugly day, there’s no way around it.  Tomorrow could be just as ugly as we head into the weekend and there are critical support levels to be aware of for tomorrow and over the next few days:  Dow 13200 – 13250, S&P 1480 – 1490, Nasdaq 2700.  The important thing to remember is that no clear winner has emerged as the bulls and bears battle it out up here at all time highs in the Dow and S&P.  While they’re duking it out and gyrating the indices every which way but loose, it pays to be largely on the sidelines until we get a firm sense of direction.  I’ll continue to sound like a broken record in the hopes that maybe just maybe a few more people will heed my advice and preserve their capital after what has been a darn good 4 years of profits.

::: Major Indices Performance – The Numbers :::

(Note: volume averages are based on the average over the past 50 days)
Data as of 4:00EST – End of Day November 1st 2007

Nasdaq: DOWN 2.25% today with volume 45% ABOVE average
Nasdaq ETF (QQQQ) DOWN 1.87%, volume 46% ABOVE average
Dow: DOWN 2.6%, with volume 23% ABOVE the average
Dow ETF (DIA): DOWN 2.23%, volume 105% ABOVE the average
S&P ETF (SPY): DOWN 2.34%, volume 102% ABOVE the average
Russell Small Cap ETF (IWM): DOWN 3.86%, volume 117% ABOVE the average

::: SelflInvestors Leading Stocks :::

The Self Investors Leading Stocks Index is comprised of stocks in the Breakout Tracker, which is a database of the fastest growing companies near a breakout or having already broken out of a base.  Leading stocks were hit hard today, but not quite as hard as the Russell. .. still an awful day.

Summary:

* Decliners led Advancers 331 to 42
* Advancers were up an average of 2.76% today, with volume 158% ABOVE average
* Decliners were down an average of 3.56% with volume 37% ABOVE average
* The total SI Leading Stocks Index was DOWN 2.84% today with volume 50% ABOVE average

::: Where’s the Money Flowing :::

Many investing websites provide leading industries based on price performance alone. However, without accompanying volume levels, this can sometimes be misleading.  The only way that I know of to gauge industry/sector strength WITH volume levels is through the analysis of ETF’s.  A couple years ago this was not possible, but as more traders/investors use ETF’s they become a much better tool for gauging the health of the market and seeing where the money is flowing (or not flowing).  Using the proprietary SelfInvestors Demand Indicator score which measures price and volume movements, I’m able to quickly see which sectors/industries are seeing the greatest inflows of cash.  For a detailed look at how I go about gauging sector/industry strength please see the following post: http://selfinvestors.com/si/industry_tracking/

* Current Leading Sectors/Industries (over last 30 trading days):  
Gold, Internet Infrastructure, Gold Miners, Software, Agriculture
                                          
* Current Lagging Sectors/Industries (over last 30 trading days): 
Retail, Consumer Discretionary, Homebuilders, Semis

* Today’s Market Moving Industries/Sectors (UP):
Commodities, Bonds

* Today’s Market Moving Industries/Sectors (DOWN):
Financial, Homebuilders, Banks, Retail, Real Estate

::: Stocks :::

The stocks section will be an area where I highlight one stock selected from a group of stocks moving up with volume well above average and most likely breaking out of a base or consolidation.  Today’s stock is Cynosure (CYNO), a small company emerging in the very lucrative non invasive cosmetic surgery space. 

ABOUT: 

Cynosure, Inc. (Cynosure) develops and markets aesthetic treatment systems that are used by physicians and other practitioners to perform non-invasive procedures to remove hair, treat vascular lesions, rejuvenate skin through the treatment of shallow vascular lesions and pigmented lesions, temporarily reduce the appearance of cellulite, treat wrinkles, skin texture, skin discoloration and skin tightening, and to perform minimally invasive procedures for LaserBodySculpting and for the removal of unwanted fat.

FUNDAMENTALS: 

CYNO is a company that is really just beginning to hit its stride after losing money in 2000 – 2003, hitting profitability in ’04 but then taking a step back in 2005.  That’s all changed in the past 2 years for this small but fast growing company (revenues of just over 100 million over the past year).  After more than doubling earnings in 2006, the company is on pace to do so again in 2007 then moderate a bit in ’08 with 25% growth.  Those are fantastic numbers on the earnings side but what stands out most to me is the trend of accelerating revenue growth over the past 2 years.  Net margins (currently around 14%) and ROE (currently around 11%) aren’t exceptional by any means but solid.  Add in the growing number of institutions initiating positions and 40% management ownership and what you have is a company with tremendous potential.. to make you money! 

TECHNICAL:  

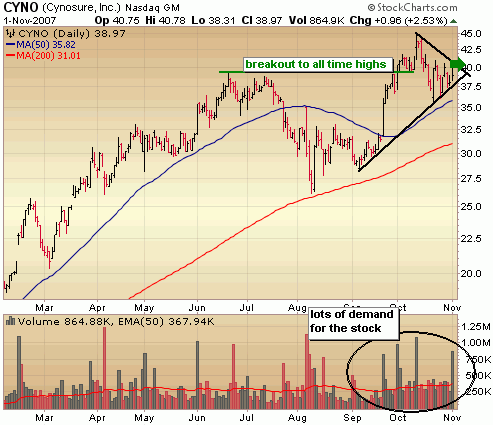
CYNO IPO’d back in late 2005 and broke out of its first base nearly a year later.  After more than doubling the stock fell into a new base which it broke out of in early October without ever forming a definitive handle.  The stock needed to digest the quick run in September and it’s done that by carving out a bullish triangle formation.  A break from this formation (around 40 – 41) is a buy opportunity.
SELFINVESTORS RATING: With a total score of 53/60 (26/30 for fundamentals, 27/30 for technical), Cynosure (CYNO) is a top SelfInvestors breakout stock.

Full Disclosure/Disclaimer: The stock of the day is by no means a buy recommendation.  Please do your own research and make a personal decision based on your own tolerance for risk.  I currently do not own a position in CYNO.
Will Market Wobble With Fed Wheels Off?; Stock of Day – Mastercard (MA)

Good party today.  It all started out with a very strong GDP number (wonder how much that will get revised downward?) which keeps recession worries off the table for now, tame inflation once again (huh?) and the Fed kicked it up a notch by spiking the punch.  There’s no denying it was a strong day with all major indices rising with good volume but when you consider the perfect storm of good news across the board, I’m a bit surprised we didn’t close stronger on much higher volume.  Let’s see what tomorrow brings.  Remember that trading on the day of the Fed announcement can be a knee jerk move and isn’t a good indicator of what tomorrow will bring.  A strong day tomorrow might push me into another long trade but I’m still reluctant to get aggressively long with major resistance in both the Dow and S&P500 still looming.  Sure the Nasdaq is in another world and technically much stronger, but we have to wonder what will be the catalyst following this Fed induced rally particularly with the bulk of earnings behind us and the Fed indicating that they’re done for awhile?  I’m maintaining neutrality here.

::: Major Indices Performance – The Numbers :::

(Note: volume averages are based on the average over the past 50 days)
Data as of 4:00EST – End of Day October 31st 2007

Nasdaq: UP 1.51% today with volume 19% ABOVE average
Nasdaq ETF (QQQQ) 1.42%, volume 20% ABOVE average
Dow: UP 1.00%, with volume 23% ABOVE the average
Dow ETF (DIA): UP .82%, volume 58% ABOVE the average
S&P ETF (SPY): UP 1.04%, volume 35% ABOVE the average
Russell Small Cap ETF (IWM): UP 1.29%, volume 37% ABOVE the average

::: SelflInvestors Leading Stocks :::

The Self Investors Leading Stocks Index is comprised of stocks in the Breakout Tracker, which is a database of the fastest growing companies near a breakout or having already broken out of a base.  A very good today for leading stocks which bodes well for this market.  The Self Investors Leading Stocks Index outperformed all major indices with good volume behind it.

Summary:

* Advancers led Decliners 294 to 79
* Advancers were up an average of 2.75% today, with volume 40% ABOVE average
* Decliners were down an average of 2.39% with volume 128% ABOVE average
* The total SI Leading Stocks Index was UP 1.66% today with volume 59% ABOVE average

::: Where’s the Money Flowing :::

Many investing websites provide leading industries based on price performance alone. However, without accompanying volume levels, this can sometimes be misleading.  The only way that I know of to gauge industry/sector strength WITH volume levels is through the analysis of ETF’s.  A couple years ago this was not possible, but as more traders/investors use ETF’s they become a much better tool for gauging the health of the market and seeing where the money is flowing (or not flowing).  Using the proprietary SelfInvestors Demand Indicator score which measures price and volume movements, I’m able to quickly see which sectors/industries are seeing the greatest inflows of cash.  For a detailed look at how I go about gauging sector/industry strength please see the following post: http://selfinvestors.com/si/industry_tracking/

* Current Leading Sectors/Industries (over last 30 trading days):  
Gold, Broker/Dealers, Internet Infrastructure, Gold Miners, Software, Agriculture
                                          
* Current Lagging Sectors/Industries (over last 30 trading days): 
Retail, Consumer Discretionary, Homebuilders, Semis

* Today’s Market Moving Industries/Sectors (UP):
US Oil, Gold Miners, Commodities, Energy, Materials, Natural Resources
(as dollar continues to plunge commodities continue to skyrocket! – interesting that only commodities made it to leaderboard today)

* Today’s Market Moving Industries/Sectors (DOWN):
Home Construction (suppose  traders were pricing in a 50 point cut just a bit)

::: Stocks :::

The stocks section will be an area where I highlight one stock selected from a group of stocks moving up with volume well above average and most likely breaking out of a base or consolidation.  Today’s stock is Mastercard (MA), currently the best way to play this increasingly cashless world.

ABOUT: 

MasterCard Incorporated (MasterCard) is a global payment solutions company that provides a variety of services in support of the credit, debit and related payment programs of nearly 25,000 financial institutions. Through the Company’s three-tiered business model as franchisor, processor and advisor, it develops and markets payment solutions, process payment transactions, and provide consulting services to its customers and merchants. The Company manages a family of payment card brands, including MasterCard, MasterCard Electronic, Maestro and Cirrus, which it licenses to its customers. MasterCard’s general purpose card brands include MasterCard, Visa, American Express, JCB, Diners Club and Discover. MasterCard generate revenues from the fees that it charges its customers for providing transaction processing and other payment-related services (operations fees), and by assessing its customers based on the dollar volume of activity on the cards that carry its brands (assessments).

FUNDAMENTALS: 

Plastic payment providers such as Mastercard (MA) are a virtual money tree in that they make money on every transaction out there with very little change in the margins.  It’s not a perfect world though.  Lawsuits from large merchants are a constant threat to the profit machine as Mastercard (MA) saw in 2003 when it lost 2.90/share after large settlement costs.  However, since then the company has been able to avoid large legal costs and returned to profitability in 2004 with earnings of 1.76 share which rose 34% in ’05 to 2.35/share, 45% in ’06 to 3.41 and is expected to rise another 46% here in ’07 (but those estimates need to be revised – looks like earnings will end up being closer to 55 – 60% higher over ’06 when it’s all said and done).  So there you have it.  Three years in a row of accelerating earnings growth and over the past year revenue growth has been picking up.  With net margins (19%)and ROE (28%) spiking over the past year this is clearly a company hitting on all cylinders.

TECHNICAL:  

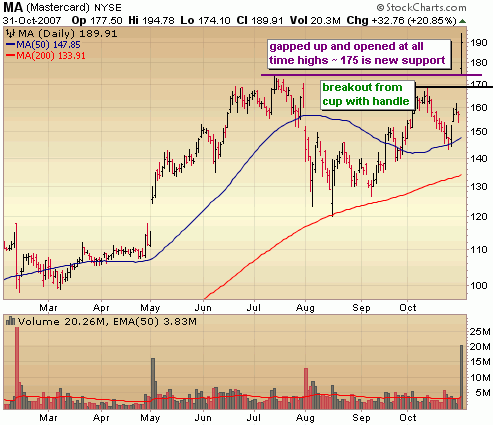
Mastercard (MA) was certainly the headliner today with a 20% surge out of a cup with handle base to new all time highs.  It’s too bad it couldn’t breakout like this AFTER the Fed announcement today because I decided not to initiate any new entries today so may have missed out on a good entry point in what will be a great core holding in any portfolio.  That’s OK.. nothing wrong with staying disciplined.  If you didn’t catch this one at the open and are waiting for an entry like I am I’d look to start nibbling at 185 or lower with a small position and then add to a long term position along the way. 

SELFINVESTORS RATING: With a total score of 52/60 (27/30 for fundamentals, 25/30 for technical), Mastercard (MA) is a top SelfInvestors breakout candidate.

Full Disclosure/Disclaimer: The stock of the day is by no means a buy recommendation.  Please do your own research and make a personal decision based on your own tolerance for risk.  I currently do not own a position in Mastercard (MA)

Don’t Be Lured by Rumor & Another Fed Life Preserver; Hot China IPO – Giant Interactive (GA)

What a strange week it was.. well really just one day which set the tone for the end of the week.  On Monday and Tuesday, the market played out predictably with the selling momentum continuing early Monday morning followed by a weak bounce into the close and following through on Tuesday.  On Wednesday, the Merrill Lynch loss sent the market into a tailspin early with very heavy selling. 

It was the kind of selling you typically don’t recover from and given the sell off of the previous Friday, this kind of action should not have been a surprise. I fully expected the indices to fall off a cliff in the last hour of trading and head straight for those important 200 day moving averages.  After all, you don’t just capitulate out of the blue like that unless you have extreme oversold conditions (like we had back in August) or you have some big announcement such as more Fed action.  Sure enough, inexplicably, buyers rushed in at the end of the day on Wednesday on what?  A rumor of a surprise Fed rate cut to which the Fed denied.  It led to a short term capitulation day which fueled short covering and a bit of retail buying and probably just delays the inevitable which is further deterioration and a test of those 200 day moving averages. 

I just don’t like this market.  It’s fueled by rumors which over the past several months seems to be becoming a common occurrence.  Combine that with a Fed hellbent on cutting rates and it makes it very difficult to make good technical analysis reads.  The fact of the matter is that this market is weakening and the onus is on the bulls.  I like what was said over at Minyanville recently: "Opportunities are made up easier than losses."  It sums up the current situation perfectly. 

Next week earnings reports continue to pour in, the Fed makes its rate decision on Wednesday along with Construction Spending numbers and GDP.  Also on tap is inflation data, pending home sales, auto/truck sales and capping off the week  a read on unemployment figures.  Considering the run the market has had, the deteriorating technicals, the rumors, the Fed and all the economic numbers coming this week it’s best to remain largely in cash. 

::: Model Portfolio Update :::

Despite continuing to play conservatively with a nearly 50% cash position, the Self Investors Model Portfolio had another good week, out pacing the S&P by a bit and pushing the year to date return to a very good 24.4% (about 3x the return of the S&P500).  My strategy continues to be to trade small positions in high momentum stocks and locking in profits fairly quickly along with holding a few core positions in Google (GOOG), Cisco (CSCO) and Diana Shipping (DSX).  During the week I closed out positions in LULU (27% gain), ALTI (16% gain), FREE (4% gain) & CTEL (14% loss).  I held on to a very small CTEL position much longer than I ordinarily would, but not quite long enough!  It got a big burst of buying on Friday and again looks like a great swing trade here.  One core position was added and 2 new Quick Strike Profit plays to replace the 3 closed positions.  My current allocation is 50% long, 10% short and 40% cash. 

::: Best/Worst Performers :::

– Top 10 Performing Industries For the Week –

1. Medical Practitioners: 15.75%
2. Education & Training Services: 13.35%
3. Residential Construction: 10.45%
4. Computers Wholesale: 8.25%
5. Internet Info Providers 7.95%
6. Toy & Hobby Stores: 7.80%
7. Steel & Iron:  7.55%
8. Manufactured Housing: 7.15%
9. Industrial Metals & Minerals: 6.80%
10. REIT – Healthcare Faclilities: 6.35%

– Top 10 Worst Performing Industries For the Week –

1. Surety & Title Insurance: -11.00%
2. Healthcare Plans: -4.35%
3. Security Software & Services: -4.30%
4. Confectioners: -4.05%
5. Catv Systems: -4.00%
6. Semiconductor – Equipment & Materials: -3.60%
7. Electronics Wholesale: -3.50%
8. Networking & Communication Devices -3.25%
9. Semiconductor – Specialized: -3.05%
10. Semiconductor – Memory Chips: -2.90%

– Top 5 Best Performing ETFs For the Week –
 
1. Herzfeld Caribbean Basin  (CUBA) 13.65%
2. Morgan Stanley India (IIF)  12.40%
3. India Fund (IFN) 11.80%
4. China Fund (CHN) 11.25%
5. Ishares Home Construction (ITB) 10.90%

– Worst 5 Performing ETF’s –

1. HLDRS Semiconductors (SMH)  -5.15%
2. Ishares Semis (IGW) -4.90%
3. PowerShares Dynamic Semis (PSI) -2.60%
4. HLDRS Broadband (BDH) -1.00%
5. Powershares Agriculture (DBA)  -1.00%

:::  IPO’s Worth Watching for This Week :::

The IPO pipe line remains very strong and once again a few great looking China IPO’s.

1.  Giant Interactive (GA):   The Chinese online role-playing game developer (formerly known as ZTgame) is all about the masses, creating massively multiplayer online (MMO) games, played by tens of of thousands of players through networked game servers. Its first internally developed game, ZT Online, was launched in 2006. A paid edition of ZT Online and its newest game, Giant Online, will have their commercial debut in 2007. The company has more then 140 game developers, and its prepaid game cards and game points are sold in more than 116,500 retail locations, such as bookstores, Internet cafes, and software stores.   Trading set to begin on Tuesday.

2. CNinsure (CISG): The Chinese independent insurance agency and brokerage firm distributes insurance products underwritten by domestic and foreign insurance companies operating in China. It also provides certain insurance-related services (such as damage assessment and 24-hour emergency assistance in select cities) from more than 150 sales and service locations in eight provinces spread throughout China. The company began distributing individual life insurance products in 2006. It plans to continue expansion of that sector while growing its property and casualty business divisions.  Trading set to begin on Wednesday.

3.  Deltek (PROJ):  The company provides project management software designed to meet the needs of professional services firms and project-based businesses. Its applications handle expense reporting, human resources administration, materials management, customer management, and sales force automation. Deltek integrates tools from partners such as Cognos and Microsoft with its own software, and it provides consulting and implementation services. Trading set to begin Thursday

4. Scope Metals Group (SCPE):  distributes and supplies aluminum, stainless steel, brass copper, bronze, titanium, and nickel alloy products configured into sheets, coils, plates, bars, pipes, flanges, fasteners, valves, and a slew of other off-the-shelf items. With primary operations in Israel, the company’s products reach industrial manufacturers in Israel, Turkey, Greece, and the Middle East. Acquisitions and organic growth have expanded the geographical scope of the company to include the US, Europe, and China. Scope Metals Group serves clients in such industries as aerospace, chemicals, electronics, construction, and energy.. Trading set to begin on Friday.

5. Genoptix (GHDX): The biotechnology company is a specialized laboratory service provider founded in 1997. It analyzes blood and tissue samples in order to diagnose diseases and markets those services to community-based hematologists and oncologists (aka hem/oncs) treating malignancies of the blood and bone marrow, as well as other types of cancer. Its key service offerings are COMPASS (short for Comprehensive Assessment) and CHART (newer service offering introduced in 2007). Trading set to begin on Tuesday.

6.  Neutral Tandem (TNDM):  provides third-party interconnection services to competitive carriers via tandem switches, which allow wireline, wireless, and broadband phone providers to exchange traffic between networks without direct connections. Neutral Tandem’s services are offered in more than 45 US metropolitan markets as an alternative to using switches provided by the incumbent local exchange carrier (ILEC). The company’s customers include Sprint Nextel, Comcast Cable, and AT&T.  Trading set to begin on Friday.

::: Upcoming Economic Reports (10/29/07 – 11/2/07) :::

Monday:         None
Tuesday:       Consumer Confidence
Wednesday: Fed Rate Decision, GDP, Chicago PMI, Construction Spending, Crude Inventories
Thursday:      Personal Income/Spending, CPI, Initial Claims, Pending Home Sales, Auto/Truck Sales
Friday:            Nonfarm Payrolls, Unemployment Rate, Factory Orders

::: Upcoming Notable Earnings Reports :::

Monday:  Jack Henry & Associates (JKHY), Superior Energy (SPN), Atheros Communications (ATHR), ShoreTel (SHOR), Credicorp (BAP), Interactive Intelligence (ININ),

Tuesday:  Ceradyne (CRDN), BE Aerospace (BEAV), Aluminum Corp of China (ACH), Chipotle Mexican Grill (CMG), Wynn Resorts (WYNN), W-H Energy (WHQ), Ritchie Bros Auctioneers (RBA), Commvault Systems (CVLT), Under Amour (UA)

Wednesday: GlobalSantaFe (GSF), Central European Distribution (CEDC), Cameco (CCJ), Huron Consulting (HURN), Natco Group (NTG), Garmin (GRMN), Manitowoc (MTW), Mastercard (MA), Transocean (RIG)

Thursday: Oceaneering (OII), Pride International (PDE), eHealth (EHTH), Cbeyond (CBEY), Atlantic Tele-Network (ATNI), Morningstar (MORN), Capella Education (CPLA), Cynosure (CYNO), Mindray Medical (MR), Diodes (DIOD), Strayer Education (STRA), DealerTrak (TRAK), Nymex Holdings (NMX), Rowan Companies (RDC), ANSYS (ANSS), Cameron Intl (CAM), Blackbaud (BLKB), GFI Group (GFIG), Flotek Industries (FTK), Harris Corp (HRS)

::: In Case You Missed It – SelfInvestors Blog Entries of the Past Week :::

1. Trade of the Day – General Moly (GMO) Cup With Handle Breakout

2. VistaPrint (VPRT), MEMC Electronic Materials (WFR) Breakout to All Time Highs

3. Profit From The Visa IPO Before It Goes Public?

4. Abaxis (ABAX) Soars, VASCO Data Security (VDSI) Plunges

5.  Reversal Indicates Short Term Support; Stock of Day – IntercontinentalExchange (ICE)

6.  Phase Forward (PFWD) & Vocus (VOCS) Soar on Earnings

7.  Satyam (SAY) & Millicom (MICC) Break Out of Cup With Handle Bases

8.  Big Wall Street Myth: The Self Investor Can’t Be Successful

9.  Petmed Express (PETS) Poised for Breakout After Earnings


Reversal Indicates Short Term Support; Stock of Day – IntercontinentalExchange (ICE)

In perhaps one of the most volatile years of trading we have seen in a very long time, today’s action was nothing more than a microcosm.  It was a jeckyll and hyde kind of day with the market plummeting early on after a big loss from Merrill, a miss from Amazon and like clockwork.. another poor housing number.  Given the intensity of the selling volume early on, it looked as if we would end down big.. perhaps bigger than Friday.  Inexplicably, the bleeding stopped, support was found and buyers (and short covering) fueled an end of day buying frenzy that nearly wiped away all of the losses.  Perhaps the wild volatility is just another clue that major top is being put in, but in the shorter term today’s reversal indicates further strength ahead.  Remember: bull markets die hard.  I don’t think today’s reversal was strong enough to spring up to test the highs again but we could push back to Dow 14,000 and SP500 1550.  However, while short term strength is highly possible from here, I’m still highly recommending caution up here.  Do not hold stocks through earnings, do not initiate large positions and absolutely do not use margin.

::: Major Indices Performance – The Numbers :::

(Note: volume averages are based on the average over the past 50 days)
Data as of 4:00EST – End of Day October 24th 2007

Nasdaq: DOWN .88% today with volume 37% ABOVE average
Nasdaq ETF (QQQQ) DOWN .76%, volume 133% ABOVE average
Dow: DOWN .01%, with volume 20% ABOVE the average
Dow ETF (DIA): UP .06%, volume 62% ABOVE the average
S&P ETF (SPY): DOWN .18%, volume 83% ABOVE the average
Russell Small Cap ETF (IWM): DOWN .65%, volume 42% ABOVE the average

::: SelflInvestors Leading Stocks :::

The Self Investors Leading Stocks Index is comprised of stocks in the Breakout Tracker, which is a database of the fastest growing companies near a breakout or having already broken out of a base.  Leading stocks performed about in line with what the Nasdaq did, so weaker than the broad market today.

Summary:

* Decliners led Advancers 240 to 132
* Advancers were up an average of 1.54% today, with volume 21% ABOVE average
* Decliners were down an average of 2.08% with volume 23% ABOVE average
* The total SI Leading Stocks Index was DOWN .8% today with volume 22% ABOVE average

::: Where’s the Money Flowing :::

Many investing websites provide leading industries based on price performance alone. However, without accompanying volume levels, this can sometimes be misleading.  The only way that I know of to gauge industry/sector strength WITH volume levels is through the analysis of ETF’s.  A couple years ago this was not possible, but as more traders/investors use ETF’s they become a much better tool for gauging the health of the market and seeing where the money is flowing (or not flowing).  Using the proprietary SelfInvestors Demand Indicator score which measures price and volume movements, I’m able to quickly see which sectors/industries are seeing the greatest inflows of cash.  For a detailed look at how I go about gauging sector/industry strength please see the following post: http://selfinvestors.com/si/industry_tracking/

* Current Leading Sectors/Industries (over last 30 trading days):  
Gold, Internet Infrastructure, Gold Miners, Software, Agriculture
                                          
* Current Lagging Sectors/Industries (over last 30 trading days): 
Retail, Consumer Discretionary, Homebuilders, Semis

* Today’s Market Moving Industries/Sectors (UP):
Energy, Commodities, Utilities

* Today’s Market Moving Industries/Sectors (DOWN):
Internet, Semis, Broadband, Semis, Networking

::: Stocks :::

The stocks section will be an area where I highlight one stock selected from a group of stocks moving up with volume well above average and most likely breaking out of a base or consolidation.  Today’s stock is Intercontinentalexchange (ICE), a highly rated exchange stock (a group that is on the move once again)

ABOUT: 

IntercontinentalExchange, Inc. operates as an electronic global futures and over-the-counter (OTC) marketplace for trading an array of energy products. It also operates as a soft commodities exchange. IntercontinentalExchange offer an integrated electronic platform for side-by-side trading of energy products in both futures and OTC markets. Through its electronic trading platform, the Company’s marketplace brings together buyers and sellers of derivative and physical commodities contracts. IntercontinentalExchange also offers open-outcry trading in Board of Trade of the City of New York, Inc (NYBOT) regulated futures and options markets. The Company conducts its OTC business directly and its regulated energy futures business through its wholly owned subsidiary, ICE Futures. It operates in three segments: energy futures, OTC and market data. On January 12, 2007, it acquired NYBOT. In July 2007, the Company acquired ChemConnect, Inc.’s commodity trading business.

FUNDAMENTALS: 

IntercontinentalExchange (ICE) is a company that (with the exception of 2003) has posted exceptional growth in each of the past several years.  The company posted its first profitable year in 2001 and since that time has posted year over year earnings growth of 125%, -61%, 67%, 140% and 150%.  The company isn’t expected to continue that accelerating growth but is still expected to post growth in the 40 – 50% range both this year and next.  Not too shabby at all.  With net margins at 45% and return on equity at 25% (although has dipped in the past year), it’s clear that ICE continues to exhibit all the characteristics of what I would call a home run stock.

TECHNICAL:  

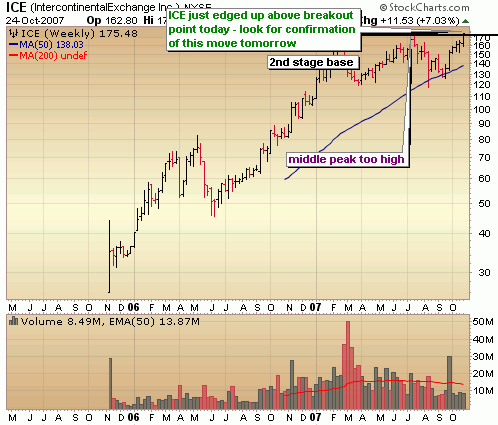
There is no better day than today to feature IntercontinentalExchange (ICE).  The stock broke out of a long double bottom base today to new all time highs with good volume behind it.  Considering this is a 2nd stage base, this is a stock that has considerable room to run.  How far will largely depend on its earnings report tomorrow morning, but I expect the company to once again report excellent results and the stock to continue moving higher even if it dips a bit after earnings.  If there is a negative (and you can usually find one!), it’s that the middle peak of the double bottom base is much too high in the formation, making it a bit more prone to failure.  To reduce the risk in these kinds of situations, I like to let the stock break out and see how it pulls back.  If it breaks out with strong volume, then pulls back with light selling volume, your entry is far less risky than buying at the initial breakout.  Sure you may miss it, but who cares.  There are plenty of other opportunities out there!  ICE is one of my favorites.  It’s near the top of my watch list and should certainly be at the top of yours!

SELFINVESTORS RATING: With a total score of 51/60 (27/30 for fundamentals, 24/30 for technical), IntercontinentalExchange (ICE) is a top SelfInvestors breakout candidate.

Full Disclosure/Disclaimer: The stock of the day is by no means a buy recommendation.  Please do your own research and make a personal decision based on your own tolerance for risk.  I currently do not own a position in ICE but will consider one after it posts earnings tomorrow.

Focusing on Technical Analysis Got You Out Near the Top; Hot IPO – Longtop Financial (LFT)

I know I’ve said all this before but paying attention to the commentary of the newspapers, the magazines and the talking heads on CNBC is enough to well.. make your head spin.  Recession talk is bantered about amidst the back drop of Jim Cramer exclaiming Dow 14500 by the end of the year.  A few weeks ago IBD hinted that a recession is unlikely based on one jobs report against a back drop of CEO’s from major corporations sounding the alarm of potential economic weakness, further housing deterioration, etc.  The contradictions of opinions and background noise can and will keep you from your goal of making money in the market.  Only technical analysis of the market can keep you focused on how strong or weak the market really is.  Anyone who dismisses technical analysis as irrelevant should, in my opinion not be making decisions to invest their own money let alone money for their clients.  The big myth on Wall Street is that you can’t time the market.  No, you won’t always get in at the bottom and out at the top but with sound technical analysis you will capture the bulk of the move a high percentage of the time. 

Why does technical analysis work?  The reason is simple supply and demand.  Spikes in price and volume reveal the demand (or lackthereof) in stocks from the big fellas (institutions like banks, mutual funds, pension funds, etc) Since 60 – 70% of the move in the mark is the result of their trading it pays to follow their moves. .. and those moves show up in the charts!  A major focus of the blog is to analyze the charts for you to help eliminate all the noise that’s out there.  Over the past few weeks I’ve been recommending to my readers to be cautious and to begin locking in profits so a move like we had on Friday should not have been all that painful.

October 1st
"…. it’s clear that institutions didn’t do a whole of participating in today’s rally.  It seemed to be more of a case of the retail side fearing missing the next move up and some short covering.  Considering that the market is being led by commodities (no, Gold shouldn’t lead the way in a bull market) along with overbought conditions quite frankly I’m becoming skeptical of this rally.  I’m continuing to play it with small long positions and added a couple more today but I’ll be vigilant about looking for more warning signs and even more vigilant about protecting my profits."

October 7th
"…until the institutional money starts pouring in, this market rise remains a house of cards.  Notice how as the Dow pushes to record highs, but volume behind the move recedes.  The market looks tired up here and at the very least needs to take a breather and spend some time sideways.  At worst, this is the end of the road and marks a double top…

October 9th
"With the Nasdaq nearing some resistance at the upper level of a wide channel, the market may be soon be looking for excuses to take profits.  Now may be a good time to find excuses to take profits of your own."

October 11th
"I think tomorrow’s action will be fairly important.  Will retail sales and PPI data on the agenda for tomorrow, will it send the the market into another tailspin and confirm the selling of today?  It’s anyone’s guess but as I’ve been saying for several days now it’s best to remain cautious up here."

October 16th
"The bottom line is that all indications point to further deterioration in the coming weeks.  Preserve that capital and consider locking in profits quicker."

I highlight my remarks on the market  over the past couple weeks not to prove I was right but rather to serve as a reminder that simple technical analysis can provide you with the skills to time the market to a certain degree.  The deterioration over the past  several days had been forecasted well before with the divergence between and volume and finally with the high volume reversal on October 11th and finally a break of key trendlines on October 16th. 

Where do we go from here?  Down is the obvious answer.  With the degree of selling momentum we had on Friday, there will be further deterioration.  Now some of the volume on Friday can be attributed to options expiration so it wasn’t as severe as it appeared at first glance but I think we have another 2% down to go before we begin bouncing.  However, based on the action over the past few weeks I think it will be very difficult to take out those October highs before the end of the year. 

::: Model Portfolio Update :::

My strategy of playing cautious with a large cash position of near 50% but initiating positions in fairly aggressive stocks continues to pay off extremely well.  Despite a week in which the S&P was off 4%, the SelfInvestors Model Portfolio continued to push higher led by a 2nd position in LULU initiated on Oct. 16th as well as long time hold Google (GOOG) which continues to defy gravity.  Also helping the portfolio to greatly outperform the market was a hedge position initiaiton in the Nasdaq Ultra Short (QID) on Oct 12th which I continue to hold along with a short position in BTH which as was added this past week.  With a year to date return of 21.8%, the Model Portfolio has now returned nearly 4x that of the S&P 500 and is in position to be one of the top performing Model Portfolios of all advisory services for the 2nd year in a row.  If you’ve been following my review of the portfolio here in 2007 you know that I struggled a bit in the middle of the year so this is a big turn around and hopefully is a good reminder to all who trade their own accounts that there will be peaks and valleys along the way.  The key is to keep emotions in check, stick with the strategies that have been successful in the past  and remain confident! 

::: Best/Worst Performers :::

– Top 10 Performing Industries For the Week –

1. Computer Peripherals: 5.85%
2. Dairy Products: 2.70%
3. Processing Systems & Products: 2.50%
4. Tobacco Products: 1.45%
5. Major Integrated Oil & Gas: 1.00%
6. Cigarrettes: .85%
7. Personal Computers:  .80%
8. Semiconductor – Equipment & Materials: .80%
9. Air Services – Other: .65%
10. Independent Oil & Gas: .50%

– Top 10 Worst Performing Industries For the Week –

1. Surety & Title Insurance: -19.35%
2. Residential Construction: -11.50%
3. Mortgage Investment: -11.20%
4. Savings & Loans: -10.25%
5. Sporting Goods Stores: -9.40%
6. Trucks & Other Vehicles: -9.20%
7. Banks – SE: -9.10%
8. Home Improvement Stores: -8.90%
9. Investment Brokerage: -8.70%
10. Recreational Goods: -8.60%

– Top 5 Best Performing ETFs For the Week –
 
1. US Oil (USO)  4.90%
2. Ishares Commodities (GSG) 3.55%
3. Powershares Commodity (DBC) 2.80%
4. Powershares Agriculture (DBA) 2.80%
5. Ishares Gold (IAU) 2.10%

– Worst 5 Performing ETF’s –

1. Herzfeld Cuba (CUBA)  -18.15%
2. HLDRS Utilities (UTH) -14.70%
3. Ishares Home Construction (ITB)  -10.70%
4. Morgan Stanley China (CAF) -10.55%
5. KBW Banking (KRE)  -10.30%

:::  IPO’s Worth Watching for This Week :::

There are few great looking IPO’s coming this week – yet another Chinese IPO, 2 strong energy IPO’s and another srong women focused retailer (the last one, Lululemon has performed remarkably).

1.  Longtop Financial Technologies (LFT):  Longtop Financial Technologies makes software to help manage your hard cash. The firm designs both custom-built and standard software and services for financial services clients in China. Its channel-related software enables banks to interact with customers through numerous channels, including ATMs, bank tellers, call centers, and Web sites. Its business-related products help banks conduct transactions like international trade finance, payments and settlements, and credit card operations. The firm’s management-related software supports clients’ internal operations. Among its customers are several of China’s leading banks, including China Construction Bank, Agricultural Bank of China, and Bank of China.  Trading set to begin on Wednesday.

2. CVR Energy (CVI): an independent refiner and marketer of high value transportation fuels and, through a limited partnership, a producer of ammonia and urea ammonia nitrate, or UAN, fertilizers.  Trading set to begin on Tuesday.

3.  Ulta Salon, Cosmetics & Fragrance (ULTA):  operates 200-plus stores in about 25 states. More than a third of its stores are located in Illinois, Texas, and California. Ulta sells cosmetics, fragrances, skin and hair care products and appliances, and accessories. Ulta stores also offer hair salon services, as well as manicures, pedicures, massages, and other beauty and spa treatments. The company’s Web site ULTA.com is being upgraded to offer about 9,000 products and more than 400 brand names. Trading set to begin Thursday

4. Vanguard Natural Resources (VNR):  Vanguard Natural Resources is at the forefront of oil and gas exploration in the hills of the Appalacia Basin. Focusing its efforts in southeastern Kentucky and northeastern Tennessee, the company acquires and develops oil and gas properties in the region. Trading set to begin on Wednesday. 

::: Upcoming Economic Reports (10/22/07 – 10/26/07) :::

Monday:         None
Tuesday:       None
Wednesday: Existing Home Sales, Crude Inventories
Thursday:      Durable Orders, New Home Sales
Friday:            Mich Sent (rev)

::: Upcoming Notable Earnings Reports :::

Monday:  Apple (AAPL), Weathorford International (WFT), Astec Industries (ASTE)

Tuesday:  Smith International (SII), Satyam Computer (SAY), Trimble Navigation (TRMB), Precision Castparts (PCP), Anixter Intl (AXE), T Rowe Price (TROW), Riverbed Technology (RVBD), Centex (CTX), Coach (COH)

Wednesday: VMWare (VMW), Alcon (ACL), Grant Prideco (GRP), Legg Mason (LM), Complete Production Services (CPX), Freeport McMoRan (FCX), Monster Worldwide (MNST), Starent Networks (STAR), VCA Antech (WOOF), Chicago Mercantile (CME), F5 Networks (FFIV), Taser Intl (TASR)

Thursday: LifeCell (LIFC), Companhia Vale do Rio (RIO), Vasco Data Security (VDSI), Ultimate Software (ULTI), Celgene (CELG), Syntel (SYNT), Stericycle (SRCL), FLIR Systems (FLIR), Diamond Offshore (DO), EMC (EMC), MEMC Electronic Materials (WFR), Baidu.com (BIDU), Dynamic Materials (BOOM), Intercontinental Exchange (ICE), Double-Take Software (DBTK), Life Time Fitness (LTM), LKQ Corp (LKQX), Synchronoss Technologies (SNCR), Spartan Motors (SPAR), Varian Sem Equipment (VSEA), VistaPrint (VPRT)

Friday: CountryWide Financial (CFC), IDEXX Laboratories (IDXX), Tidewater (TDW), Fortune Brands (FO)

::: In Case You Missed It – SelfInvestors Blog Entries of the Past Week :::

1. Putting the Plural in SelfInvestors – Options Trading Lessons Begin

2. Google (GOOG) Hitting On All Cylinders, Still No Reason To Sell

3. Holding Google (GOOG) Through Earnings Again

4. Trade of the Day – Score With Stripper Stocks: VCG Holdings (PTT)

5.  More Distribution & Broken Trend Lines

6.  Breakout Stocks Highlights! China, Shipping & Oil

More Distribution & Broken Trend Lines

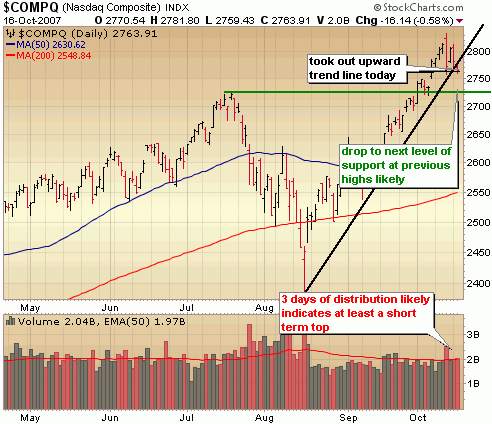
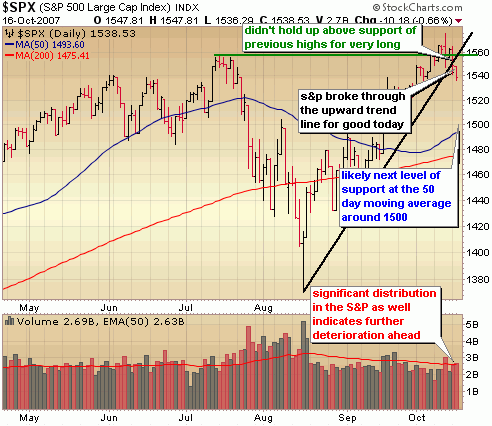
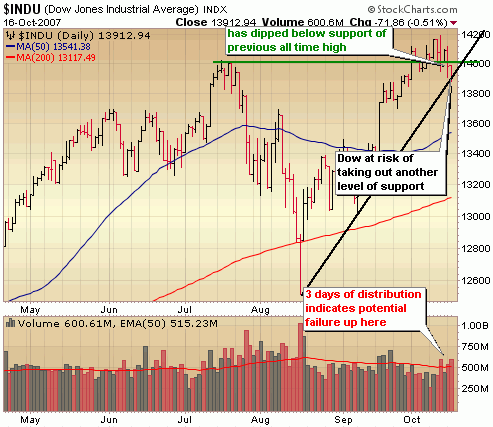
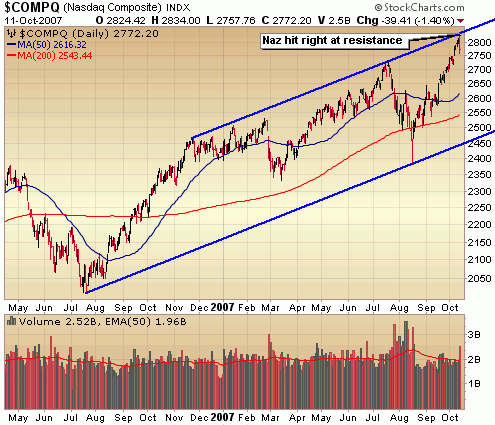
The credit woes that plagued the market in August got a bit of reprieve following the euphoria of the big Fed rate cut, but stark reminders are emerging within the financial statements of financial companies as  they begin reporting earnings.  The ramp up in oil prices may be finally be causing some concern as well.  From my perspective the reasons for selling don’t matter much though.  All I’m concerned with is price and volume movement and support/resistance levels.  We can all debate until we’re blue in the face how severe the credit woes are or how long housing will remain mired in a slump or at what point oil prices become a major concern for the economy.  What stands out to me most is the high volume reversal of last Thursday and subsequent back to back distribution days yesterday and today resulting in a break of the upward trend lines of the major indices.  The action indicates a top at least temporarily.  In my after market report last Thursday, I discussed the major resistance area of the Nasdaq but after re-reading what I wrote I realized that I didn’t highlight the selling intensity as well as I should have.  It was very important, topping like action and I should have centered around that more than I did.  The bottom line is that all indications point to further deterioration in the coming weeks.  Preserve that capital and consider locking in profits quicker.

Note the big intraday reversal in the Nasdaq on Oct 11th.  The intraday high on that day just happened to touch major resistance at the top of a long upward trend.  Coincidence?  No way.  Today we broke through a steep shorter term upward trend line and there is a good chance that the Nasdaq will deteriorate further and test the next level of support at those July highs around 2725.

The S&P wasn’t able to hold above the July highs very long and broke through its own upward trend line for good today with some significant volume behind it.  While the selling wasn’t particularly intense today, it does mark the 3rd day of distribution in just the last 4 trading days.  There isn’t any major support from here until we get to around 1500 so there is some room left to the downside from here.

The Dow is hanging on by a thread at support of its upward trend line but volume levels indicate that won’t last long.  I think we’ll at the very least test 13600 in the coming days.

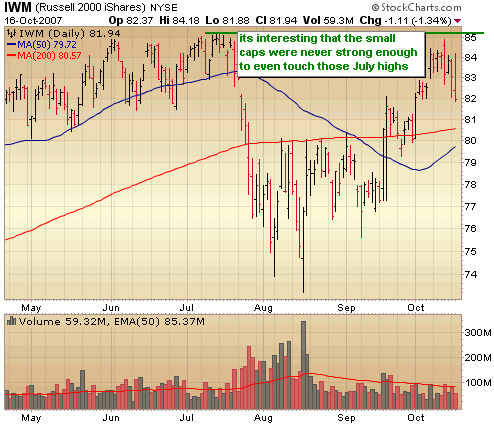
It’s interesting that the Russell never touched the July highs.

::: Major Indices Performance – The Numbers :::

(Note: volume averages are based on the average over the past 50 days)
Data as of 4:00EST – End of Day October 16th 2007

Nasdaq: DOWN .58% today with volume 2% ABOVE  average
Nasdaq ETF (QQQQ) DOWN .47%, volume 52% ABOVE average
Dow: DOWN .51%, with volume 17% ABOVE the average
Dow ETF (DIA): DOWN ..61%, volume 10% BELOW the average
S&P ETF (SPY): DOWN .79%, volume 12% BELOW the average
Russell Small Cap ETF (IWM): DOWN 1.1%, volume 42% BELOW the average

::: SelflInvestors Leading Stocks :::

The Self Investors Leading Stocks Index is comprised of stocks in the Breakout Tracker, which is a database of the fastest growing companies near a breakout or having already broken out of a base.  Today’s selling wasn’t particularly intense as indicated by the action in leading stocks.  Volume levels did not indicate institutions were dumping large numbers of shares.

Summary:

* Decliners led Advancers 251 to 112
* Advancers were up an average of 1.46% today, with volume 3% ABOVE average
* Decliners were down an average of 1.94% with volume 4% BELOW average
* The total SI Leading Stocks Index was DOWN .89% today with volume 2% BELOW average

::: Where’s the Money Flowing :::

Many investing websites provide leading industries based on price performance alone. However, without accompanying volume levels, this can sometimes be misleading.  The only way that I know of to gauge industry/sector strength WITH volume levels is through the analysis of ETF’s.  A couple years ago this was not possible, but as more traders/investors use ETF’s they become a much better tool for gauging the health of the market and seeing where the money is flowing (or not flowing).  Using the proprietary SelfInvestors Demand Indicator score which measures price and volume movements, I’m able to quickly see which sectors/industries are seeing the greatest inflows of cash.  For a detailed look at how I go about gauging sector/industry strength please see the following post: http://selfinvestors.com/si/industry_tracking/

* Current Leading Sectors/Industries (over last 30 trading days):  
Gold,  Internet Infrastructure, Gold Miners, Software, Agriculture
                                          
* Current Lagging Sectors/Industries (over last 30 trading days): 
Retail, Homebuilders, Semis

* Today’s Market Moving Industries/Sectors (UP):
Oil

* Today’s Market Moving Industries/Sectors (DOWN):
Home Construction, Biotech, Internet, Financial, Realty, Oil & Gas Services (fairly broad selling today)

::: Stocks :::

The stocks section will be an area where I highlight one stock selected from a group of stocks moving up with volume well above average and most likely breaking out of a base or consolidation.  Sorry, short on time tonight so no stock of the day today but you might like to have a look at these leading stocks that above the 50 and 200 day moving averages and moved up with significant volume today:

QMAR, LULU, RICK, TEF, ESLT, DAR, SOLF and RVBD

A Silver Membership at SelfInvestors for just $19.95/month gets you all the tracking tools for leading stocks, IPO’s and ETF’s!  More details here.

Avalanche of Earnings Begins; Another China IPO – Noah Education (NED)

It’s been a busy weekend for me so no market analysis this weekend.  I’ll have an update on the technicals mid next week. 

::: Best/Worst Performers :::

– Top 10 Performing Industries For the Week –

1. Nonmetallic Mineral Mining: 9.15%
2. Copper: 7.65%
3. Oil & Gas – Independent: 6.40%
4. Agricultural Chemicals: 6.30%
5. Gold: 6.25%
6. Silver: 6.05%
7. Oil & Gas Major Integrated:  5.55%
8. Industrial Metals & Minerals: 8.30%
9. Oil & Gas Equipment & Services: 4.95%
10. Data Storage Devices: 4.70%

– Top 10 Worst Performing Industries For the Week –

1. Semiconductor – Memory: -5.05%
2. Office Supplies: -5.00%
3. Toy & Hobby Stores -4.90%
4. Consumer Services: -4.20%
5. Semiconductor – Specialized: -4.00%
6. Banks – SE: -3.70%
7. Apparel – Clothing: -3.65%
8. Home Health Care: -3.25%
9. Banks – Pacific: -3.25%
10. Semiconductors – Integrated: -3.15%

– Top 5 Best Performing ETFs For the Week –
 
1. Internet Infrastructure  (IIH)  12.05%
2. Ishares China (FXI) 5.90%
3. India Fund (IFN) 5.35%
4. Central European & Russia Fund (CEE) 5.15%
5. Market Vectors Gold Miners  (GDX) 4.85%

– Worst 5 Performing ETF’s –

The China Funds are beginning to crack a bit with distribution over the past 2 weeks.

1. Greater China Fund  (GCH)  -9.10%
2. HLDRS Semis (SMH) -5.50%
3. Turkish Investment Fund (TKF)  -4.70%
4. Ishares Home Construction (ITB) -4.65%
5. Morgan Stanley China (CAF)  -3.60%

:::  IPO’s Worth Watching for This Week :::

Just one IPO  worth watching this week and  it’s another China IPO – Noah Education Holdings (NED)

1. Noah Education Holdings (NED): a leading provider of interactive education content in China.  Develops and markets interactive, multimedia learning materials mainly to complement prescribed textbooks used in China’s primary and secondary school curriculum, covering subjects such as English, Chinese, mathematics, physics, chemistry, biology, geography, political science and history. They deliver content primarily through hand held digital learning devices, or DLDs, into which the content is embedded or subsequently downloaded at over 8,500 points of sale, approximately 2,000 download centers, or through the website, www.noahedu.com. In addition, they sell electronic dictionaries, or E-dictionaries. In July 2007, the company began offering after-school tutoring programs as they build upon experience and brand to capture more market opportunities in the supplemental education market..  Trading set to begin on Friday.

::: Upcoming Economic Reports (10/15/07 – 10/19/07) :::

Monday:         None
Tuesday:       Industrial Production, Capacity Utilization
Wednesday: CPI, Housing Starts, Building Permits, Crude Inventories, Fed Beige Book
Thursday:      Leading Indicators, Initial Claims
Friday:            None

::: Upcoming Notable Earnings Reports :::

Earnings Season Kicks Off In Full Force This Week!

Monday:  New Oriental Education (EDU), Nuveen Investments (JNC), Citigroup (C), Genentech (DNA)

Tuesday: Intel (INTC), Wells Fargo (WFC), Yahoo (YHOO)

Wednesday: Noble (NE), NVE Corp (NVEC), Ebay (EBAY), BlackRock (BLK), Altria (MO), Cavium Neworks (CAVM)
                        JP Morgan (JPM), Washington Mutual (WM)

Thursday:  Google (GOOG), Ametek (AME), Intuitive Surgical (ISRG), Sunpower (SPWR), Gilead Sciences (GILD)
                    Bank of America (BAC), Capital One Financial (COF),

Friday: Caterpillar (CAT), Schlumberger (SLB), 3M (MMM),

::: In Case You Missed It – SelfInvestors Blog Entries of the Past Week :::

1 .An Excuse to Sell; Smorgasbord Of Leading Stocks

2. More Price, Volume Divergence; Stock of Day: Innerworkings (INWK)

3. Napoleon Hill of Think and Grow Rich Discusses Carnegie, Power of Mind

4. Top Rated IPO Qiao Xing Mobile (QXM) Cup With Handle Breakout; Globecomm (GCOM) Breaks to Record Highs

5.  Case Study: Trading Cardica (CRDC) For a 45% Profit

An Excuse to Sell; Smorgasbord Of Leading Stocks

Today’s action shouldn’t have been too much of a surprise given the run we’ve had off that big capitulation day back in August.  With volume levels waning and the Nasdaq approaching key resistance of its upward trend line, the move was simply unsustainable.  When you consider that the Nasdaq is up over 18% in two months, a pull back of 5 to 10% wouldn’t be out of the ordinary. Eventually, the market looks for an excuse to sell and today it got it in the form of hawkish comments from European Central Banker Alex Weber.  Yes it is truly a global economy with world markets intertwined.   If the US Fed won’t get tough on inflation, leave it up to our neighbors to be the buzz kill.

Said Weber:

“If risks to price stability are threatening to materialize, monetary policy can’t lose sight of its primary mandate — even if that means no longer supporting the robust economy or becoming restrictive,” Weber, who also heads Germany’s Bundesbank, said in the text of a speech in Munich today. There may be an “additional need” to raise interest rates, given the “expected acceleration in euro-region inflation over the coming months.”

Today’s action was certainly a change of character for this market as sell volume picked up substantially but I don’t think this is the beginning of the end.  Key support levels at those July highs remain intact so we’ll just have to see how we hold up there.  It isn’t time to abandon ship and head for the exits, although taking profits in those China high fliers and some of the IPO’s would have been a good idea this week.  I think tomorrow’s action will be fairly important.  Will retail sales and PPI data on the agenda for tomorrow, will it send the the market into another tailspin and confirm the selling of today?  It’s anyone’s guess but as I’ve been saying for several days now it’s best to remain cautious up here.

Tonight I have just one chart for you which illustrates how far the Nasdaq has come within a longer term upward trend.. and how far it could drop and still be considered in a bull market.

::: Major Indices Performance – The Numbers :::

(Note: volume averages are based on the average over the past 50 days)
Data as of 4:00EST – End of Day October 11th 2007

Nasdaq: DOWN 1.4% today with volume 28% ABOVE  average
Nasdaq ETF (QQQQ) DOWN 1.59%, volume 83% ABOVE average
Dow: DOWN .45%, with volume 17% ABOVE the average
Dow ETF (DIA): DOWN .37%, volume 32% ABOVE the average
S&P ETF (SPY): DOWN .48%, volume 16% ABOVE the average
Russell Small Cap ETF (IWM): DOWN 1.13%, volume 12% BELOW the average

::: SelflInvestors Leading Stocks :::

The Self Investors Leading Stocks Index is comprised of stocks in the Breakout Tracker, which is a database of the fastest growing companies near a breakout or having already broken out of a base.  Leading stocks led the way today but as with the general market, there was no volume conviction behind the move.

Summary:

* Decliners led Advancers 257 to 94
* Advancers were up an average of 2.02% today, with volume 103% ABOVE average
* Decliners were down an average of 1.05% with volume 31% ABOVE average
* The total SI Leading Stocks Index was DOWN 1.32% today with volume 51% ABOVE average

::: Where’s the Money Flowing :::

Many investing websites provide leading industries based on price performance alone. However, without accompanying volume levels, this can sometimes be misleading.  The only way that I know of to gauge industry/sector strength WITH volume levels is through the analysis of ETF’s.  A couple years ago this was not possible, but as more traders/investors use ETF’s they become a much better tool for gauging the health of the market and seeing where the money is flowing (or not flowing).  Using the proprietary SelfInvestors Demand Indicator score which measures price and volume movements, I’m able to quickly see which sectors/industries are seeing the greatest inflows of cash.  For a detailed look at how I go about gauging sector/industry strength please see the following post: http://selfinvestors.com/si/industry_tracking/

* Current Leading Sectors/Industries (over last 30 trading days):  
Gold, Broker/Dealers, Internet Infrastructure, Gold Miners, Agriculture, Software
                                          
* Current Lagging Sectors/Industries (over last 30 trading days): 
Homebuilders

* Today’s Market Moving Industries/Sectors (UP):
Gold, Retail, Oil Services

* Today’s Market Moving Industries/Sectors (DOWN):
Internet, Semis, Water Resources, Clean Energy, Ishares Software

::: Stocks :::

The stocks section will be an area where I highlight one stock selected from a group of stocks moving up with volume well above average and most likely breaking out of a base or consolidation.  Today’s stock is ..  a choose your own adventure. 

Here’s a list of SelfInvestors Leading Stocks that moved with volume today and are above both the 50 and 200 day moving averages (in order of fundamental rank)::

JA Solar (JASO)
Sterlite Industries (SLT)
Zumiez (ZUMZ)
Yingli Green Energy Holdings (YGE)
GigaMedia (GIGM)
Qiao Xing Mobile (QXM)
Global Sources (GSOL)
T-3 Energy Services (TTES)
Telefonica S.A. (TEF)
China Petroleum (SNP)
TomoTherapy (TTPY)

Interested in tracking leading stocks throughout the day.. how about IPO’s and ETF’s?  It’s all here.

More Price, Volume Divergence; Stock of Day: Innerworkings (INWK)

Today, as it has been for much of the past few weeks, the market seemed to go up not because of any great news, but a lack of any major bad news that could jolt the market into believing that the credit/subprime concerns ARE NOT just an aberration.  For much of the day, we meandered sideways but after the Fed released its minutes a surge of buying hit sending the indices to a sizable gain.  It seems these days that the market will never go down and with uninspiring volume behind these moves it’s enough of a reason to play mr. contrarian and avoid getting overly aggressive up here.  There continues to be outstanding short term trading opportunities, particularly in the China plays but to be initiating positions for the long haul here is probably a mistake.  The retail numbers come out Friday and we ramp up earnings next week.  With the Nasdaq nearing some resistance at the upper level of a wide channel, the market may be soon be looking for excuses to take profits.  Now may be a good time to find excuses to take profits of your own. 

::: Major Indices Performance – The Numbers :::

(Note: volume averages are based on the average over the past 50 days)
Data as of 4:00EST – End of Day October 9th 2007

Nasdaq: UP .59% today with volume 2% BELOW  average
Nasdaq ETF (QQQQ) UP .43%, volume 31% BELOW average
Dow: UP .87%, with volume 19% BELOW the average
Dow ETF (DIA): UP .93%, volume 47% BELOW the average
S&P ETF (SPY): UP .94%, volume 55% BELOW the average
Russell Small Cap ETF (IWM): UP .81%, volume 48% BELOW the average

::: SelflInvestors Leading Stocks :::

The Self Investors Leading Stocks Index is comprised of stocks in the Breakout Tracker, which is a database of the fastest growing companies near a breakout or having already broken out of a base.  Leading stocks led the way today but as with the general market, there was no volume conviction behind the move.

Summary:

* Advancers led Decliners 242 to 105
* Advancers were up an average of 2.17% today, with volume 2% BELOW average
* Decliners were down an average of 1.05% with volume 14% BELOW average
* The total SI Leading Stocks Index was UP 1.22% today with volume 5% BELOW average

::: Where’s the Money Flowing :::

Many investing websites provide leading industries based on price performance alone. However, without accompanying volume levels, this can sometimes be misleading.  The only way that I know of to gauge industry/sector strength WITH volume levels is through the analysis of ETF’s.  A couple years ago this was not possible, but as more traders/investors use ETF’s they become a much better tool for gauging the health of the market and seeing where the money is flowing (or not flowing).  Using the proprietary SelfInvestors Demand Indicator score which measures price and volume movements, I’m able to quickly see which sectors/industries are seeing the greatest inflows of cash.  For a detailed look at how I go about gauging sector/industry strength please see the following post: http://selfinvestors.com/si/industry_tracking/

* Current Leading Sectors/Industries (over last 30 trading days):  
Gold, Broker/Dealers, Internet Infrastructure, Gold Miners, Agriculture, Software
                                          
* Current Lagging Sectors/Industries (over last 30 trading days): 
Homebuilders

* Today’s Market Moving Industries/Sectors (UP):
Nanotech, Nuclear Energy, Energy, Real Estate, Oil & Gas Services, Internet Infrastructure

* Today’s Market Moving Industries/Sectors (DOWN):
None

::: Stocks :::

The stocks section will be an area where I highlight one stock selected from a group of stocks moving up with volume well above average and most likely breaking out of a base or consolidation.  Today’s stock is Innerworkings (INWK), another highly rated IPO that debuted in the 4th quarter last year and broke out of a long base to a new all time high today.

ABOUT: 

InnerWorkings, Inc. is a provider of print procurement solutions to corporate clients in the United States. The Company creates bid process to procure, purchase and deliver printed products as part of an outsourced enterprise solution and in individual transactions. Its applications and database, PPM4, creates an integrated solution that stores, analyzes and tracks the production capabilities of its supplier network, as well as quote and price data for each bid the Company receives and print job it executes. Through its network of over 5,000 suppliers, the Company offers a range of print, fulfillment and logistics services. It procures printed products for clients across a range of industries, such as advertising, consumer products, publishing and retail. In October 2006, the Company acquired Applied Graphics, Inc., a provider of print management and print-on-demand services. In March 2007, it acquired Spectrum Printing Systems. In July 2007, the Company acquired Brown+Partners, Inc.

FUNDAMENTALS: 

Innerworkings (INWK) is in the publishing business so it doesn’t receive some of the hype that the hot China or solar IPO’s receive, but it is one of the highest rated IPO’s that I track with a fundamental score of 27/30.  The small company has been profitable since 2003 and has been roughly doubling profits ever since.  Growth is expected to moderate a bit, but the company is still expected to post earnings growth of more than 50% this year and next.  If the company has a negative, it’s the low margin printing business that it works in with net margins around 5%.  Return on Equity is an excellent 24% so management is strong and they own a good portion of their company with 25% ownership.  Both key characteristics of a big winner. 

TECHNICAL:  

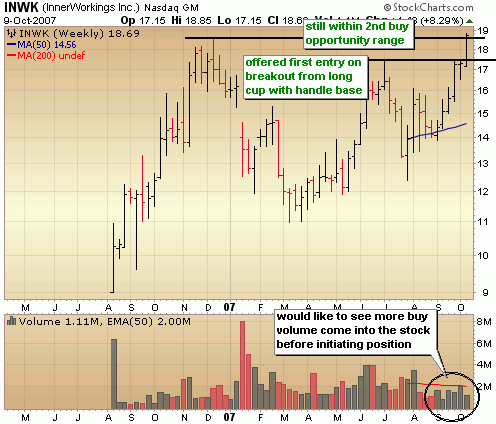
Below is a look at the weekly chart and shows a long cup with handle base (handle a bit steep) with a subsequent breakout around 17.50 from the large handle.  This offered the first chance at an entry in the stock.  It wasn’t long before the stock tackled all time highs around 19 which it cleared today with above average volume and remains in a buyable entry for a 2nd entry point.  You should be paying particular attention to top IPO’s breaking out of bases with volume and INWK is no exception.  The only thing I’d like to see is more volume come into the stock.  It’s been a little weak during the rise over the past couple weeks.  Considering the overall market is overbought and looking tired, the best course of action is to probably wait it out on INWK and get on a pullback to the first entry around 17.50 if it does so with light selling volume. 

SELFINVESTORS RATING: With a total score of 51/60 (27/30 for fundamentals, 24/30 for technical), Innerworkings (INWK) is a very good SelfInvestors breakout candidate.

Full Disclosure/Disclaimer: The stock of the day is by no means a buy recommendation.  Please do your own research and make a personal decision based on your own tolerance for risk.  I currently do not own a position in INWK.