Category Archives: Stocks

A Short Opportunity in Jack in the Box (JBX)?

The following is exclusive analysis from The Correct Call, provided to my readers here at SelfInvestors.com beginning today and provided on a weekly basis.  Hope you enjoy these weekly trade ideas.. your feedback is appreciated.

::::::::

With the Stock Market sinking on higher Oil prices, The Correct Call’s models are dangerously close to moving into sell territory. With that in mind, in our weekly review of ETF charts, we were on the lookout for short selling opportunities.

One such chart, PowerShares Food and Beverages (PBJ) looks like it’s starting to run a fever.

As you can see in the chart, PBJ’s price has moved below the 50 day moving average and the Short Term MACD has crossed below the longer term line- usually not good.

The Correct Call screened the holdings of PBJ in search of companies we can short with deteriorating fundamentals and a poor technical picture. One popped out to us.

Jack in the Box’s (JBX) short-term prospects favor the stock price moving lower.

    – In the company’s latest earnings call, management anticipates a 2% decrease in same store sales for the rest of this quarter JBX’s restaurants in California, Las Vegas and Phoenix have been impacted by the souring economy in those hard hit states.

    – Higher food and commodity costs are reducing JBX’s profit margins at a time when Jack might be forced to lower its prices to keep up with the very aggressive value menu pricing campaigns of their fast food peers.

    – Management recently offered inline earnings guidance for the remainder of 2008, but admitted much of their outlook is backend loaded. Any miscue in execution could lead to an earnings disappointment and a much lower stock price.

Analysis of JBX’s chart reveals a negative MACD crossover and double bottom around $23.25. If Jack’s price were to violate and close below that support line, the next stop should be in the $19-20 range.

Investors worried about potential big losses from shorting a stock, should consider buying put options. With put options, your risk is limited to the dollars invested. For JBX, aggressive investors should consider the September 25 Put Options. If we have made The Correct Call and Jack in the Box trades at $20 per share by August 1st, the September 25 Puts value would be worth around $5. A 67% increase from yesterday’s close of $3 per contract.

Trade of the Day: Another Breakout in Digital Alley (DGLY)

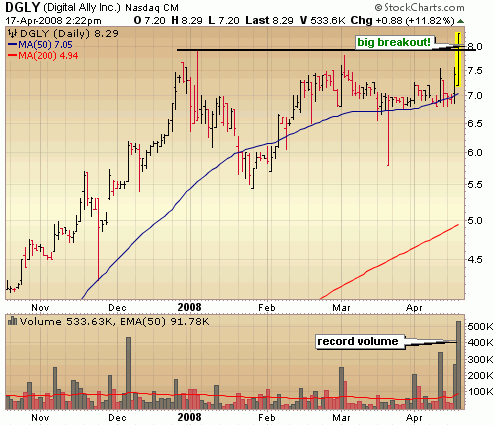
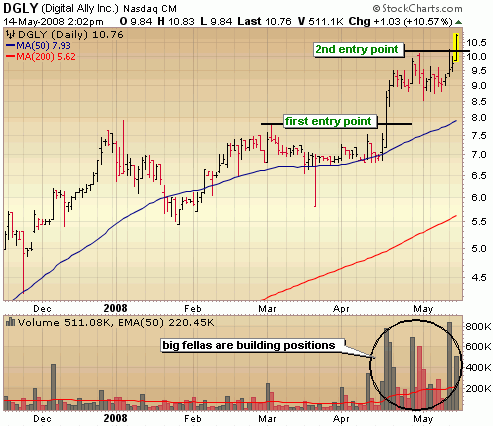
I first highlighted DGLY back on April 11th in a Top Breakouts post, then again on April 17th as it broke out of a base with big volume.  Today it continues to surge higher, producing yet another breakout from a short consolidation.  The stock actually broke out of a triangle formation just two days ago, but reversed sharply and closed in the lower half of the range.  It wasn’t enough to stop the momentum as institutions continue to build positions in this emerging company.  Today, it cleared an all time high and volume looks like it’s going to come in at nearly 4x the average.  It’s a bit extended at this time, so considerably more risky then when I first profiled it but it still has tremendous momemtum behind it. 

digital alley dgly breakout

Disclaimer: I absolutely own DGLY.

Buying International Stocks

The following is a good article from DailyWealth about buying international stocks.  I personally just stick to ADR’s and ETF’s but if you’re interested in buying international stocks directly "like a local" this article might be helpful to you.

By Tom Dyson
I just had a long chat with Howard Goldstein and Dave Sjuggerud. Dave is Steve’s dad. He and his business partner, Howard, are international stockbrokers. They’ve dealt international stocks for more than 17 years.
I called them up because a reader e-mailed me yesterday… He wanted to buy a stock I recommended last month in my income advisory, The 12% Letter. The stock has a large market capitalization, and there’s plenty of liquidity… but it trades in Canada.

The reader told me E*Trade refused to buy shares for him because "the stock is only open to Canadian residents."

I called Dave and Howard because I wanted to find out the cheapest way to buy international stocks like this one. Today, there are more opportunities to make money outside the U.S. than inside. So to be successful, an investor must know how to buy international stocks.

The stock my reader wants to buy, for example, pays a 12% dividend, and its business situation makes for a compelling investment opportunity. I want all my readers to buy this stock.

Here’s what I learned:

First of all, E*Trade misinformed my reader. Some Canadian stocks are unavailable to U.S. investors. Limited partnerships are one example. But this stock is not one of those. U.S. investors may buy this stock.

So the problem arose because discount brokers, like E*Trade, are lazy. They don’t want to buy international stocks. It’s hard work for them. And the commissions are lower. I’ve had this problem with Fidelity before, too. Fidelity wouldn’t purchase a Toronto stock for me last year.

Because they are lazy, the discount brokers either tell you the stock is unavailable or they force you to buy the pink sheet listing of the stock instead.

The pink sheets make up a sort of mirror market. It’s like the difference between Sotheby’s and eBay. It’s not an exchange. It’s more like a bulletin board where brokers offer securities for sale. Stockbrokers call this market "over-the-counter."

If you search for international stocks in Yahoo, it’ll often bring up a pink sheet listing. You can spot them by their symbols, which have five letters and often end in the letter "Y" like SGAPY for SingTel or BAIRY for British Airways. They also have the suffix .PK or .OB.

Pink sheet dealers give bad deals. Take the stock my reader asked about. Howard could buy and sell this stock with a 2-cent bid-ask spread in Toronto. (A bid-ask spread is the difference between the price a seller will accept and the price a buyer will pay. The narrower the bid-ask spread, the closer you’re paying to a fair market price.) We called up a quote from the pink sheet market. They quoted us a 40-cent bid-ask spread.

If you must use the pink sheets to buy a stock, look up your stock’s price in the local market, convert it to dollars, and then place a limit order a couple of pennies above that price in the pink sheet market.

But I just don’t think you should buy pink sheet stocks. And in the future, when I recommend an international stock in one of my reports, I’m going to advise you not to buy the pink sheet, even if your broker won’t get the stock on the true international exchange.

Instead, I recommend you use one of three international stockbrokers our readers have worked with before. I don’t receive any compensation for mentioning these guys, nor does Stansberry Research (DailyWealth‘s publisher). I recommend them because I know them and I trust them. They have excellent reputations in the industry. And they’ll give you fantastic service, too… You can’t buy international stocks cheaper anywhere else.

Take an Australian stock for example. The Australian market trades during the night. When the U.S. market is open, the Australian market is closed. But a pink sheet dealer will give you a quote on an Australian stock during normal U.S. market hours. How can he do this? He’ll make you pay a wide spread to cover his risk. His risk is that the Australian stock moves sharply when the market opens the next day.

But when you use Howard and Dave, they’ll keep your order open until the international market opens, and buy the stock direct… even if it means they have to wait until midnight to fill your order.

"Tell your readers to call us after they’ve called all their other brokers," said Howard. "Why? Because I know we’ll give them the best deal."

Howard says he pays spreads on shares in Australia, Hong Kong, and China that are so small, you can’t even calculate them.

It’s easy to do business with these guys, too. They can have your account open in about 24 hours… and loaded with your favorite international shares… at the same prices the local brokers in those foreign countries pay.

Related Articles

The One List You Need to Profit from "Chimerica"

These Canadian Income Trusts Will Keep Paying Huge Dividends

You can call Howard at 1-877-539-1004 or e-mail Hgoldstein@lasallest.com. Our readers have also done well with Rick Rule, who specializes in commodity stocks (1-800-477-7853, www.gril.net) and Jeff Winn (1-800-432-4402, Jwinn@iaac.com).

The discount brokers have their place… but for the cheapest trades on international stocks, you should work with brokers who know what they’re doing and can provide you with the best prices. Investors who know how to buy international stocks have many more opportunities open to them. Make sure you’re not missing out.

Good investing,

Tom

Barry Hot on the Heels of the Plunge Protection Plunge Team

2dimesphoto

2DIME’S INVESTOR NOTES By: Barry Brush
Technical Analysis of Price & Volume Action Can Give a Trader a Heads Up In the Plunge Protection Game

An article in this morning’s paper gave me cause to reflect upon my last comment on disintermediation and the current state of our nation’s financial markets. The hyperinflationary credit release program which the Federal Reserve began last December has provided a total of $360 billion in short-term loans to credit squeezed banks. 10 times since December 2007 the Fed has opened its discount window to auction off notes at extremely low rates. In the latest auction commercial banks paid an interest rate of 2.87% for their loans. You and I should be so lucky as to find the same rate in our lifetime.

In yesterday’s auction of $50 billion in 28-day loans, there were bidders for $88.3 billion indicating to me that even at lofty levels, there is a significantly higher demand for credit than there are dollars available. One reason for this lack of dollars or bank deposits is a result of the disintermediation I spoke of in my last post on SelfInvestors.com . Have you ever wondered what this below market money is being used for? It certainly isn’t growing moss. What happens if you don’t repay them? I know. You just write them off. No muss no fuss. Poof!

Last Monday April 21st, I Just happened to be watching the 10min chart of "T". Indications were really pointing to a crash of a day given that most markets had moved up to but not through strong overhead resistance on Friday. What I observed was both unsettling and reassuring.

About 10:00 AM, there appeared to be unusual or strange non-human trading patterns occurring which I initially assumed was a corporate buy back in progress or possibly insider trading in anticipation of better than expected earnings. I later became convinced that it was intervention by the shadowy, deep cover grey-ops contractor known as the PPT, (Plunge Protection Team) or WGFM “Working Group on Financial Markets”.* (See Note Below)

I watched “T” sell off repeatedly to $37 exactly and then be miraculously bought back up to $37.90 exactly. I continued to check my monitor throughout the day. Similar price action continued all day at approximately 6 min. intervals; with a 40 min lunch break from 11:50 to 12:30 (So much for the In-human part because computers don’t take lunch breaks) I really haven’t noticed these trading patterns before. Very interesting. After the close, I examined all of the other Dow 30 stocks. With the exception of MSFT and INTC, there were distinct trading pattern similarities to those of “T”. That day the Dow opened around 12850 and headed south quickly. It closed at 12820 up as “planned”. I knew then that I had witnessed a methodical, massive and documented interventionist attack on 28 of the 30 Dow Components in order to prevent a potential sell off and to perpetuate a rally already struggling to take flight. My conclusion Annie, is that “Daddy War-Bucks” is alive, well and a reality.

Attached is a screen shot of “T” for confirmation. All of the other Dow component charts have duplicate price actions. I would appreciate any feed back you might have on my observations or any similar ones of your own. I suppose that if the “lender of last resort” is doing this, it is quasi-legal; and we can now elevate the national opinion of Martha Stewart to a BUY.

This is really good stuff, because it tells me that the Government AKA “The FED” or “us” is serious about protecting today’s Market and economy. However, it goes without saying that, the cost to future American generations will be enormous. In terms of the resulting inflation and the fact that eventually such rigging will destroy the integrity of the markets as free institutions of trading. But that is for someone in the future to worry about. Not us. Our job is to recognize it and to trade on it.

The majority does not want to nor can it see the paradigm shift in the US economy. Over the past 20 years, it has clearly migrated from “laissez-faire” to state control. The switch was thrown 2 decades ago. Darn! I never saw it happen. For you, I and our children, there will be a difference because we see what is going on. State control is not a bad thing for us. We are traders and we are aware of it. So continue to be-aware.

Our strength is in being able to quickly shift our capital to invest in strong companies in strong sectors as the winds of change blow. Rely on price and volume action and technical indicators. They will reveal the “monkey business” going on. A free Market has always had the ability to look ahead 6 months or so and forecast the future strength or weakness of the economy. A concern of mine is that interventions such as the one I witnessed Monday will denigrate the Market’s ability to make that projection. Never underestimate the power of the US Government.

That said, stocks remain one of the best hedges against inflation: but don’t be satisfied with mediocre mutual fund returns. Get involved in the market and stay involved. Make sure your subscription to SelfInvestors.com is kept up to date. Use it!

FYI, I was at a breakfast meeting yesterday with various business leaders in Charlotte, NC. Bob Tourtellot, the owner of an industrial rag company, Wiping Cloths, Inc., said his sales were up 20% over last year. He said rag sales were a reliable leading indicator of the general economy. Go Figure!

Cheers, 2dimes Barry Brush

Note* My thanks to Robert D. McHugh, for thoughts and excerpts from his TechnicalIndicatorIndex Newsletter and Nelson Hultberg’s comments and research below. Nelson Hultberg is a freelance writer in Dallas, Tx. and the Executive Director of Americans for a Free Republic.

Executive Order 12631–Working Group on Financial Markets
The provisions of Executive Order 12631 of Mar. 18, 1988, appear at 53 FR 9421, 3 CFR, 1988 Comp., p. 559, unless otherwise noted.

This order states that the major appointees of this group are to be the Secretary of the Treasury, the Federal Reserve Chairman, the SEC Chairman, and the CFTC Chairman and those they designate to fulfill their purposes. The purposes, as defined in the Executive Order, are to "[enhance] the integrity, efficiency, orderliness, and competitiveness of our Nation’s financial markets and [maintain] investor confidence." The order goes on to say, "To the extent permitted by law and subject to the availability of funds therefore, the Department of the Treasury shall provide the Working Group with such administrative and support services as may be necessary for the performance of its functions."

“The PPT or “Working Group” was authorized by Congress after the crash of 1987. (October 19, 1987 "Black Monday") Its job: to buy markets should declines get out of control. It has become more interventionist than was originally intended under the law. There are no minutes of meetings, no recorded phone conversations, no re­ports of activities, no announcements of intentions. It is a secret group including the Chairman of the Federal Reserve, the Secretary of the Treasury, the Head of the SEC, and their surrogates which include some of the large Wall Street firms. The original objective was to prevent disastrous market crashes. Lately, it seems, they buy markets when they decide markets need to be bought, including equity mar­kets. Their main resource is the money the Fed “prints”. The money is injected into markets via auctions at the New York Fed’s Repo desk. Once upon a time this would show up in the M-3 numbers, warning intervention was nigh. But, in November 2005, the Fed announced with little comment and no palatable explanation that it would no longer report the M-3 number after March 2006. Without the useful resource of M-3, we need to find other tools to monitor when the PPT is likely to intervene, to instigate or prolong a rally.

For the PPT to be effective in driving markets higher, the potential for a sustained turnaround rally depends upon a high volume of open short interest. By measuring this short interest by the level of CBOE put options, we can gauge when markets are ripe for PPT intervention. The way it works is, the PPT decides markets need intervention, a decline needs to be stopped, or the risks associated with politi­cal events that could be perceived by markets as highly negative and cause a decline, need to be pre­vented by a rally already in flight.

To get that rally, the PPT’s key component is money “given” to surrogates who will take that fresh electronically printed cash and buy markets through some large unknown buyer’s account. That buying comes out of the blue at a time when short interest is high. The unexpected rally strikes blood, and fear overcomes those who were betting the market would drop. These shorts need to cover, need to buy the very stocks they had agreed to sell (without owning them) at today’s prices in anticipation they could buy them in the future at much lower prices and pocket the difference. Seeing those stocks rally above their committed selling price, the shorts are forced to buy — and buy they do. Thus, those most pessimistic about the equity market end up buying equities like mad, fueling the rally that the PPT started. Bingo, a huge turnaround rally is well underway, or a rally al­ready underway is extended, and money from the sidelines; from Hedge Funds, Mutual funds and individuals rushes to join in the buying madness for several days and weeks as the rally gathers a life of its own.”

P.S.:

My belief and observation is that we have just witnessed such a rally; so take advantage and be-aware.
Top Breakout Stocks With Greatest Demand: Watch Digital Ally (DGLY)

A few weeks ago I put up a list of the Top 15 IPO’s showing the greatest demand over the past 30 trading days and several of the stocks in that list have tacked on big gains since I posted it.  Stocks like Gushan Environmental (GU) up around 60%, LDK Solar (LDK) up over 30%,  VisionChina (VISN) up about 30%, Vanceinfo Tech (VIT) up 30%, First Solar (FSLR) up 30%, Trina Solar (TSL) up 25% and ReneSola (SOL) up around 20%.

To give you head start on research for the weekend, I thought I’d post the Top 10 Breakout Stocks showing the greatest demand over the past 20 days.  It should be noted that several of these are well extended from a proper buy point and should be avoided for now.  As for the rest, they are not buy recommendations but simply ideas for further research.  Now get on with that further research!

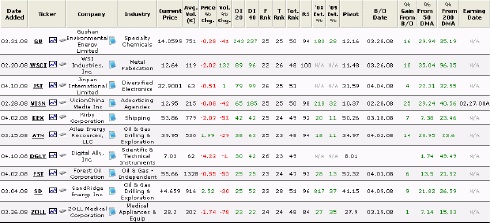
The following is a screenshot of the SelfInvestors Breakout Tracker database.  A database of only the highest quality companies leading the market.  The table is sorted by DI 20 so that those stocks showing the greatest demand over the past 20 days are listed at the top.  The DI (or demand indicator) is a proprietary indicator that I use to track price and volume movement in a stock.

Please click on the image below to launch a larger image that you can actually see.

41108_topDIthumb

Notice that a few IPO’s that I highlighted in the last report appear here as well.  That’s because IPO’s are included in the Breakout Tracker too once they have formed their first base.

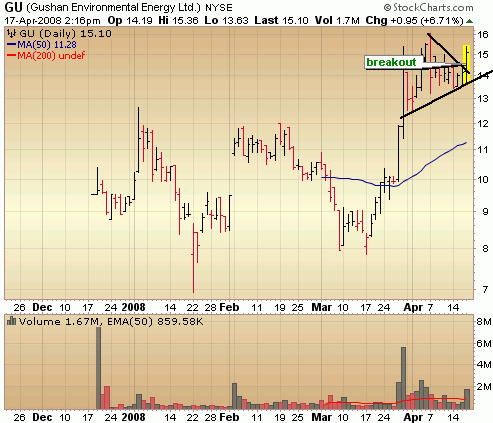
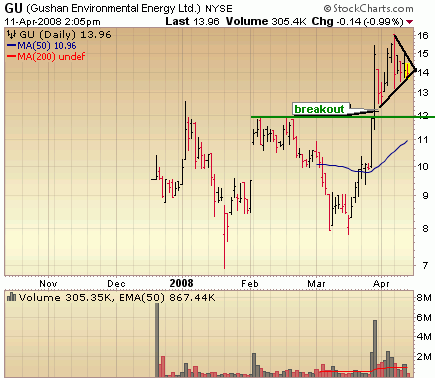
Let’s take a look at the charts starting right from the top with Gushan Environmental (GU).  The stock broke out above 12 with very heavy volume and offered an entry there.  It ran up another 30 from there before consolidating into a triangle formation which is where it sits now.  It’s still a bit overextended and I could see it breaking that triangle below and retesting the breakout point around 12 as many breakout stocks do.

41108_gu

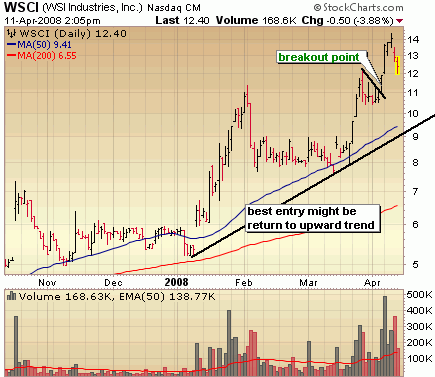
WSI Industries (WSCI) is an interesting one off the radar of many but it’s had a tremendous run in recent weeks.  This is another one that’s over extended but should be watched closely for a return to the upward trend line where it may offer a decent entry point.

41108_wsci

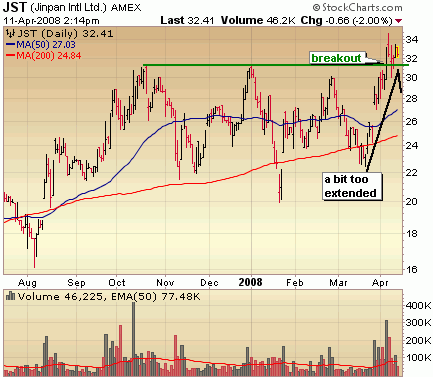
Jinpan International (JST) is one of my favorite breakout plays currently, but I’d like to see it come in a bit more after its recent breakout.  Buy vs sell volume is excellent and with the stock trading up around all time highs, there is lots of room to run if this market can get going again.

41108_jst

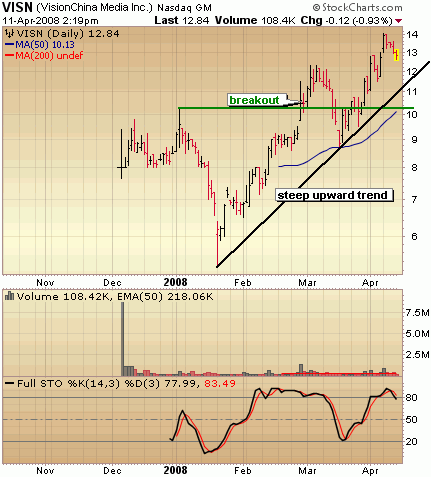
VisionChina (VISN) is another one I highlighted in that IPO report a few weeks back and it has done nothing but surge higher.  It’s well extended, but this is shaping up as a home run stock and should be watched closely for pull backs.  A return to that steep upward trend line might offer an initial spot to get in if you missed it. 

41108_visn

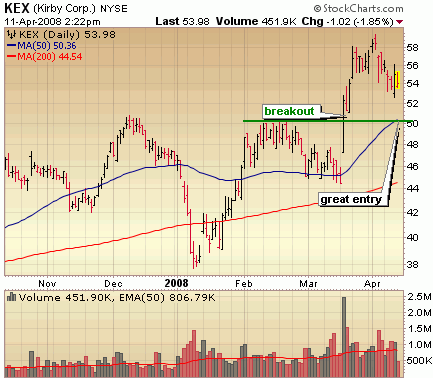
Put Kirby (KEX) on the radar as well.  It’s pulling back in a healthy manner after soaring to new all time highs with big volume.

41108_kex

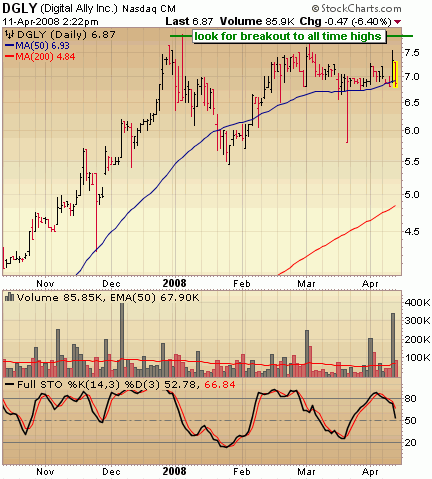
Digital Ally (DGLY) is one of the more obscure of the bunch and it didn’t hit my radar until it moved off the 50 day moving average yesterday with big volume.  The company posted its first profitable year in 2007 and has been showing huge growth in recent quarters.  Add to that great margins and ROE and you have the ingredients for a big winner.  It has yet to break out.  Set your alerts!

From MSN:

Digital Ally, Inc. produces digital video imaging and storage products for use in law enforcement and security applications. Its products include in-car digital video rear view mirror and a digital video flashlight. These products make self-contained video and audio recordings onto flash memory cards that are incorporated into the body of the digital video rear view mirror and the flashlight. It sells its products to law enforcement agencies and other security organizations and for consumer and commercial applications through direct sales and third-party distributors.

For more on Digital Ally, there is a good write up over at Seeking Alpha.

41108_dgly

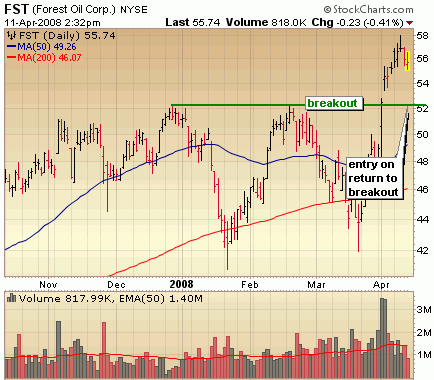
I think oil is overdone in the short term, so look for a healthy pull back in Forest Oil to the breakout point around 52 as possible entry point.

41108_fst

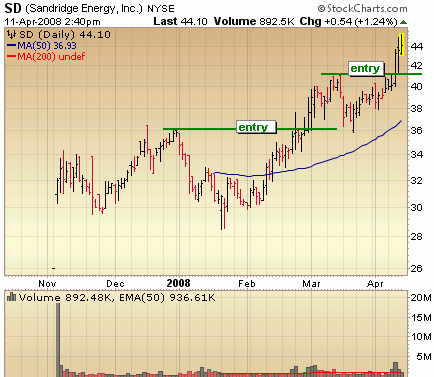
The IPO Tracker alerted me to a breakout in SandRidge Energy (SD) on Wednesday, allowing me to put on quick swing trade for a nice profit.  I still like it long term, but think it needs to digest gains a bit.  One of the better oil plays out there at least from a technical perspective.

41108_sd

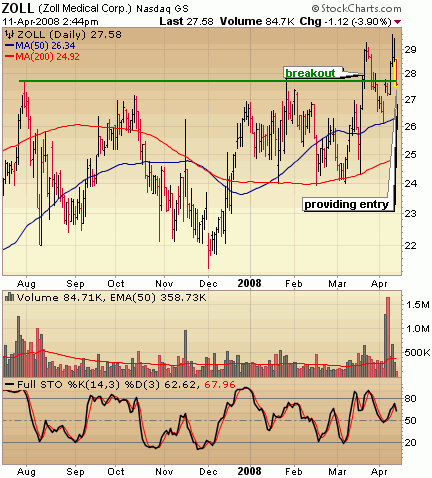
Last but not least is Zoll Medical (ZOLL).  Not quite as bullish as the rest with quite a bit of overhead resistance up to 36, but one of the safer plays.  It’s currently trading around its 52 week high and recently broke out from a base.

41108_zoll

This is one of many powerful screens that the Breakout Tracker offers.  Get it along with the IPO and ETF Tracker with the darn cheap Silver service today.

Barry on Trading Tools, Mindset, ETF Options and Perspective

SelfInvestors.com contributor Barry shares some more thoughts on tools of the trade, trading emotions, the Fed, ETF options and keeping it all in perspective.  For more about Barry, please see his first introductory post.  Thank again Barry, another great post!

Get Ready, Get Set, Trade…. Options on ETFs by Barry Brush

I have a confession to make. "Trading is as much psychological as it is skill." The skill consists of being able to control the emotions of fear and greed that try to hitch a ride on every trade. It is being able to manage your time while preparing and taking action during the trade itself. Your mental set up is vital; but so too is your physical location and Setup. Depending upon your trading style, you have to be ready to mind the store when the store needs minding. If you have a trade in play and have set mental stops rather than sell stop limits, you’ll need to be available intra-day or after the close to execute your strategy. It goes without saying that your risk in a trade must be managed to a minimum; but your hardware must be flawless as well. Here’s a snapshot of my setup, and the place where I try to manage my risk.
I don’t have 6 twenty two inch monitors and a water cooled server in a closet. I trade at home in the family room from a Tempur-Pedic chair in front of a 17 inch Dell XPS laptop with all of the processor and RAM I could get into it. It sits on a cooling pad in the middle of my roll top desk with 12 of my favorite trading books to the left and a raft of option trading DVDs and CDs to my right. I keep a portion of my brains handy on about 100 3×5 cards I’ve developed over time. I use hardwired broadband on an eithernet with Wi-Fi and an AT&T air card as a backup. Their 3G network runs all my charts and real time applications from the front seat of our car while traveling. I’ve driven NY to FL and rarely broke lock on a signal. At home, Time Warner’s Roadrunner is not 100%, even in the great city of Charlotte, NC. For a spare, I bought one of those light weight Sony Laptop VGN some things on EBay for $600 and replaced the broken LCD myself for a few more dollars. If its time to exit, its time; and I don’t want to have to call my broker. It’s the principle of the thing.


I’m anal when it comes to backing up data on my computer; having learned the hard way after multiple disk failures over the years. Loosing a hard drive can be like a death in the family; so, my computer pumps its brains into both a 100 GB and 1.5 TB backup drives. Just to be safe, I subscribe to an online backup service at Carbonite.com for less than 80 bucks a year for the unlikely event of a fire or theft.

I like to make notes, FIB levels and Elliott wave ratios on the various charts I use, so the backups are important to me.  Even though I make notes on all my trades in the “At- A-Glance” daily planner that I use for my journal, I like to annotate strike price levels, entry points, stops and targets for the calls and puts I have in play on my charts. The artist in me also likes to draw out various technical price forecasting patterns on my charts. I may find a trade on a daily or 15 min chart but I like to pull the trigger on a one min chart to knock off the commission on an option trade. It’s amazing how often a Bull or Bear flag tells the truth or price breaks out of a triangle at exactly 1/3 from the tip. And the guy that’s in charge of Head & Shoulder patterns….. I sure hope they pay him more than the CEO of Bear Stearns; he’s earned it and then some.

 I also make reference on my charts to the applicable online account I’m trading with. By referencing my notes, as I cycle through my current daily watch list, I can quickly see what the market is telling me about each trade. I guess I could use some of those trade from your charts tools but I’m just not there yet. I also use a little program called RoboForm to simplify the whole online trading password thing; and love the capability of having them on a secure USB jump drive for traveling.

I check briefing.com each morning prior to the open for an awareness of what the market futures portend for the day. My cell phone starts ringing with text message alerts soon after the open because I’ve set up a ½ dozen or so 15 day moving average cross alerts so I always get a drift of the markets direction when its on a roll. Don’t pay for these. They are free everywhere. You just need to know your cell phones email address. During market hours when everything seems to be under control and on trend I’m always sharpening the saw by studying the advice of other traders through online newsletters or webinars. I try to take a break, say 11:30 to noon thirtyish to do some stretching or get a little exercise.

If you don’t have the luxury of trading full time yet and still attend a job, don’t worry, trading can still be your major monetary interest. Relaxing and making all of your decisions off of the close works perfectly well. In the evening, before or after American Idol, I make sure to read at a minimum the first two pages of the online Investor Business Daily; it’s Big Picture highlights and markets section.  I also like to skim through Robert McHugh’s daily market newsletter at technicalindicatorIndex.com.

That’s about all I need to feed my brain every day. I subscribe to and scan a lot of stuff to get good trading ideas. It’s not necessary; but I enjoy it. With sites like ours here at SelfInvestors.com you don’t really need to look very far. Tate does a terrific job of developing ideas. I like the challenge of taking some of his dogs and turning them into carriage horses with options trades. It seems that often just when he is bailing it’s a great time to get in with a put or a call. I actually bought a stock the other day. Well it was almost a stock err… ETF is what they call them, I think. What ever that stands for.

If you are convinced that the sky is falling, and that no one on Capitol Hill deserves to be there, check out EEV, FXP, TWM or QID. BUT… be careful here if you are an options trader. Follow your checklist and make sure the Bid Ask spread is manageable and the open interest is above 100 for the particular contract you trade.  Some of these are pretty new and thinly traded if at all. Don’t forget to buy enough time to hit your target. Being patient and waiting for the correct entry will reduce the time you need to buy, and thus your risk. Look for a retracement to Support or Resistance, Low volume pullback or break out on 150% of daily volume.

For fun, you might try analyzing an upside down cup and handle base. In my new book, I call it a “Pineapple Upside Down Cake”. That used to be my favorite when I was a kid; but you know, today, I still have a hard time getting my head around playing the downside even when my check list tells me I have a winner. So in a downtrend I raise my comfort level buying and selling Calls on UltraShort ETFs.

With rate cuts like automatic weapons fire, 200 billion dollars a week bailouts and no M1 in sight or in the public’s pockets; Boy! are we going to have some fun this summer! I wish some one would tell the boyz that if they don’t have any of our money left, its OK to go out of business. Don’t they realize that we have already taken ours out to pay for gasoline (energy) and food? Which by the way, under the “new rules” are excluded from CPI inflation calculations. Next thing you know, they’ll exclude the equity in our homes. OOPS! I think they already did that by prematurely raising rates to begin with.

Can you imagine the inflation indexed pay raises all government workers would get if food and gasoline were added back into the CPI. Who is in charge of that anyway, the same guy that runs Bear Stearns?

Wow! Have you checked out the new IPO resource Tate put up on the site?  In a word…AWESOME!

My wife and I and my 15-year-old daughter have an understanding about market hours; when I’m at my desk and the charts are flipping around like fish out of water, they keep the interruptions down to a low roar.  I actually think that working in the midst of family activities gives me a better perspective as to what my job is all about and why I’ve chosen the path I’m on.  Even though I consider every trade I play to be a living breathing entity, subject to every law of nature, when one is surfing the market, it’s nice to be reminded that meaningful life is all around you and that the kitchen is only a few steps away.

Cheers, 2Dimes / Barry Brush
To contact me send an email by using the Contact form (link above) and Tate will make sure I get it.  The best option is to submit your comment to the blog here 

Bear Stearns (BSC) Bailout & Crash – Chart Worth a Thousand Words

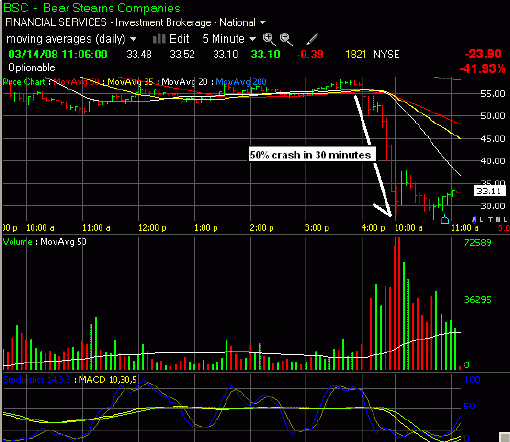
In my weekend report titled Where Are We in the Greed and Fear Cycle, I mentioned that this market would not mark a bottom until at least one major financial institution or homebuilder went under.  Well, this morning we came close in Bear Sterns.  Every attempt will be made by our government and better capitalized peers to help bail them out, but they can’t all be bailed out.  Some will have to fail and if this morning is any indication it will happen sooner rather than later. 

The chart of Bear Stearns (BSC) says it all.  Would you catch this falling knife?  Anyone short at the open?  What a trade that was!

chart courtesy of Telechart

Barry Ritholtz has an excellent ongoing update of this Bear Sterns bailout.

Note: I’ll be back posting more regularly next week.. been hard at work adding new features and products to SelfInvestors

I’ve Been Taking Google (GOOG) Profits

I have a confession to make.  I’ve been taking Google profits.  I first began highlighting Google to my premium members in 2006 and profiled it here in May of 2007 at 483.52 as the stock showed signs of an imminent breakout.  That was then, this is now.. and times have certainly changed.  For one thing, the market is on the verge of / in the beginning stages of a bear market (I’ll have more on this in a post tomorrow morning).  In this scenario, no stocks are immune to a sale, no matter how good the company. Google is no exception. 

On November 16th, 2007 I added to my long term Google position as the stock pulled back to the 50 day moving average, following a big fall run to nearly $750.  In an email to members, I said:

"I’m adding to my long term Google position here as it tests the 50 day moving average.  I still believe the market is going to get a decent run very soon and that a leading stock like Google will benefit greatly.  Also, remember that Nov, Dec and Jan are quite often great months for the stock market and techs in particular.  I  think that the greatest downside risk from here with Google is 600 and that only happens if we get another spike down to test the August lows of the major indices.  I’m confortable adding another $10K (less than 4% of portfolio) to my long term core position here at 623.26."

At the time of the trade off the 50 day moving average, I hadn’t really planned on trading it for a quick gain but given the uncertainty of the overall market and the quick bounce off support, I decided to lock in the trade for a quick profit.  On Nov 29th, 2007 I wrote to members:

"I added to my Google position after it was demolished and hitting the 50 day moving average just over a week ago, bringing my total portfolio position to a bit under 15% of the portfolio.  I believe the stock has come too far too fast and really needs to spend more time repairing the technical damage of early November.  I could see some kind of double bottom base forming with decent potential of retesting the low around 615 again.  I want to lock in this quick 12% profit on the 10K I took about a week ago and will consider adding to the position again once this base gets sorted out and I have a better idea of just how far the overall market will correct.  I’m out at 701.23."

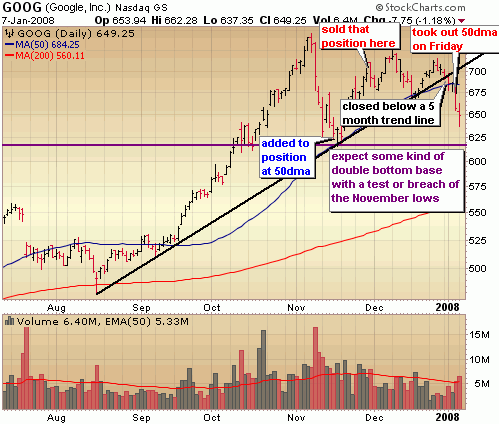
Roughly 3 weeks later on Dec 18th, Google would test the 50 day moving average once again, dipping well below this key support level intraday, but closing above support and keeping me in one of my long term positions (initiated in late 2006).  For awhile, it looked as if Google was going to break out of a bullish triangle formation (as you’ll see in the chart below).  However, on January 3rd, Google dipped below a 5 month upward trend line but managed to close just about on this line.  It wasn’t until the next day that the move was confirmed and the stock sold off fairly hard, taking out this trend line and support of the 50 day moving average with conviction.  It was on this day  I decided to lock in gains on a Google position I had been holding for 14 months.  I sent the following note to my premium members on Jan 4th 2007:

"I mentioned yesterday that core positions Mastercard and Google were not exempt from a potential sale.  Given the current market environment, nothing is immune to a sale.  Yesterday, Google bounced back and closed near the high of the day, so I gave it another chance to get back above the 50 day moving average today.  However, it’s taking out today’s lows, yesterday’s lows and support of a 5 month trend line.  So, I’m taking one of my $10K core positions off the table today at 673.25. and locking in a nearly 40% profit."

The action over the past few days indicates short term deterioration in Google, but longer term I still like Google very much.  Nothing has fundamentally changed for Google at this point and I would expect them to report another outstanding quarter in a couple weeks.  What I see happening is some sort of double bottom base formation with the first leg down low at 616.02, the middle "W" peak at 724.80 and the second leg down in the base at 616.02 or lower.  Typically a stock will take out the lows of that first leg down, to shake out a few more sellers, so a test of around 600 is highly likely.  This is an area where the 200 day moving average will approach in a few weeks as well so potentially a good spot to consider adding shares.  I’m still holding one core position with a 60% profit  that I got into in October of 2006.  I probably will NEVER unload this position.. but then again I should never say never!

Here’s a look at the 6 month chart of Google with highlights of where I added that last November position, then sold two positions. 

Disclaimer: I still own a position in Google and looking to add more, probably sometime after earnings.