Category Archives: ETF Movers

ETF Tracker: Greatest Demand – Financials Lead, Healthcare/Biotech, India Showing Life

Below is a portion of the Self Investors ETF Tracker (minus a few of the data columns so I could fit it into the page).  The most important data is the DI15 and DI30 columns which measure the amount of demand over the past 15 and 30 trading days.  I use the ETF Tracker to gauge where in the market the money is flowing and can easily see that with the Demand Indicator scores.

You can see that most of the institutional buying has flowed into the financials and to a lesser degree, healthcare/biotech.  Please note that points are awarded for both high volume moves up as well as light volume moves down (healthy selling), so an ETF may be moving down in price but could have a bullish demand score which could indicate a bottom.

For example, take a look at the iShares Global Energy ETF (IXC).  The fund is down about 30% in the last two months, but clearly the selling has been on light volume as indicated by its positive demand scores.  This might be an ETF I consider for a bounce back play in oil.  There is big support in this at around 40/share. 

Another interesting thing to point out is the quiet emergence of the India funds, particularly the Morgan Stanley India ETF (IIF).  Notice that over the last 15 trading days there has been either big buying, light selling or both.  Taking a look at the chart reveals some big buying going on over the past month.  This could be a long term bottom in India and I’ll be watching the India ETFs carefully for an entry.

Ticker Name DI
15
DI
30
% From
50 DMA
% From
200 DMA
UYG ProShares Ultra Financials 108 51 -1.43 -33.29
RKH HLDRS Regional Banks 85 57 8.05 -11.44
TKF Turkish Fund 43 31 3.08 -10.39
PJB PowerShares Dynamic Banking 40 38 7.09 1.07
IXJ Ishares Global Healthcare 35 36 5.06 1.12
XLF SPDR Financial 34 25 1.65 -15.3
URE ProShares Ultra Real Estate 33 8 -4.21 -14.01
BBH HLDRS Biotech 32 32 13.13 17.83
IIF Morgan Stanley India Fund 30 3 6.04 -18.22
PBE PowerShares Biotech/Genome 25 25 9.24 8.87
XHB SPDR Homebuilders 25 14 -0.46 -11.08
ICF Ishares Realty 24 19 0.26 -1.73
IXC IShares S&P Global Energy 20 17 -13.25 -9.09
IAI Ishares Broker Dealers 18 8 -4.01 -21.34
IHF Ishares Health Care Providers 18 20 4.65 -8.94
PXN PowerShares Lux Nanotech 15 11 0.57 -4.7
SMN ProShares Ultra Short Basic Materials 14 31 22.7 0.35
RWR streetTRACKS Wilshire REIT 14 6 0.11 -1.98
IFN India Fund 13 -4 3.93 -15.02
DUG ProShares Ultra Short Oil & Gas 12 26 26.76 6.61


Disclaimer: no positions in the ETF’s above
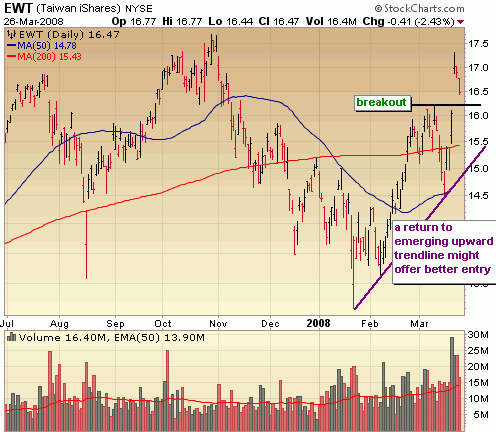
ETF’s Showing Greatest Demand: iShares Taiwan (EWT) Breaks Out

Tracking ETF’s is a great way to track the flow of big money and spot sector/industry rotation.  It’s said that half the move in a stock is directly related to the health of the industry it’s in, so sticking to stocks in industries where the money is flowing keeps you outperforming!  Of course, you could just trade the ETF for better diversification. 

The following table is a portion of the ETF Tracker, a Self Investors database which tracks only the most liquid ETF’s (currently about 200).  It’s sorted by DI 15 which is a Demand Indicator score over 15 trading days.  It measures the demand in an ETF by using price and volume data. 

Ticker

Name

Description Current
Price
Price
%
Change
Vol
%Chg
DI
15
DI
30
% From
50 DMA
% From
200 DMA
SMN ProShares Ultra Short Basic Materials Basic Materials Short 2x 38.16 -1.67 12 41 44 -9.49 -18.53
UYG ProShares Ultra Financials Financials Long 2x 31.59 -6.51 141 35 28 -6.92 -35.48
DUG ProShares Ultra Short Oil & Gas Oil & Gas Short 2x 38.55 -3.14 66 34 33 -7.33 -9.89
TAO Claymore China Real Estate China Real Estate 19.15 0.26 -79 26 27 -9.24 -9.24
IIH HLDRS Internet Infrastructure Internet Infrastructure 5.53 -1.25 -84 18 19 1.28 2.98
EFU ProShares Ultra Short MSCI Emerging Markets Short 2x 85.59 -0.09 -46 17 19 -3.66 5.99
ITB IShares Home Construction Home Construction 19.54 -6.73 143 17 17 6.72 -10.9
EWT Ishares Taiwan Taiwan 16.47 -2.43 21 14 20 11.74 6.67
MVV ProShares Ultra Midcap Midcaps Long 2x 64.53 -1.99 4 13 15 -1.63 -21.39
URE ProShares Ultra Real Estate Real Estate Long 2x 33.44 -6.2 28 12 17 7.46 -17.25
XHB SPDR Homebuilders Home Builders 21.55 -5.9 38 11 15 6.84 -5.94
IGM Ishares Technology Technology 51.84 -0.86 -74 11 15 1.55 -8.46
IGW Ishares Semis Semiconductors 51.07 -1.07 194 10 23 0.69 -16.02

Notice that only 2 ETF’s are above both moving averages, the Internet Holders Trust (IIH) and the iShares Taiwan (EWT).  IIH is a bit too illiquid for my taste (trades just under 40K shares a day) but Taiwan looks great and recently broke out on news of victory for the opposition party, the Kuomintang (KMT) which is expected to repair relations with China.  It’s overbought in the short term though and I’d be looking at an entry on a return to the trendline in purple
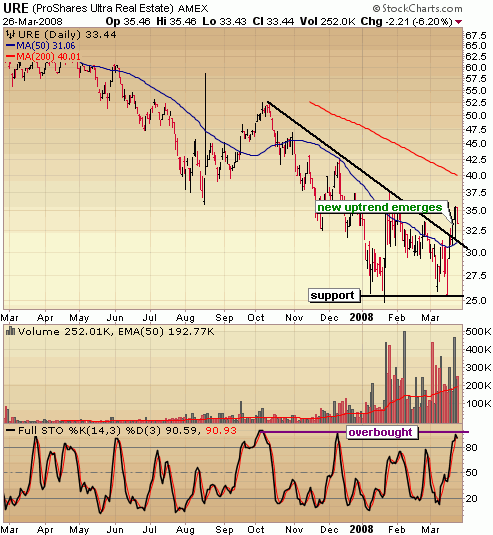
All the other ETF’s listed are coming off bottoms, but are also a bit overbought in the short term.  I’m really liking the leveraged ProShares Ultra Real Estate ETF (URE) and a pull back to around 30 would offer a decent entry for the long haul.  I just want to see stochastics get more neutral at least and preferably in oversold territory. 

The ETF Tracker is one of  3 great tracking systems that Self Investors provides.  Breakout Stocks and IPO Trackers are also available to Silver, Gold and Platinum members.  See all membership options here.  Your support of my independent research and tools with the purchase of premium memberships is greatly appreciated 🙂

Disclaimer:  I personally own a position in DUG.  None of the ETF’s mentioned above are recommendations to buy.  Please do your own research.

ETF Trends & Observations: Gold, Oil, Banks, India, China & More

About once a week I like to run through about 200 of the most liquid ETF’s to get a better sense of the market.  A good picture of the market can be painted by scanning through them so I thought I’d share my thoughts on what I’m seeing (in no particular order).   What are you seeing?

I post my thoughts on the general market in my weekly reports on Sunday, so won’t discuss it in detail again here but considering the futures are way off and tomorrow could get ugly I’ll just mention that just maybe tomorrow sets us up for that massive capitulation day that marks an intermediate bottom.  Pay attention to the VIX.  Remember: it’s not how we open but we we close.  If on Tuesday, we don’t at the very least close in the upper half of the trading range it could get real ugly.  There is quite a bit of room to run to the downside before any support comes into play.

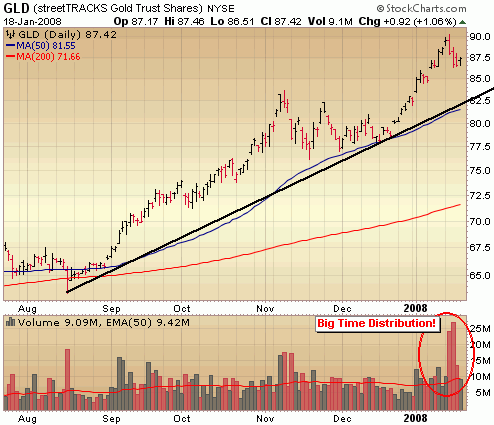
Gold is up 35% in 5 months and big distribution has come into the Streettracks Gold Trust (GLD) in the last few trading sessions.  Take some profits already! 

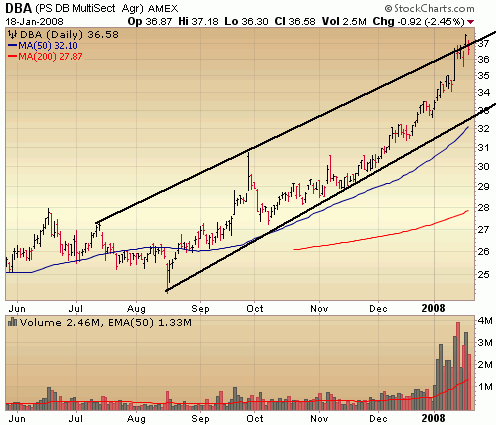
The agriculture stocks are not immune to the heavy selling and many of the top performers such as MOS, TNH, MON, CF, TRA and DE have been hit with big time institutional selling in recent days.  Is the Powershares Agriculture Fund (DBA) next to go?  It isn’t showing any signs of deterioration yet, but keep an eye on it for a short.  It’s extremely overbought and hitting the top of an upward channel.

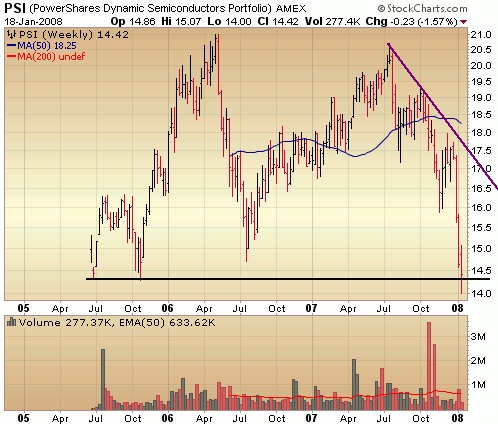
Semis are severely oversold.  I’m not saying that can’t stay oversold and dip further.  I’m just sayin.  It will take Intel several months to recover from that slaughtering.  Maybe semis become interesting later this year.  The Powershares Dynamic Semis (PSI) ETF is hitting some key resistance it might be ready for a snap back rally.  But that’s about it. 


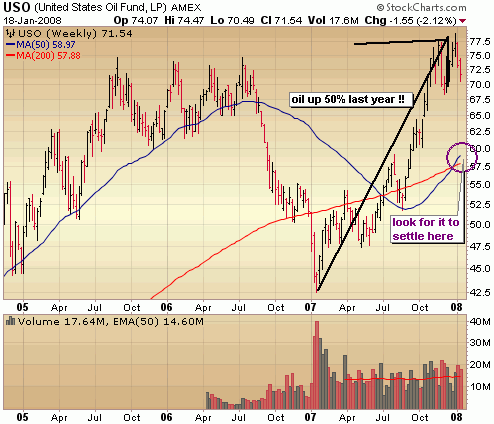
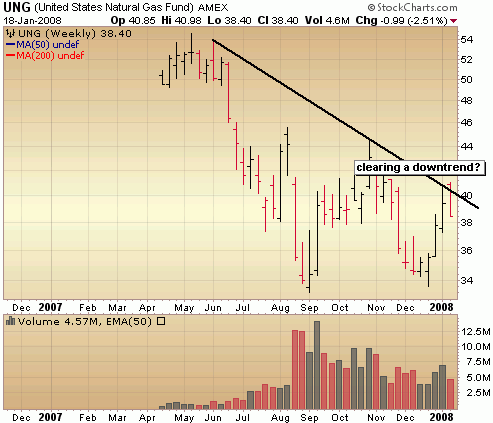
Divergence between oil and natural gas.  As oil breaks down and retreats from $100/barrel, natural gas appears headed the other way and on the verge of breaking out.  It’s hard to believe oil was up 50% this year.  I hadn’t realized that.  I see retrace of that run for the US Oil Fund to the $60 range.

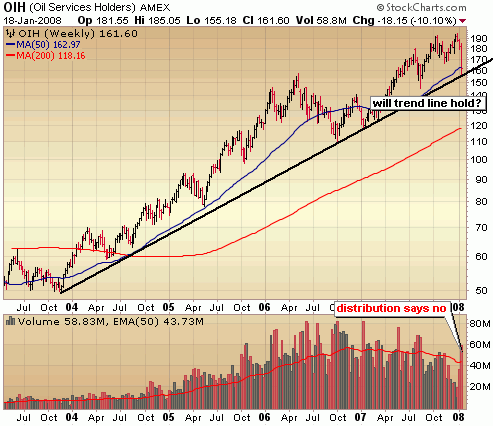
.. and that brings me to Oil Service stocks which are approaching a long term trend line.  It’s holding there now but given the distribution going on these names it’s just a matter of time before before the Oil Services Holders (OIH) takes out that long term trend line.  Oil Service stocks look done to me over the next few months.

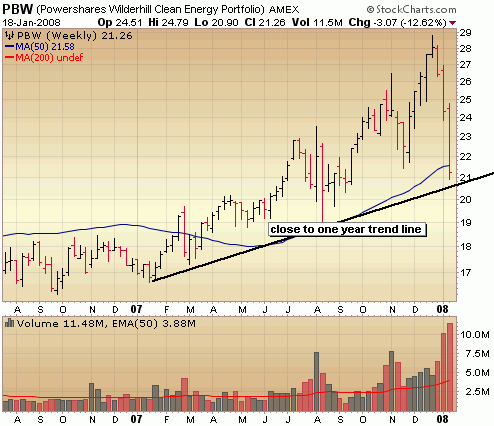
.. and that brings me to alternative energy which tends to trade in line with oil.  The great diversified way to play alternative way is the Powershares Clean Energy (PBW) ETF.  Solar stocks have been killed in the past few weeks and I have to admit some of them are beginning to flash interesting long term entry points.  It’s too soon just yet to get in, but they are worth paying attention to as is PBW.  Below is a weekly chart and you see it’s closing in on a trend line.  However, that is huge distribution going on.  Avoid at least until it begins to stabilize.

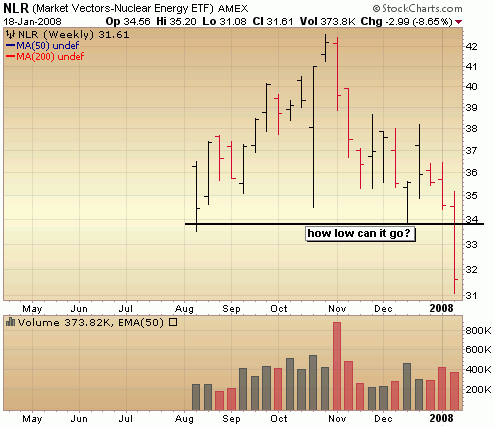
..and on the non renewable side of alternative energy we have nuclear, a source of much debate.  France is doing the right thing with nuclear and largely energy independent.  Nuclear energy traders are probably realizing it will be a long time before nuclear becomes a larger part of our energy source.

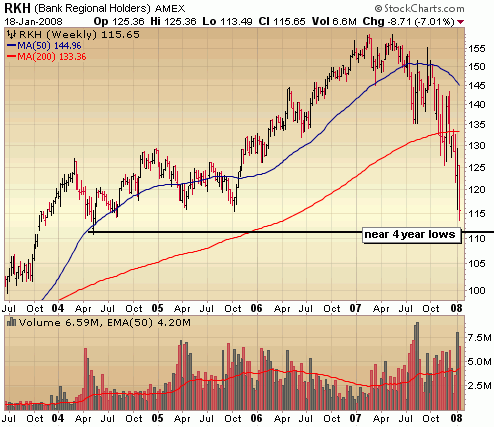
Everyone wants to know when homebuilders and banks will bottom.  I’ve touched on the homebuilders recently as they have begun to stabilize and it appears that the banks (at least the smaller regional ones) have begun to stabilize a bit.  Notice how I’m not calling a bottom.  Downward trendlines will need to be broken for that to happen and we’re quite a ways from that.  Note the capitulation 2 weeks ago on the weekly chart of the Regional Bank Holders (RKH) and a retracing of that move with lighter volume last week.  That is healthier action.  Look for support near the 4 year lows.

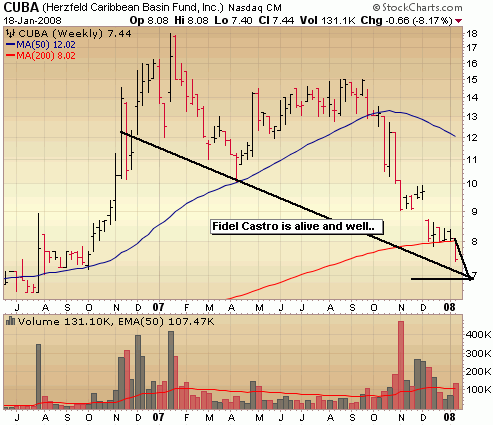
Fidel Castro is alive and well.  Ok maybe not well but he’s alive and that’s more than I can say for the Herzfeld Caribbean Basin Fund (CUBA).

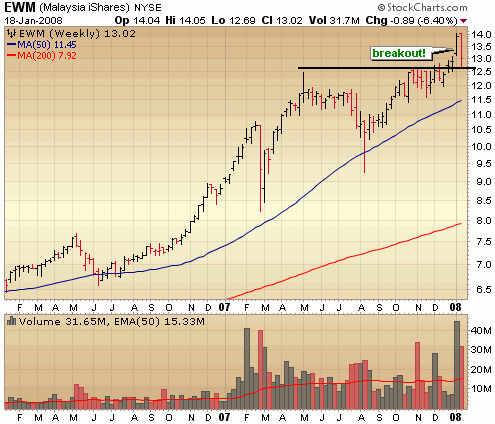
On the other side of the world Malaysia is flying high and defying gravity as the rest of the world crumbles.  Maybe it’s next in line.

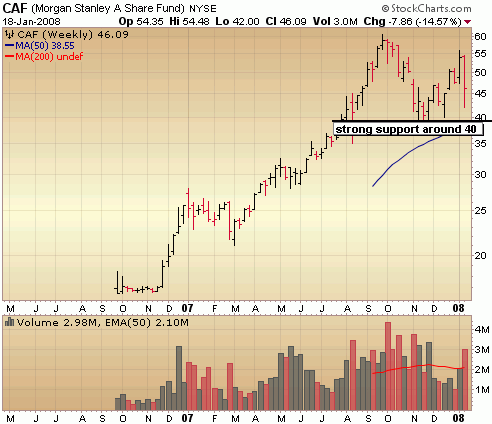
Emerging market high flyers China and India are another story and have the potential to be punished the most.  Looking at the big picture both have a long way to go before you could say serious damage has been inflicted.  In fact the Morgan Stanley A Shares Fund (CAF) could drop nearly another 15% and still be considered a bullish looking chart in terms of the long term picture. 

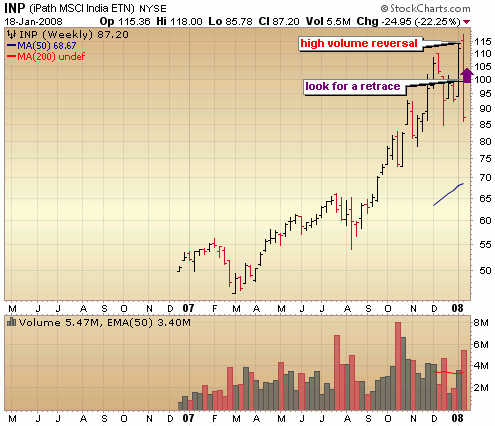
Looks to me like India has just begin its deterioration and may provide a great short entry soon.  INP will be down big on Tuesday so it may be some time before providing a good entry.  Note the potential top marking high volume reversal on the weekly chart in the iPath MSCI India ETF last week.  I’d be looking to get short on a retrace of this move somewhere in the 100 to 105 range.

ETF Review: Metals, Europe, Small Caps Breaking Down

Running through 150 or so charts of ETF’s and closed end funds provide a good read on the overall market and where the money is flowing or not flowing whatever the case may be.   Obviously, the current environment is leading to mostly breakdowns in the charts.  There were no breakouts, with the exception of the S&P Biotech ETF (XBI) which briefly touched all time highs during the week.  Clean Energy (PBW) also looks very strong but it hasn’t cleared all time highs quite yet.  On to the round of breakdowns….

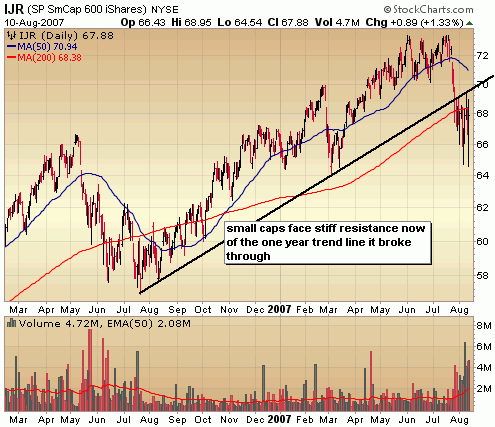
Starting with a broader scale, the Ishares Small Caps ETF (IJR) has taken out the steeper one year trend line but it should be noted that the longer 3 year trend line at around 65 is still intact.  If we take out those lows we’re in trouble.  I think there is a very real possibility of that happening but it will probably be several weeks before that happens.

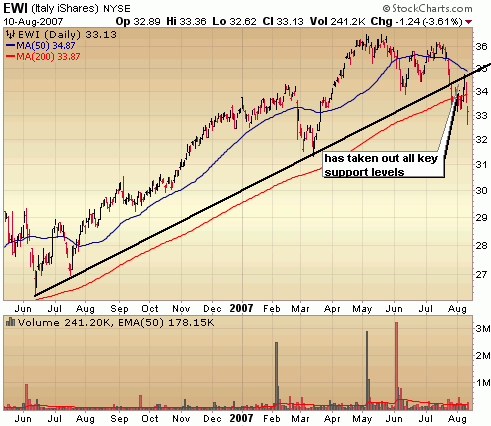
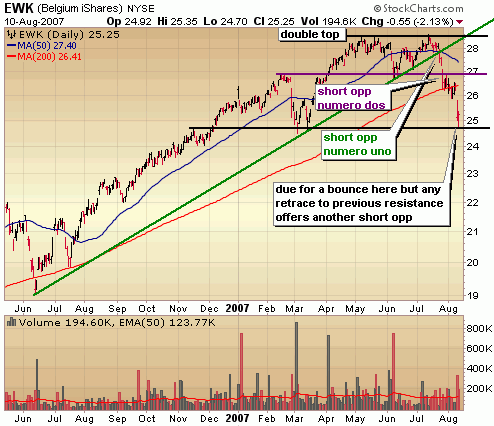
I’m seeing more European ETF’s breaking down with Italy (EWI) and Belgium (EWK) leading the way.  It should be noted that many other country ETF’s are still holding up for the most part (this would include "emerged" market high flyers such as Brazil, Mexico and China).

I’ve made a mess of this chart but what it’s I’m trying to say is that it’s taken out several key support levels but due for a bounce.   The double top indicated that well.. a top might have formed.  When it broke the upward trend line (in green), it confirmed the top.  That followed with further weakness and it busted through the bottom of the channel (in purple) and eventually took out support of the 200 day moving average.  I’d be looking to get in a short opportunity if it can bounce to the 26.50 – 27 range.

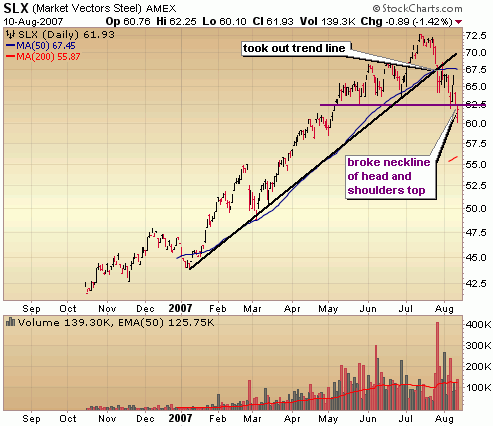
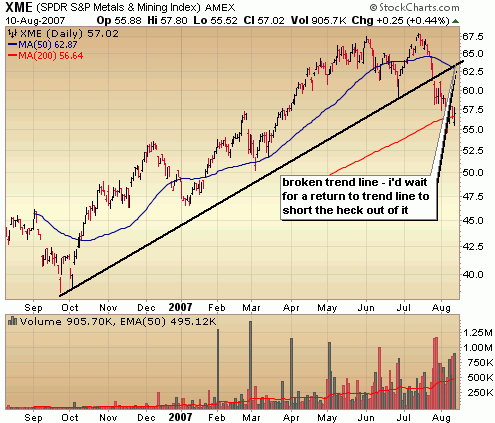
One other theme for this week is the breakdown in metals, specifically the Market Vectors Steel Fund (SLX) & the SPDR Metals & Mining ETF  (XME).

Head and shoulders topping formation in the SLX which along the way resulted in a break of the trend line.. also oversold now but any weak bounce would provide shorting opportunities.

Metals & Mining are breaking down after their torrid run, but oversold in the short term.  If it returns to new resistance around the upward trend line and 200 day moving average around 63, I’d be shorting the heck out of it.  Notice the double top in this one as well.

spdr metals mining etf stock chart

ETF Watch – Healthcare, Pharma & Retail Breaking Down

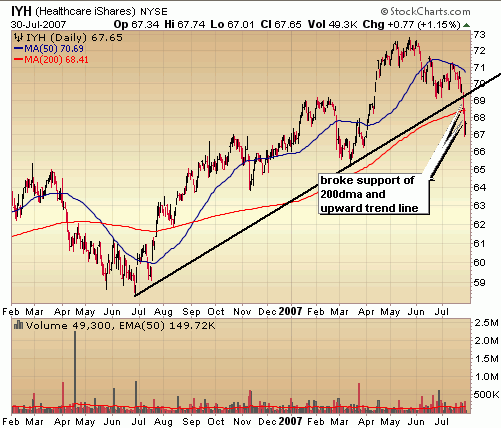
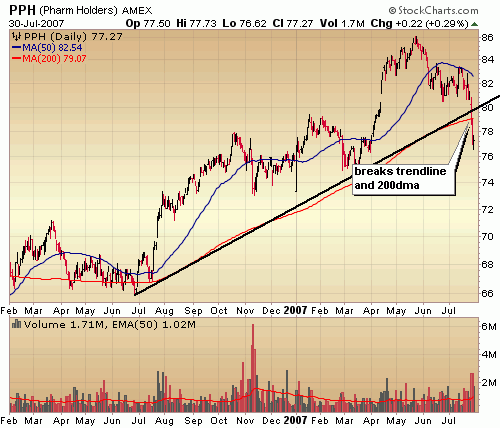
In a review of the exchange traded and closed end funds, none have broken out in the past week but plenty are beginning to break down following the recent market meltdown.  With the next US administration not expected to be so kind to big pharma and healthcare it’s not a total surprise that those sectors of the market have begun to break down.  Although big pharma and healthcare are a bit oversold currently, there should remain some nice short opportunities in these sectors over the next several months.  Both the Ishares Healthcare ETF (IYH) and the Pharmaceuticals Holders ETF (PPH) have broken through key support levels of their upward trend lines and 200 day moving averages.  A bit of a bounce from here would provide an ideal short entry. 

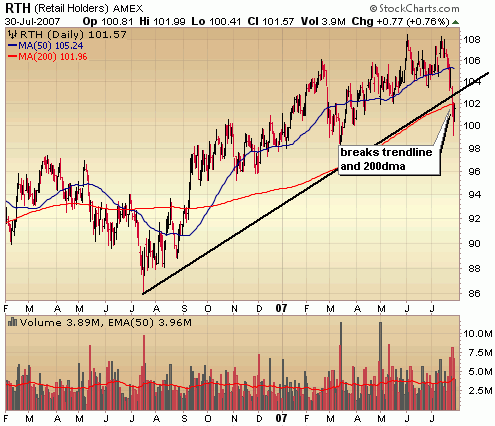
The last chart shows the breakdown in retail with the Retail Holders ETF (RTH).  The consumer can’t possibly be as strong as in the past with the housing situation, so it’s no wonder that retail is breaking down here.  Retail is one area i’ll be looking to find short opportunities in over the next year or two.


ETF Review – Indonesia, Thailand, Software Breakout; Financials Breakdown

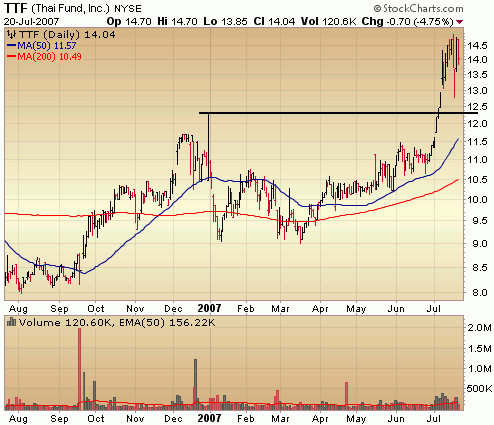
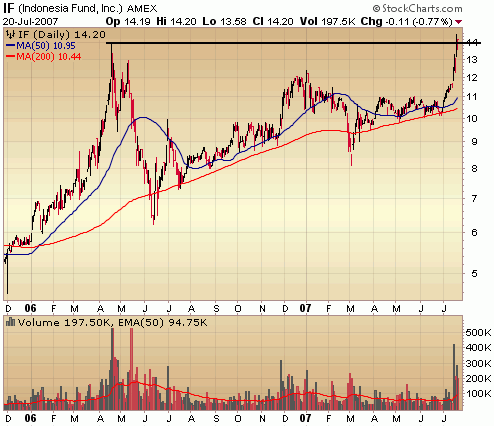
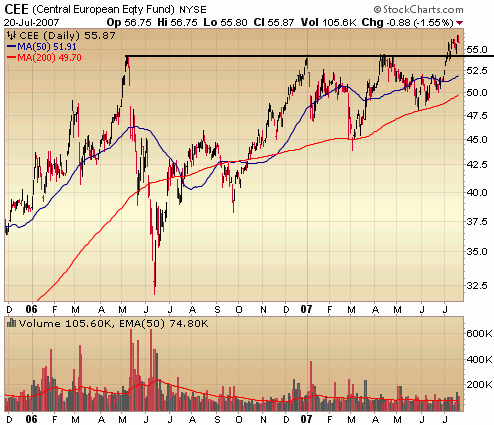
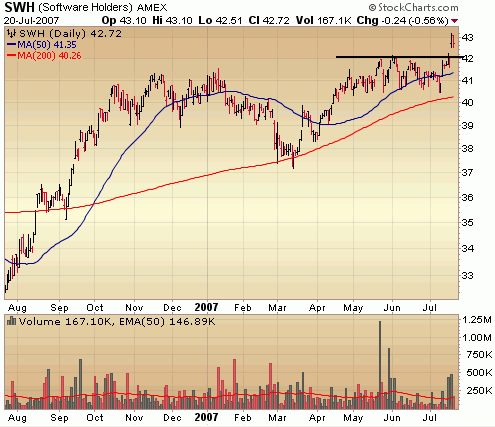
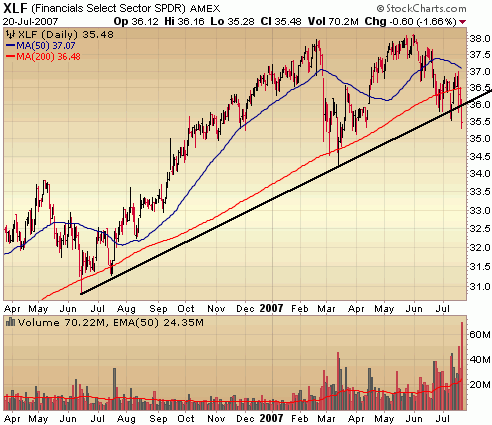
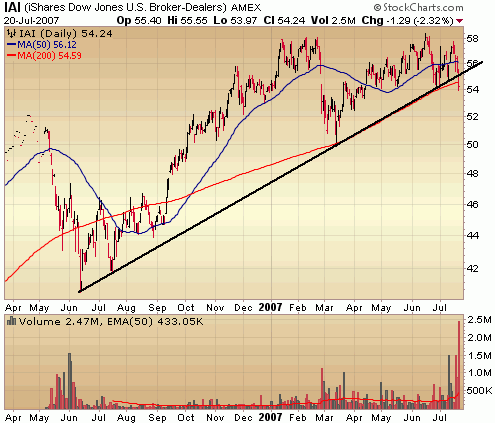
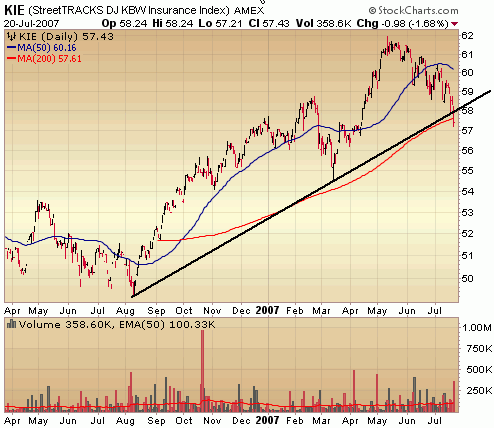
Running through the charts of the ETF’s provides a great look at where in the market the money is moving which can reveal not only rotations but the health of the overall market..  I thought I’d throw up the charts of ETF’s breaking out and breaking down which indicate emerging strength in southeast Asia (Thailand, Indonesia) and Software.  Clearly breaking down are the Financials.

Breakouts

thailand ttf etf

indonesia if etf chart

central europe cee etf stock chart

software etf swh stock chart

The Breakdowns

financials etf xlf stock chart

broker dealer etf iai stock chart

insurance etf kie stock chart

Gold & US Real Estate Break Trendlines – Major Correction in REIT’s Loom

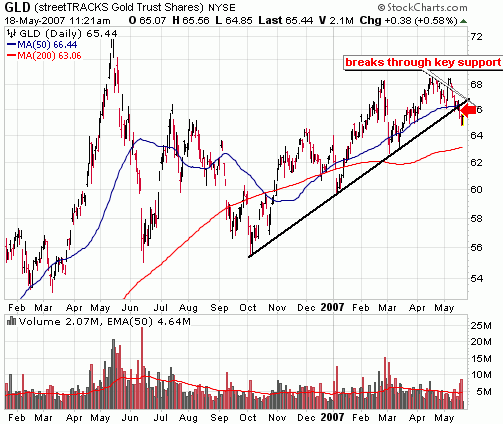
While most of the focus has been on the market making new highs and how long it will last, Gold and US Real Estate (REITs) have been quietly breaking down.

Here’s a chart of the Streettracks Gold Trust (GLD) which seeks to track the price of gold bullion.  You can see it’s broken through an 8 month trendline with a drop to the next level of support around the 50 day moving average likely.

gold breaks trendline streettracks gold trust gld

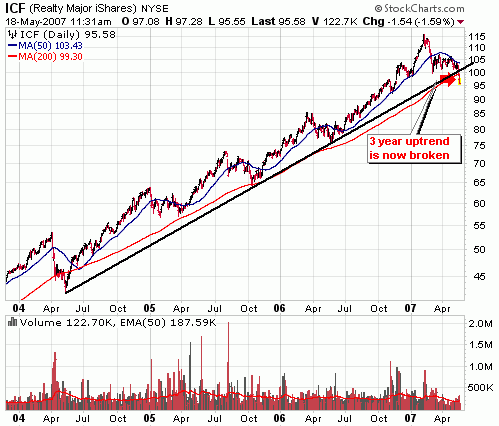
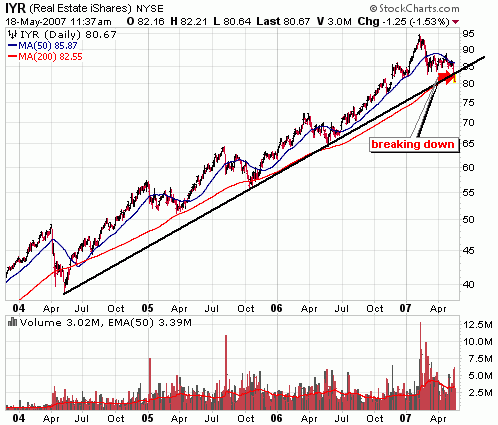
After a tremendous 4 year run, it appears the REIT’s are on their last leg and setting up for a major correction over the next several months.  Two of the major real estate ETF’s that I track, the Ishares Real Estate Index (IYR) and the Ishares Cohen & Steers Realty Index (ICF) illustrate this break down.

real estate reit ishares ICF

IYR ishares real estate break trendline

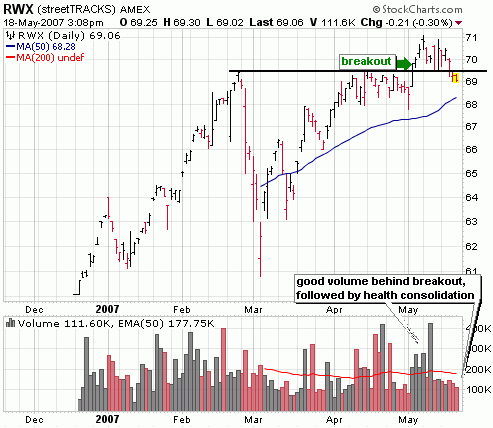
It’s interesting to note that while US Real Estate breaks down, international real estate is holding up well as indicated by the SPDR Willshire International Real Estate Etf (RWX).  It broke out in May and is holding the breakout well.

international real estate streettracks RWK etf

Soon, India Will Offer Buy Opportunity – A Look at the India Fund (IFN)

I’m not posting the weekly report this week because I’ve been busy all weekend making final preparations for the launch of the new SelfInvestors.com and the market didn’t do much of anything last week.  The bears appear to be having trouble exerting any kind of control as each attempt at a sell off was met with a barrage of buying to keep the market virtually unchanged.  Soon, something will have to give.  The longer the bulls can keep bears in check, the greater the chance the market has of testing those old highs.  Although I’m still a bit biased on the bearish side and think that the market will test the previous  lows of the correction sooner rather than later.  In lieu of the weekly market report I thought I’d post a little analysis on the India closed funds, specifically the India Fund (IFN).

It’s been almost one year since the India stock market crash so I thought it would be a great time to take a look and see what the technical picture looks like.  Before I do though, it’s a good idea to take a look how the current stock price relates to the Net Asset Value (NAV).  With no mechanism in place to keep closed end funds from trading at significant discounts or premiums to their net asset value (NAV), these funds can get way overpriced as was the case with the India Fund (IFN) before the May crash.  Let’s have a look.  The following charts are provided by ETFConnect.com

You can see the India Fund (IFN) traded at a huge premium to its net asset value before crashing.  It was trading at the greatest premium in its history.  Just in the past few weeks the fund has finally come into line and is trading close to the net asset value (actually it’s begun trading at a slight discount).  The second image just provides another visual look at the discrepancy. 

With closed end funds it’s important to know if it’s trading at a discount or premium to the underlying net asset value, but it’s also important to keep in mind that a closed end fund can trade at discounts or premiums for quite awhile.  In order to get a clearer picture of future price movement I refer to the charts and a bit of technical analysis. 

In the weekly chart of the India Fund (IFN) below, there are some key characteristics that can provide a decent prediction of where its going over the next several weeks.  For one, notice the possibility that the stock will go on to form a large double bottom base (which resembles a W).  Stocks or funds that stage severe corrections will often go on to form these patterns during their correction.  Knife catchers, bottom feeders and short covering lead to a weak, convictionless bounce off the bottom that ultimately loses steam.  In the second leg down (which is where we’re at now), the selling loses intensity indicating sellers are beginning to give way to buyers.  Notice the amount of sell volume was about twice as heavy during the initial crash then it is now during this second leg down?  What needs to happen is that we need to test the lows of the correction or possibly undercut those lows to shake out the last of the weak hands.  So a drop to around 35 or so.  Only then, will the last of the sellers be exhausted and a new round of enthusiastic buying can begin.  It’s not time to be buying India just yet, but in a few weeks it may offer a great opportunity to once again get into one of the fastest growing economies in the world.

5 ETF’s to Watch & Stock Market Wisdom From the Yahoo Message Boards

Tom Dyson of ETF Trends offered up a few ETFs that could lead the way as soon as this market (I’m hesitant to call it a correction) is done running its course. 

1) iShares Netherlands (EWN)
"The country has stable relations, moderate unemployment and is an important European transportation hub"

2) Ishares South Africa (EZA)
"The country has recorded its first ever economic surplus, and with gold on the rebound this ETF looks promising"

3) Ishares Latin America (ILF)
"Despite the expansion of Chavez’s powers throughout Venezuela and Ecuador, investor confidence need not be swayed away from Latin America"

4) WisdomTree International Financial (DRF)

5) ProShares Ultra QQQ (QLD)
"The aggressive long strategy does impose some intense risk, but when short-term trades are implemented, results can be rewarding"

See Tom’s full article Five ETFs To Watch As the Stock Market Rebounds

—————————

A few days ago DailyWealth gleaned some words of wisdom from the message booards.  I personally find the message boards to be just transcripts of a financial version of the Jerry Springer show, but it’s often a good place to learn what NOT to do as Tom points out.  This article is reprinted with permission from Daily Wealth.

Unlikely Wisdom from the Message Boards
By Tom Dyson

New Century Financial (NEW) is an American subprime mortgage lender. It lends money to high-risk borrowers… first-time buyers… low-income families… and folks with bad credit histories.

Unfortunately, New Century has been careless about whom it lent money. And it didn’t worry about the true value of the houses it lent money against. It was an easy mistake to make. The American housing market was booming, the economy was strong, and New Century was minting money with each new loan origination.

Late last year, the ball unraveled. The housing market started falling and many of New Century’s debtors decided they couldn’t make their mortgage payments.

In the last six weeks, New Century Financial’s share price has fallen from $30 to $3. Yesterday, trading was halted on the NYSE, pending more news. In other words, it’s about to go bankrupt.

I spent the weekend surfing the Yahoo! Message boards for New Century Financial. I always find the message board for troubled companies to be a fantastic source of investment wisdom. Here are some examples:

"I’ve lost my entire life savings… $33,000… does anyone know a good lawyer. I’m suing these bastards. Some motherf**ker has to pay for this."

Lesson No. 1: I will never put all my eggs in one basket. No matter how certain an investment seems, there will always be unseen risks.

Lesson No. 2: The next time I lose money on an investment, I will blame myself. Blaming other people is a waste of emotional capital. And it doesn’t help me learn. Even in a fraud situation, it’s my fault. Fraud happens all the time. I ought to be aware of it. 

"The way I look at NEW is that when I bought at $5 I was getting it on a 90% off sale. If you went to the mall and saw a sign ‘90% OFF TODAY ONLY!’ would you run out of the mall screaming? I don’t think so."

Lesson No. 3: Value and price are not the same. New Century Financial has no value. In fact, given its huge debts, it’s probably worth negative-$10 billion. Even at $5 a share, it’s still massively overvalued. (It traded for $65 last year.)

On the other hand, I’m reminded of the story of Tom Barrack and the Fukuoka Dome stadium in Japan. Barrack invested when he noticed that the titanium in the retractable roof was worth more than the purchase price of the stadium. He knew he was buying value. He knew his downside was limited.

"I got in at high price when it crashed, but it was still too high. Then I got a lot more when it was $4.45 last week. So even down today, I am not losing much. $4.60 is a good bargain."

Lesson No. 4: Cut the losses. Even if a stock falls from $40 to $4, it can easily go to zero. By cutting your losses with a simple trailing stop, you never have to be in this situation again. Buying more on the way down is not a way to pick up a great bargain… it’s a way to magnify your losses.

I love the message boards. Most serious investors hate them. The trick is, don’t take them seriously and you just might learn something…