Oil continued to surge higher this week, but it was a different story for the overall market as traders began to lock in profits following an impressive surge off the March double bottom.
I talk about this quite a bit here, but it’s worth repeating. At market bottoms, the sentiment begins to shift as traders look for just about any positive news to rally as the bad news gets fully priced in. Near market tops (or after sustained runs), you’ll notice a shift in the opposite direction as traders look for an excuse to take profits. No longer does the good news spark a rally because it’s been largely priced in.
On Monday evening I sent the following to my members (you can receive these reports by signing up at the left)
"It was fairly subtle but did you notice it today? Perhaps a shift in sentiment is underway. I’ve began discussing the shift in sentiment after the Bear Stearns bailout to a more bullish tone. That is, the
market seemed to be beginning to focus on the positives, looking for any glimmer of daylight to rally. It was time to begin adding on the long side. BUT, the action today revealed a possible reversal to
increasingly bearish sentiment. Over the past several weeks the market rallied on any economic news that was "better than expected". What happened today? That non manufacturing ISM index
came in better than expected and well ahead of last months reading (49.6) at 52 which indicated expansion. While the market surged initially, it quickly wore off and the indices never recovered. A
few weeks ago, it probably would have been enough to kick start AND sustain a rally. This isn’t a clear indication that this rally is coming to an end, just a small clue. Considering today’s selling volume came in on the light side, it’s considered a healthy day of consolidation keeping the bulls in charge for now. However, I’m still playing it cautiously and trading only in the very short term. As further indication that the end of the rally is very near, be on the lookout for a day of distribution. I think we are close to that."
That was clue number 1 that perhaps the market was stalling out. Then came Wednesday and the big day of distribution. It’s important to remember that one day of distribution won’t kill a rally. After the run up we’ve had, it’s not unusual to have a big day of selling like that. However, it’s also important to remember that this is still a bear market that’s to be respected, not to mention we’re heading into what is notoriously one of the worst months for the market. After a bear rally like that why not lock in a good portion of those gains?
On Wednesday evening I sent the following to members:
"A couple days ago I mentioned that the market provided a subtle clue that perhaps the rally was coming to an end by not rallying after a positive ISM report. Today, the market provided a much bigger clue that the rally is coming to an end with a big day of distribution as the Dow was unable to take out resistance of the 200 day moving average. It was the first day where sellers really exerted some control since April 11th, when GE reported awful results.
There really wasn’t a glaring catalyst that induced today’s selling.. Oil approaching 125/barrel will certainly stoke inflationary fears and put further strain on an already strapped consumer and I don’t think the market has fully priced those concerns in. Outside of that and a weak pending home sales
number, this was probably more of a technical sell off.
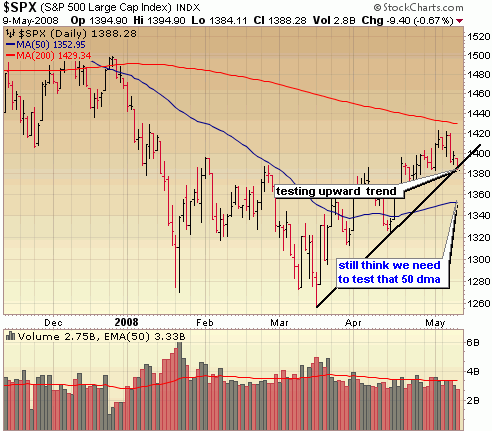
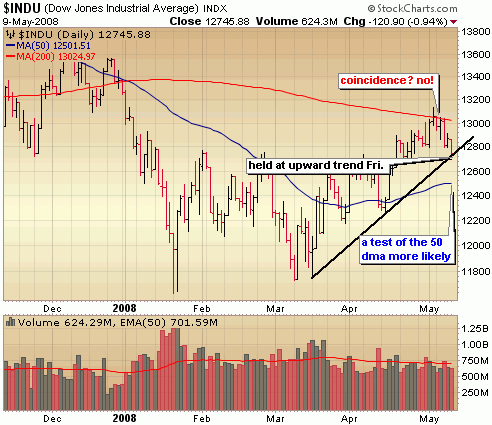
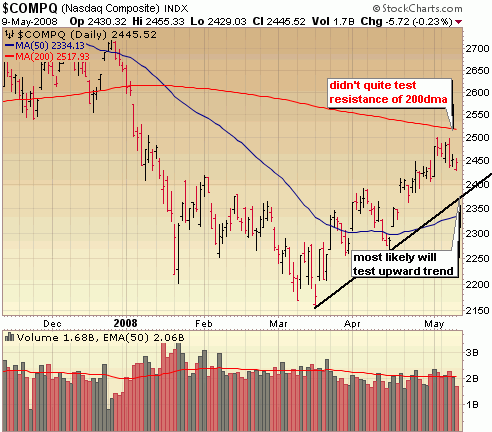
Volume wasn’t through the roof on the sell side today, but it was considerably heavier than the day before and sets us up for additional weakness in the coming days. Just how far the market pulls back is very difficult to get a read on after just one day. We’ll have to keep an eye on support levels and the amount of sell volume on down days. The next areas of support and likely test areas for the indices are Dow 12700 (upward trend line & previous highs), Nasdaq 2400 (april high) and S&P 1385 (upward trend line). If we take out these levels (which I think is quite likely), we’re most likely headed down to test the 50 day moving averages. Testing this moving average would be roughly a 50% retracement of the rally off the March bottom and an area where I’d be looking to get more aggressive on the long side once again.
I closed out most of my long positions last week and two more today. I’m sitting on 50% cash, 25% long and 25% short."
Currently, both the Dow and S&P are sitting right on their upward trend lines but probably poised to break through. Let’s take a closer look…
The S&P as you can see sits right on that line, but give the distribution we saw Wednesday I really think we break through that level and ultimately test the 50 day moving average at some point. I probably won’t get more aggressive on the long side until we get down to those levels. Some people are even calling for a retest of the lows of the correction but in my opinion we don’t get down that far again. I do think that double bottom is a long term bottom for the market. We’ll see.
Notice how the Dow tested major resistance of the 200 day moving average on several occasions and was unable to bust through. That was another signal that the market was tiring. It’s no coincidence that that was the barrier in the Dow. We now turn our attention to support levels for an indication of how far this pull back will go. The Dow did hold at the upward trend on Friday, but again, I just don’t think this is the end of the pull back and the Dow soars to new heights. A test of the 50 day moving average seems more likely.
The Nasdaq never quite tested that 200 day moving average, but did have trouble with psychological resistance at 2500 and appears headed to test the upward trend line in the 2400 range.
The bottom line is that this is no time to be aggressive on the long side, but I don’t think it’s necessarily a good time to be aggressive on the short side either. If you’re not a shorter term trader trying to take advantage of some of these moves in solar, china and oil plays it’s probably best to sit on cash for awhile as we get further into May.
::: Model Portfolio :::
** This section will now appear as a separate report about every other Wednesday.
The Self Investors Model Portolio wrapped up 2007 with a 30.2% gain. Would you like to receive buy and sell alerts within minutes (NEW! now get them via instant messaging in near real time) of each transaction in the portfolio? You can receive these along with ALL of the tracking tools and reports with the very popular Gold membership. Don’t delay, get started today and join me for many more highly profitable months here at SelfInvestors.com.
::: Best/Worst Performers :::
– Top 10 Performing Industries For the Week –
1. Oil & Gas Equip & Services: 7.70%
2. Industrial Equipment Wholesale: 7.45%
3. Industrial Metals & Minerals: 7.25%
4. Oil & Gas Drilling & Exploration: 5.55%
5. Independent Oil & Gas: 5.55%
6. Gold: 5.40%
7. Silver: 5.30%
8. Metal Fabrication: 4.90%
9. Heavy Construction: 4.40%
10. Specialty Chemicals: 3.85%
– Top 10 Worst Performing Industries For the Week –
1. Major Airlines: -11.40%
2. Drugs – Generic: -11.05%
3. Banks – SE: -8.85%
4. Drugs – Related Products: -7.90%
5. Building Materials Wholesale: -7.90%
6. Regional Airlines: -7.80%
7. Investment Brokerage: -6.65%
8. Education & Training Services: -6.55%
9. Department Stores: -6.50%
10. Home Improvement Stores: -6.40%
– Top 5 Best Performing ETFs For the Week –
1. Market Vectors Russia (RSX) 10.05%
2. United States Oil (USO) 9.35%
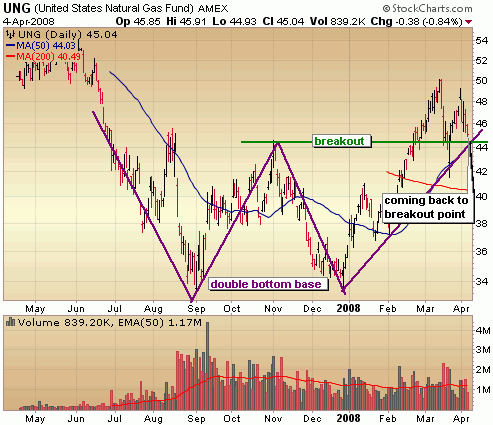
3. US Natural Gas (UNG) 8.15%
4. SPDR Oil & Gas Equip & Services (XES) 7.30%
5. iShares S&P Commodity Index (GSG) 7.30%
– Worst 5 Performing ETF’s –
1. HOLDRS Internet Infrastructure (IIH) -30.30%
2. Greater China Fund (GCH) -10.90%
3. Morgan Stanley India (IIF) -10.05%
4. India Fund (IFN) -9.15%
5. Ishares Home Construction (ITB) -8.60%
::: IPO’s Worth Watching for This Week :::
This section will now appear as a separate post on Mondays.
While 2008 should be a much slower year for IPO’s considering the deterioration of the market, there will continue to be some good companies coming to market here and there. I’ll be highlighting the best IPO’s every Monday.
::: Upcoming Economic Reports (5/12/2008- 5/16/2008) :::
Monday: Treasury Budget
Tuesday: Retail Sales, Export/Import Prices, Business Inventories
Wednesday: CPI, Crude Inventories
Thursday: Initial Claims, Capacity Utilization, Industrial Production, Philly Fed
Construction Spending, ISM Index
Friday: Building Permits, Housing Starts
::: Earnings I’m Watching This Week :::
Monday:
XFMedia (XFML)
Tuesday:
Applied Materials (AMAT), Cameco (CCJ), Canadian Solar (CSIQ), Gushan Environmental (GU)
Wednesday:
China Digital TV (STV), Ctrip.com (CTRP), Deere (DE)
Thursday:
Hewlett Packard (HPQ), Urban Outfitters (URBN)
Friday:
Abercrombie & Fitch (ANF)
::: In Case You Missed It – SelfInvestors Blog Entries of the Past Week :::
1. Visa (V) Vs. Mastercard (MA): Earnings Results
2. Peak Oil, Peak Water.. We’re All Gonna Die
3. Selling in May Is Not a Bad Strategy
4. Colfax (CFX) & Real Goods Solar (RSOL) IPOs Begin Trading
