All posts by Tate Dwinnell

Bulls Make a Stand, Major Indices Holding Upward Trend Lines

All indications were pointing to profit taking of some kind, with the big unknown being the severity of the decline.  With the action of last week and today, it seems we’re getting the answer.  Any correction won’t be severe.  Over the weekend I mentioned the following to registered members in the Weekly Market Review:

"Technical forecasts have been calling for some sort of correction (me included), but the big unkown is by how much and how severe.  If the action continues anything like last week, we won’t be down for long.  Despite a round of economic numbers last week that indicate an economy slowing a bit more than expected (who really knows what the heck is going on with the number of jobs?!), the major indices managed to hold their upward trends throughout the week.  I’d call it a big victory for the bulls.  The weekly pull back occurred on light volume.. just the kind of digestion you want to see.  The longer the bulls hold their ground and keep the market in the upward trend, the greater the chance we’ll be off to the races again.  However, with the elections on Tuesday and the deteriorating action in leading stocks last week, it pays to be very cautious at this point.  The action next week will be pivotal.  Stay tuned for the After Market reports during week!"

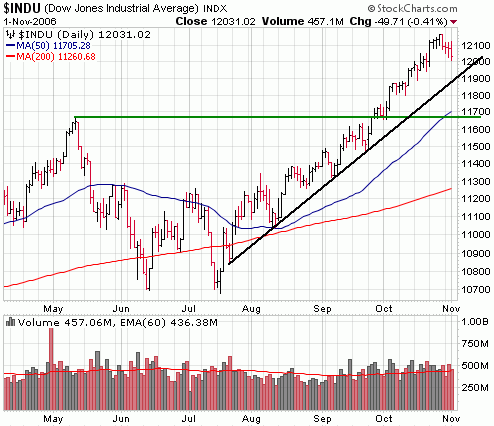
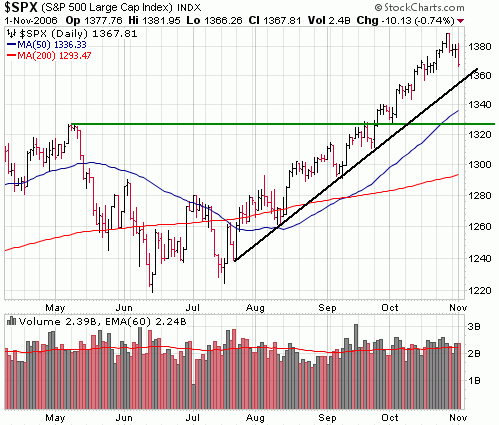
I certainly didn’t expect the bulls to come charging out of the gate Monday morning ahead of tomorrow’s election, but that’s what the market does best.  Move when you least expect it.   Today’s action was not out and out, frenzied buying by any stretch, but technically there was indication of accumulation in the Nasdaq as it reclaimed support of its upward trend line.  Both the S&P and Dow bounced off their respective trend lines.  Yes, today’s action was mighty positive and we should be preparing for the Nasdaq to take out its 52 week highs.  If not, the upward trend line on all indices are shaping up to be strong support levels.  Now bring on the elections!

In addition to the free Weekly Reviews, registered members of SelfInvestors.com receive After Market reports on days when the market makes a significant move.  In addition to commentary, I highlight any accumulation or distribution in the major indices, the action of leading stocks, industries/sectors leading and lagging the market and last, but not least a Stock of the Day.  If you’d like to receive these reports, all it takes is a name and an email address on the homepage at SelfInvestors.com.  Yes, you can use phony names as some people do.  I think one of these days I’ll post some of the names people put in that form.. somewhat entertaining.  Anyway, today’s Stock of the Day was Charles Schwab (SCHW), which broke out to a new multi year high with good volume.  Ever since Charles moved to slash commission prices a couple years ago, the company has been on a tear.

ABOUT:  Charles Schwab engages, through its subsidiaries, in securities brokerage, banking and related financial services. The Company provides financial services to individuals and institutional clients through three segments: Schwab Investor Services, Schwab Institutional and U.S. Trust. The Schwab Investor Services segment includes the Company’s retail brokerage and banking operations, as well as the division that serves company 401(k) plan sponsors and third-party administrators and supports company stock option plans. The Schwab Institutional segment provides custodial, trading and support services to independent investment advisors (IAs). The U.S. Trust segment provides investment, wealth management, custody, fiduciary, and private banking services to individual and institutional clients.

FUNDAMENTAL: A company that was a bit slow to offer discounted trading, but once it did the earnings and sales began to pick up again.  Earnings growth has surged to about 40 – 50% in the last couple years with strong sales growth around 20%.  Margins and ROE continue to rise just as they have for a couple years and are excellent.  Once again a premier company.

TECHNICAL: Broke out with good volume today to a new multi year high.  The construction of the base isn’t exceptional but it’s good enough for a great company in a strong industry and strong market.  The way I’d play this one is to let the breakout ride, then look for a light volume pull back to a buyable range.. just to make the stock prove itself.

SELFINVESTORS RATING: With a total score of 50/60 (27/30 for fundamentals, 23/30 for technical), SCHW is a top SelfInvestors breakout stock.

 

Round of Profit Taking Begins, Leading Stocks Deteriorate

After any sustained move in the market up or down, I get a bit more hyper vigilant about looking for clues that the trend is about to change, at least in the short term.  That always begins with a read of the charts.. a trust in what the technicals are telling me.  This certainly goes along with my previous post about mastering emotions when trading – the more mechanical and technical you are, the less likely your emotions will influence your trading decisions.  I sent the following note to registered members of SelfInvestors.com over the weekend (you can sign up for these weekend and after market reports with your email address on the home page if you’d like) discussing this:

Focusing On the Charts, Not on Opinion

"Following a lengthy market run (or sell off) like the one we’ve had over the past couple months (which is rivaling the run off the market bottom back in ’03) I tend to get a little defensive and begin looking for any clues that the run is over, at least in the short term.  Those clues come in the form of technical analysis and only technical analysis.  In fact it’s during these times I try to read less about the various opinions on what the market will do and focus more on what the charts are indicating.  Granted, for those of us who are technical analysts or "chartists" it’s not always easy to trust the charts, but essential.

So what are the charts telling me and what am I "trusting"?  For the S&P and Dow, I’m fairly neutral.  The charts aren’t showing signs of significant weakness at this point and there are no significant resistance levels in sight.  What concerns me most is the Naz and the deteriorating action in the semiconductors which appear to have much more room to run.. to the downside.  In the Nasdaq, it faces formidable resistance at the April highs.  If you take a look at the weekly chart, what you’ll see is 3 straight weeks of weakening technical action.  By all indications, with the Nasdaq leading the way, the market begins to digest its gains now.

That being said, I don’t believe any correction from here will be severe and that any dips will provide anxious buyers who may have missed the bulk of the rally with an opportunity to get their feet wet.  I know I will be looking for an orderly pull back to begin leveraging gains with margin.  Remember that many investors are still stung by the 2000 crash and remain skeptical about the ability of the market to make them money with tolerable risk.  It wasn’t until recently that more friends of mine (who don’t follow the market) have begun to make comments about the market, but none of them are yet putting money to work.  We haven’t reached that frenzied stage"

A Round of Profit Taking Begins

If there has been any question about whether significant profit taking at these lofty levels would ensue, today’s action probably puts those questions to rest.  In the weekend review email I mentioned that I’m "trusting" the technicals which are telling me the Nasdaq was showing signs of a top (resistance, 3 straight weeks of weakening action) and that the correction begins now with the Nasdaq leading the way.  Today’s action confirms it. 

On Monday and Tuesday, the bulls held their ground just as they have over the past several days, preventing significant selling.  However, new fears are creeping into the market.  With the lower than expected GDP on Friday, the Chicago PMI at a 14 month low yesterday and a much larger drop in the Manufacturing ISM this morning to 51.2% (anything below 50% indicates contraction), there are fears that perhaps the economy may be slowing a bit too much.  That provided an excuse to lock in some nice profits and that trend should continue over the next couple weeks. 

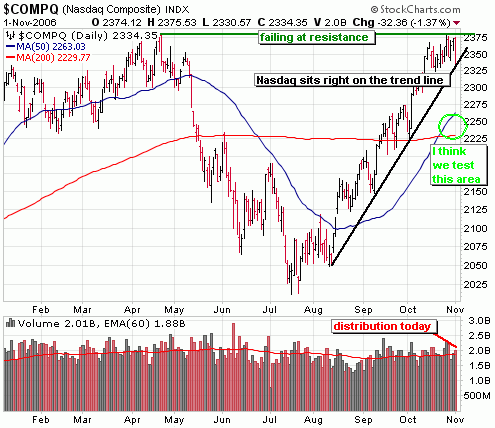
It should be noted that the Nasdaq led the way down today, with semiconductors providing leadership to the downside.  Distribution (institutional selling) occurred in the Nasdaq, but not in the S&P and Dow.  Technically, the Nasdaq is currently sitting right on support of its upward trend line but has the momentum to take out that level and ultimately test the area around 2250, where the 50 and 200 day moving averages converge.  Both the Dow and the S&P looked relatively healthy today, despite the selling and have some room to run before testing their upward trend lines. 

Here’s a look at the charts of the major indices:

The Nasdaq still has support at the first support area of the upward trend line (in black), but the intensity of today’s selling (distribution) would indicate that level won’t hold.  I’m looking for a much larger drop to the area around where the 50 and 200 day moving averages converge (~ 2250).  Note the failure at resistance of the April highs.

You can see that the Dow remains the strongest of the indices and the selling wasn’t nearly as intense in the big blue chips as it was in the smaller, tech oriented names.  There is a considerable amount of room to run before the Dow even touches its upward trend line.  It’s too soon to tell if it will hold that line, but if I were to guess I’d say it eventually takes out that level and retests the previous all time highs around 11,700.

The S&P looks very similar to the Dow and has some room to run before testing first level support at the upward trend line at around 1360.  If it can’t hold there, expect a retest of the previous highs around 1330.

Leading Stocks Deteriorate

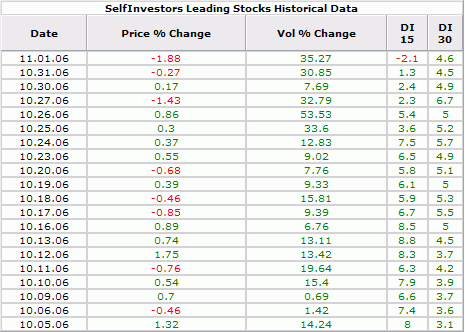
The action in the Nasdaq is a concern, but more concerning is the action of leading stocks.  The Self Investors Leading Stocks Index, which is an index comprised of 360 (it fluctuates between 300 – 400) of the fastest growing companies leading the market higher.  They did not fare well today.  In fact it was one of the worst performances in a few months.  If you’ve been following some of the earnings reports recently, you’ve seen the carnage in even the best companies.  Garmin (GRMN), Encore Wire (WIRE), TheStreet.com (TSCM), Ansoft (ANST), and on and on.  The performance of leading stocks is something that I monitor every day (you can too over in the right column of this blog) and the trend over the past several days clearly indicates leading stocks are faltering.  The following table shows the performance of the Leading Stocks index over the past 20 days with its corresponding DI scores.  I’ve mentioned those scores here before, but basically they are Demand Indicator scores (a measurement that I formulated to track demand in a stock or index based on price and volume movements – the higher the score, the greater the demand).  Registered members of SelfInvestors.com will have access to this historical data once the new site is released in just a couple weeks!  Stay tuned.

Notice the steady trend  lower in the demand, particularly in the shorter time frame of 15 days.  In the middle of October, the DI 15 score was averaging around 7-8, but in the last several days it’s been hovering around 2, before dropping to negative today for the first time in several weeks.

Mastering the Emotions of Trading

Some would argue that the biggest barrier between you and success in trading the financial markets is time, money, software or strategy, but I would argue that the biggest barrier to success is simple human emotion.  Fear and greed.  Being able to stay calm when a trade turns against you and make a rational decision based on price/volume and support levels as well as being able to avoid the temptations of greed.. trying to squeeze more out of an extended trade is something that can’t be learned through paper trading and back testing.  Only when you have experienced the thrills of big gains or the agony of sharp losses can you learn more about your own emotions and who you are as a trader.  Only then can you begin to work to tame these emotions an increase your success.

A recent newsletter from Gary Scott describes the element of emotion so well:

" Change can come quickly…and does.  Knowing this fact can make you a millionaire.

This thought came to mind as Merri and I hiked over a deep ravine on a train trestle with our daughter Francesca.  Many readers write in and tell me how they plan to speculate in currency (or other commodity) futures, based on programs they have tested on paper.

Studying markets in advance is great but ….for those who plan to then move forward and speculate…may I suggest…buy a 12 foot two by four board.

Lay it on the floor.  Walk on it. All 12 feet. Unless you have an inner ear problem, or other mobility issue, walking the board is easy. 

Now go find a 100 foot chasm like the one below. Lay the board across the rift. Now walk across the board over the drop.  It’s the same. Right?  Can your emotions ignore the drop? Probably not. Mine certainly can’t!

Actually do not do this!  Hopefully the point is clear without the risk of death from a headlong plunge. The 12 foot walk is easy on the ground. Over the chasm it could be impossible……because of emotion. 

20% of good investing with real money is knowledge…80% is emotional control.

My experience suggests that 20% of investors look for change, calculate what the new horizons might bring and invest based on inner beliefs they stick to.  They do not get caught in the emotions of greed when markets rise.  Nor do they panic in the emotion of fear when markets fall.

80% of investors invest emotionally and lose.

Until next message, embrace change and embrace the reality of your emotional circumstances. Adjust your investing style accordingly."

————————

I recently had the great pleasure of joining Gary and his wife Merri for clam chowder as they stopped in Seattle during a cross country road trip.  I know that my life is enriched for having known them and highly recommend having a look at some of the seminars they offer in Ecuador and North Carolina.  Everything from investing in foreign currency markets to natural healing/health toSpanish lessons are offered.  I’m hoping to get to Ecuador early next year myself!  You can see more at http://www.garyscott.com/

Nasdaq Takes Out Multi Year Highs With Volume, But Pay Attention to Tomorrow’s Close

Just as the S&P did more than one month ago, the Nasdaq too has cleared multi year highs with sights set on much loftier goals of following in the footsteps Dow and taking out all time highs (a long ways to go!).  Yet again, the bulls got what they wanted today.. a dovish Fed and more solid earnings results, which led to a day where the big fellas put more cash (in the tech heavy Nasdaq) to work despite an overstretched market.  Going into tomorrow mornings GDP report, the Nasdaq has considerable momentum but will need to hold above the April highs to keep the vertical ascent intatct.  I think tomorrow’s action will be very telling about where we go from here over the next couple weeks.

I’ve included the weekly chart of the Nasdaq too, which provides a better look at the overall volume/price trend and indicates some hesitancy on the part of buyers in the past couple weeks.  By the end of the trading tomorrow, we’ll know if the Nasdaq puts in a 3rd week of weakening action.  I have a feeling we may run at the the open and sell off in the afternoon.. we’ll see!

Market Priced for Perfection, Ripe for Retreat

Christmas has come early for the Bulls.  Over the past several weeks it seems that just about every economic report, Fed speech and recently earnings reports (most notably from consumer related stocks) have been just what the Bulls have asked for.  Commodities are off their highs, the consumer is strong, manufacturing robust, inflation in check, all while the housing market cools providing the perfect "goldilocks" situation.  With that, the market is priced for perfection and ripe for a fall.  Will traders "sell the news" after tomorrow mornings PPI data? The charts would indicate that scenario is highly likely.

The Dow remains the strongest of the major indices and is still showing considerable strength despite kissing the upper reaches of its short term trend line.  Combine the overbought conditions with today’s lack of enthusiastic buying as well as psychological resistance of Dow 12,000 and you have a set up for profit taking.  Considering the amount of strength behind this move, the Dow may just retest the bottom of the channel around 11800 before moving higher.  This is an area I might look to start adding new positions, depending on the amount of sell volume.

The Nasdaq looks mighty tired up here, lacking much conviction to punch through resistance of the April highs.  Notice it’s gotten ahead of itself in the past couple days, by moving ahead of the trend channel.  This has occurred with decreasing buy volume, indicating the big fellas are easing off a bit.  Again, considering the strength of this run, there is a good chance that the Nasdaq will undergo a minor drop to the first level of support around the bottom of the channel (approx 2300).

The S&P won’t face any significant resistance until it tackles all time highs above 1500, but it too has gotten ahead of itself in the past couple days while volume continues to subside.  Look at the bottom of the channel in the 1345  range as a potential area of support.

Dow to Record High. Now What?

Don’t mind me I’m just sorting out my thoughts about this current market and how best to play it.  Getting my thoughts down in virtual ink helps put it all in perspective.  Feel free to share your own thoughts!

Once again the market avoided a third consecutive day of declines.  You have to go back to early August to find the last time the market declined for 3 consecutive days.  On August 8th and 9th the market finished the day down to mark the 3rd and 4th consecutive days down.  That is only time that has happened since this rally began on July 18th.  No doubt a fantastic run which has culminated in a record high for the Dow today. 

Admittedly, it’s difficult to come up with a good strategy up here.  Clearly, we are overdue for some significant consolidation and it concerns me that it took a big drop in commodities to propel the market today.  With a soft landing continuing to be priced into this market and oil and commodities feeling out a bottom (which should happen sooner rather than later), just what is going to propel this market higher?  You guessed it – earnings.  Would I be willing to bet the farm that earnings guidance this quarter (for future quarters) is going to be beyond expectations?  Heck no!

On the bullish side, there is one big X factor in play here and that’s retail speculation.  At what point does Uncle Larry take notice that the Dow has made new highs and puts some of that savings to work in the next "Google".  At what point do all those real estate speculators start speculating in stocks and out of work real estate agents become stockbrokers?  Will it happen?  You would see it in the trading numbers out of Etrade, Ameritrade, Charles Schwab, etc.  but it may be most apparent at cocktail party small talk.  When the conversations shift from real estate talk to stock talk you’ll know.  What are you hearing?

All in all I still feel it’s a gamble playing big on the long side up at these levels, but at the same time it doesn’t pay to fight the tape.  I’ll continue to play the long side but choose new long entries with lower risk (ie. initiating positions in high quality stocks with considerable momentum and near major support levels) and maintain a decent cash position with a smattering of shorts).  I’m always comforted by the fact that as an individual investor I can reposition quickly and avoid large losses.  Something large funds can not do (ahemm… Amaranth).

Where’s the Big Stock Market Money Flowing? A Look at My System For Tracking Sector/Industry Rotation

Finding Industry Groups Leading the Market

One of the keys to lasting investing success is pinpointing the leading stocks of leading industries. That is where the big big money will be made.  The sooner you can spot these trends the better, but to go about doing this?  To be sure there are many ways to track the market but I though it might be useful to share an in depth look at how I go about tracking industry/sector strength. I basically use a hybrid approach of pure price movement performance of industries over 10, 20 and 30 days as well as an analysis of exchange traded funds (better known as ETF’s) which also allows me to see the volume movements as well.

Price Performance

In the premium members area I display a list of the top 20 performing industries over 10, 20 and 30 day time frames in order to track those industries that are moving based purely on price performance alone.  Here is a screenshot of the list found in the Top Industries area of the members section:
Rank 10 Day Performance 20 Day Performance 30 Day Performance
1

Electronics Stores (0)

Catalog & Mail Order Houses (1)

Catalog & Mail Order Houses (1)

2

Home Furnishings & Fixtures (0)

Semiconductor – Memory Chips (0)

Semiconductor – Memory Chips (0)

3

Processing Systems & Products (0)

Major Airlines (0)

Networking & Communication Dev (0)

4

Investment Brokerage (12)

Processing Systems & Products (0)

Office Supplies (0)

5

Residential Construction (0)

Electronics Stores (0)

Processing Systems & Products (0)

6

Pollution & Treatment Controls (1)

Semiconductor – Broadline (2)

Internet Software & Services (7)

7

Appliances (0)

Appliances (0)

Semiconductor – Integrated Circuit (3)

8

Apparel Stores (3)

Food Wholesale (0)

Semiconductor – Broadline (2)

9

Catalog & Mail Order Houses (1)

Toys & Games (0)

Internet Service Providers (2)

10

Recreational Goods – Other (0)

Internet Service Providers (2)

Semiconductor Equipment & Materials (1)

11

Food Wholesale (0)

Auto Parts Stores (1)

Sporting Good Stores (1)

12

Major Airlines (0)

Residential Construction (0)

Drugs – Generic (0)

13

Apparel Footwear (2)

Recreational Goods – Other (0)

Food Wholesale (0)

14

Internet Service Providers (2)

Home Health Care (0)

Printed Circuit Boards (1)

15

Department Stores (1)

Lodging (0)

Department Stores (1)

16

Sporting Good Stores (1)

Specialty Eateries (0)

Semiconductor – Specialized (2)

17

Dairy Products (0)

Apparel Footwear (2)

Electronics Stores (0)

18

Industrial Equipment Wholesale (1)

Department Stores (1)

Application Software (3)

19

Movie Production – Theaters (0)

Networking & Communication Dev (0)

Diversified Computer Systems (0)

20

Home Improvement Stores (0)

Broadcasting – Radio (0)

Apparel Stores (3)

Important Note: Industries in bold with a number next to them indicate that there are stocks in the SelfInvestors Breakout Tracker from that industry.  The number indicates how many.  Stocks in the Breakout Tracker are the fastest growing companies in the world that are near a breakout from a base or they have already broken out from a base..  These companies are the leaders of their industry.  So this table provides a great way to find leading stocks of leading industries in just minutes each day.  Very powerful indeed! 

When I’m scanning this list, I’m looking for two things in particular – an overall theme and industries with lots of leaders.   By theme I mean  broader sector such as technology, medical, commodities or financial.  What is the theme for this market currently?  Well, it’s certainly not oil anymore!   For the past couple years this top performing industries list was dominated by oil related industries, metals and heavy machinery.  It was a commodity boom.  A couple of months ago the commodity related industries slowly started disappearing from this list until eventually there were none.  What I began to see was were more technology related names popping up.. something that had not been happening for a long time.  It prompted me to bring it to the attention of my subscribers on August 20th, 2006 in the Weekly Market Report.

August 20th 2006
"The market has a way of pulling off surprises and a surprise is exactly what we got last week as inflation came in much cooler than expected which contributed to 5 straight days of market gains.  Taking a look back, two big themes come to mind.  First and foremost has been the lack of buy volume during the 2 days of big rallies.. it’s something I mentioned on a few occasions in the MidDay Market Updates last week.  It looks like institutions are being very cautious here and rightly so.  One good economic number doesn’t make a trend and by jumping in prematurely can be a recipe for disaster (remember, institutions can’t unload positions quickly like the small investor).  The second big theme of the week was the shift of money from commodities to tech.  Many tech companies began to emerge from the dead last week and may prove to be the backbone of any new rally.  Pay close attention to technology shares in the coming weeks.  It’s still too early to start seeing a barrage of high quality tech breakouts, but in a few weeks this may be where the big money is made.  As far as economic numbers go, it’s going to be a light week but Iran’s formal response to the nuclear incentives package may be a market mover on Tuesday.  I’d expect to see the market digest recent gains and possibly retrace the entire move.  Look for decreasing selling volume on down days as a sign that the market continues to get more bullish."

In order to find out where the big money is flowing I prefer to look at the 20 day time frame first and then branch out to the 10 and 30 day time frames to confirm.  The 10 day is a bit short and may just indicate an oversold bounce while the 30 day may be a bit long and you may have missed the bulk of the move.  So, the 20 day provides a nice starting point, then I can look at the 10 and 30 day performance to see if it’s performing well on those time frames too.  If it is, even more reason to focus your attention on that particular industry/sector. 

So in this example, looking at the 20 day performance I’m not seeing a dominant theme such as mostly retail or mostly technology, but there are areas of strength worth noting.  Since nothing is really jumping out at me on the 20 day timeframe as far as an overall theme, I’ll scan the 10 and 30 day timeframes as well to help put together an idea of where money is flowing right now.  Here are some notes I would be taking:

  • There are two semis industries in the top 6 of the 20 day time frame – Memory Chips & Broadline.  What really jumps out is that several semiconductor industries appear in the top performances over the past 30 days as well – Memory Chips, Integrated Circuit, Broadline, Equipment & Materials and Specialized.  Clearly, semis are showing considerable strength, so I’d be looking for the leaders in this industry and putting money to work at some point.  However, considering that many appear in the 30 day performance, may need to pull back some.  The trend may be a bit overdone in the short term.
  • There are quite a few retail, consumer related industries in the table.  With commodity prices plunging, rate hikes on hold and evidence of a soft landing in the economy, the market probably feels that the housing downturn won’t destroy consumer purchasing power too much.  In the Top 20 column I see Catalog & Mail Order Houses, Appliances, Toys & Games, Auto Parts Stores, Recreational Goods, Specialty Eateries, Apparel Footwear and Department Stores.  This trend also appears on the 10 and 30 day time scales as well. 
  • Housing Related stocks are coming back.  It’s very early in the trend, but housing is emerging as a sector of strength with Residential Construction making an appearance at position 12 in the 20 day time frame for the first time in probably a year.  Notice in the 10 day time frame that Home Furnishing & Fixtures (2), Residential Construction (5) and Home Improvement Stores (20) appear.  With 2 consecutive pauses in rate hikes, the market is putting some money to work in this sector.  However, considering past leaders rarely lead a new market rally, this run is probably an oversold bounce and not sustainable over the long term.
  • The Investment Brokerage industry contains 12 leading stocks that are near a breakout or have already broken out!  It’s number 4 in the 10 day performance table but doesn’t appear anywhere else, so it’s an emerging trend that may be too early to jump into, but absolutely worth looking at.  I’ll go ahead and do that now and see that it  may not be too early to nibble a bit in this industry.  The top rated stock in this industry is Blackrock (BLK) and it already broke out on September 13th and is pulling back into a buyable range.  A couple others worth taking a look at include Knight Capital (NITE), TradeStation (TRAD) and Charles Schwab (SCHW).  I’ll put these in a watch list and look for a good entry.

So in summary, based on the performance tables I’d be focusing on technology (particularly semis) and retail in my overall strategy for initiating long positions and nibble a bit in the leading brokerages.

Using ETF Analysis to Gauge Leading/Lagging Industries

Using pure price performance can no doubt be valuable as we’ve seen by the amount of information that can be gleaned from the simple table above.  However, pure price performance doesn’t quite give the whole picture.  Without studying the volume behind those price moves, we have no idea how much momentum is behind the move. This is extremely important because the amount of volume behind a price move validates the move in that an unusually large number of traders are willing to pay increasingly higher prices.   

So how can we study the volume moves in an industry?  Through the analysis of Exchange Traded Funds (ETFs) which trade like individual stocks and provide volume data throughout the day.  Unless you are brand new to the investing world, you have no doubt seen the explosive popularity of this type of investment vehicle.  Simply put, an ETF is like a mutual fund that can be traded on the open market throughout the trading day.  By tracking the price AND  trading volume movements of ETF’s that seek to emulate an industry or sector, I can get a decent picture of just where in the market the big money is flowing to.  There wasn’t enough trading volume in these instruments for an accurate analysis just a couple years ago, but now they provide a good representation of the health of industries and sectors.  By using a fairly simple formula (which I call the Demand Indicator) that awards points for high volume buying and low volume selling and subtracts points for high volume selling and low volume buying, I’m able to see where the money is flowing.  Here at SelfInvestors.com I track this demand over 15 and 30 days which I believe provides a good time frame for tracking trends.

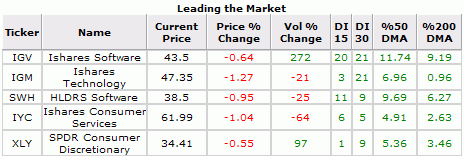
The screenshot below shows a portion of the Market Snapshot page (which will soon be available to all members of SelfInvestors.com) which shows the top 5 leading industries according to demand (measured through price and volume) over 15 and 30 days.  Industries are ordered by the combined DI score over 15 AND 30 days (the higher the scores, the greater the demand).  The table also shows the price % change and the volume % change from the average for today as well as the % from the 50 and 200 day moving averages.  The table confirms what we saw in the price performances table above in that technology and consumer related industries are leading this market higher.  While retail isn’t shown here, I have a suspicion that it’s ranked 6 or 7 (it has appeared on this list at times in the last couple weeks).   

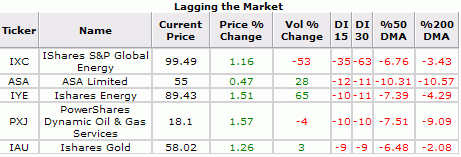
While this article focuses on finding industry strength for investing long in a bullish market, the lagging industries section provides a look at industries traders are dumping en masse which may provide fertile ground for short opportunities.  Here’s a screenshot showing the lagging industries on September 21st:

Not much surprise here.  The oil and gold industries have been getting crushed and those industries have appeared in the lagging industries section long before the meltdown actually began.  Yes, price and volume movements are a leading indicator!  Notice the DI scores for the Ishares Global Energy.  Typically, the DI scores will range between -20 and +20 so there is some mighty heavy selling going on.  Granted it’s a thinly traded fund so is prone to more wild movements, but still a good indicator of the amount of money pouring out of oil stocks recently.  It should be noted that here are strong technical support levels on the horizon and you have to believe that OPEC will step in at some point and do all it can to halt the plunge.

So there you have it.. my characteristically wordy (not in a nutshell) explanation of how I go about tracking industry and sector rotation.  This is a process I’ve been honing for awhile now and believe it’s important for all traders to have their own "process" for researching the markets, but hopefully you can take away some ideas and hone your own for an even better tracking method 🙂

Dow and S&P Have Momentum to Blow Through Highs

As expected today, the Fed left rates alone following a series of economic data points indicating a soft landing ahead (but with a deteriorating housing market).  The real story of the day and yesterday has been the resiliency of this market.  A sales warning from Yahoo and a Thai coup couldn’t derail the market yesterday.  Today, while initially "selling the news" following the Fed announcement, traders stepped in near the close to propel the market to near intraday highs.  In fact, trading volume rose to levels above yesterday indicating the big fellas putting some more money to work.  Bullish action indeed. 

Looks like traders are continuing to cheer plummeting crude prices and strong earnings.  Today, oil plunged again, briefly slipping below support around 60/barrel after the energy department reported a larger than expected build in weekly distillate supplies to their highest levels since January 99.  In the earnings arena, Oracle made headlines with its blowout numbers which provided another catalyst for the continued flow of cash out of commodities and into tech.

I would expect the Dow to touch all time highs tomorrow and the S&P to clear multi year highs on an intraday basis.  However, the key as always, is how the market finishes.  If we can get a surge tomorrow and hold above these highs, we could be in for a big time end of year rally.  We shall see.

Breakout Stock Highlights (9.1.06 – 9.15.06) Comtech Group (COGO), International Securities Exchange (ISE), GOL Intelligent Airlines (GOL) & Perficient (PRFT)

It’s time again for another rousing rendition of the breakout stock highlights report… and it’s a good one so hold on to your britches.  Ok, well maybe not that good.  There are many high quality breakouts over the past few weeks and I’ll highlight just a few in this report but that doesn’t mean it’s time to bet the farm on these plays.  I’m still advocating a cautious approach up at these levels especially considering we have important data and announcements coming up tomorrow morning (inflation PPI, housing starts) and Wednesday (rate decision).  That said, here’s the breakdown of the past couple weeks. 

In the two week period there were a total of 37 breakouts tracked in my database (actually 3 are  included in the top rankings but not shown in the screenshot I’ve provided for you below because they were added or their pivot points adjusted after the screenshot was taken).  These 3 are highly rated and worth looking into further – Highland Hospitality (HIH), currently the highest rated stock in the database with a score of 55 out of 60; BlackRock (BLK) and MEMC Electronic Materials (WFR) both with overall ranking of 52 out of 60.  All three are outstanding companies with nice looking charts.

Got off track there a bit.. back to the data.  Of the 37 breakouts, 25 have finished the period with a gain, 7 with a loss and 5 with no gain.  All in all, a very successful couple of weeks for breakouts.  Only 2 stocks finished the period with a loss greater than 8% – Agnico Eagle Mines (AEM) and Himax Technologies (HIMX).  Himax Technologies (HIMX) however, continues to hold up well and could still stage another breakout.  The big winner and one of the top breakout stocks in the database for several weeks now is US Global Investors (GROW) with a whopping 29% return following its breakout on September 1st.

:::::>  As always, here’s a screenshot of the database that shows some of the top breakouts

I’d like to highlight a few of the charts of top breakout stocks showing good technical action and not too extended from a proper buy range.  Starting it off is Comtech Group (COGO) which first broke out on September 11th with very good volume above 12.90.  Notice the dry up in volume at the bottom of the base, the surge in the right side, followed by another dry up in the handle, followed by another surge in buy volume at the breakout.. all classic signs of building demand for a stock.  The action of the past 3 days however have been slightly negative and probably indicate the stock needs some time to consolidate recent gains.

Next up is International Securities Exchange (ISE) which has benefited from a surge in the brokers/exchanges group.  I have this company as the highest rated in this industry and although its carved out a somewhat steep base (correcting around 40%), the positives can’t be ignored.  The stock showed good institutional support at its 200 day moving average on 3 occasions this summer and it’s beginning to show good demand.  I’d probably want to see it confirm it’s breakout by getting above today’s high with volume at least 50% greater than average.  However, another lower volume decline to around 44 may offer a better entry.  Should the stock test its all time highs, I’d be tempted to lock in some profit given the severity of the correction.  That’s just me though.  I’m never disappointed in taking a profit too early.. unless of course I’m referring to TASR a couple of years ago when I locked in a quick 50% gain only to watch the stock get away from me.. and uh.. yeah I’d rather not talk about that one.

Over the past few weeks maybe you’ve noticed the parabolic move in Copa Holdings (CPA), the Panamanian airliner that’s risen 50% in just the last month alone.  The growth in this airliner, capitalizing on the Panama boom is mighty impressive, but the growth in GOL Intelligent (GOL) airlines, the Brazilian airliner is staggering.  Its earnings growth has been nearly doubling in each of the past few years and isn’t yet showing any signs of slowing down.  Looking at the chart, you see a good bounce off the 200 day moving average while carving out the second leg down of its somewhat asymmetrical double bottom base.  This is the first time its touched the moving average in almost a year.  It bounced off that area back in October 2005 as well as April 2005.  So, the uptrend marches on with a recent breakout above the middle peak in the W shaped base above 36.50.  The stock has stalled a bit, but has some support around 35.. certainly worth watching.  It’s the highest rated airliner in the database.

Last, but not least is a favorite of mine – Perficient Systems (PRFT).  A small, fast growing company off the radar of most investors with an outstanding looking chart.  After carving out a bullish looking shallow base, it broke out to multi year highs with a very good pick up in trading volume.  Its been consolidating those recent gains and still looks outstanding.  Something I’ve discussed in these reports many times before is the how a stock offers multiple entries.  The first entry was provided on a breakout above the short handle with near record volume on September 8th.  The stock provided a second entry point the very next day as it took out multi year highs above 14.47.  Now the stock is offering yet another chance as it pulls back to what should be a strong area of support around 14. 

Note: For purposes of full disclosure I do currently have long positions in PRFT and WFR.