Category Archives: Blog

Anatomy Of A Market Meltdown; Potential Head & Shoulders Pattern

The analogy I had been using over the past few months to describe the action in the market to my members is that of a majestic skyscraper, each story beautifully built, higher and higher to the heavens. Just one problem.. they skimped on the foundation.  So, as the glorious skyscraper neared the heavens, the foundation began to crack, piece by piece by piece with each passing day.   As dignitaries and VIPs arrived to celebrate the completion of this majestic masterpiece with a ribbon cutting in Ben’s Liquidity Lounge, it tilted ever so slightly.  It was barely noticeable, but those that did, chalked it up to thin air and one too many trips to the punch bowl.

The charts never lie.  As the rally continued to soar to epic heights, the charts began to reveal the warning signs well ahead of the crash.  Granted, this has been a historic, Fed fueled, artificial rally where minor topping patterns failed again and again as the market pushed higher and higher with considerably less conviction.  That began to change in January, when institutions began to unload positions which was revealed in the heavy volume on the sell side.  I have to admit, I thought there was a very good chance of topping in February following the January plunge, but was forced to abandon the plan to get aggressively short on March 4th.

I sent the following note to members:

Continue reading Anatomy Of A Market Meltdown; Potential Head & Shoulders Pattern

The Rally Is Rolling Over, Test of 50 Day Moving Averages Likely

I’ll keep it brief and to the point in this shortened Memorial Day weekend edition of the weekly market review/preview.  The market appears ready to roll over with the indices possibly confirming a double top formation in the coming days.  Take a look at the Nasdaq and S&P, both of which nearly retested the May highs before selling off and taking out the 20 day moving averages (the first time the S&P has traded below the 20 dma two consecutive days since the rally began in March).  If in fact the indices take out the May lows (and it looks like they will), that would confirm a double top formation and a likely test of the 50 day moving averages (in blue).

On Wednesday night I made the following comments to my members:

“Today’s high may have marked the top…

After Monday’s big move and the way the gains were held Tuesday, I
commented to Gold members last night that a move to the 200 day
moving averages in the S&P (around 940) and Dow (around 8800) is
becoming more likely. We may not get that far.  While the market
staged a decent rally in the morning today, that rally completely
fell apart following the Fed minutes.  It may have had something to
do with the Fed waking up to reality and revising their estimates for
GDP and unemployment downward. 

Continue reading The Rally Is Rolling Over, Test of 50 Day Moving Averages Likely

Rally Shows a 2nd Crack, S&P Has Trouble At 875 But Bulls Remains In Control

Everyone wants to know.. how long can the rally last.  It’s the same question that was being asked on the other side just one month ago.  How low can we go and for how long?  The market always seems to remain irrational longer than you think it will and that has certainly played out over the first quarter here in 2009.  To help answer these questions, I always turn to the charts to gauge areas of support/resistance as well institutional demand.  Admittedly, technical analysis has been considerably difficult in an environment of rumors, manipulation, intervention and extreme levels of fear and greed, but what it does and will always do well is provide an x-ray into the health or weakness of the market.  In general, slices through support and weakness at resistance indicates a deteriorating market while surges above resistance and at support indicate good market strength.

Market strength has certainly been on display over the past 6 weeks with 6 straight up weeks.  Strength was on display when the S&P easily moved above resistance at 750.  It was on display once again when the S&P moved quickly above resistance at 800 and again when it came back to find support at 800 and yet again when it took out the downward trend off the Oct and Jan highs around 840.  Now the S&P faces another test of its strength at 875 which is an area where it formed a double top in late January and early February.  Does the S&P have the kind of momentum now that it did back at 750 or 800? In a word – no.

Continue reading Rally Shows a 2nd Crack, S&P Has Trouble At 875 But Bulls Remains In Control

China’s Economy Still Robust, But Concerns Remain

china economy China’s economy remains very strong chugging along with 6.1% GDP growth in the 1st quarter, but dropped from the 6.8% growth in the 4th quarter 08.  It’s hard to believe that 6.1% is the weakest quarterly growth since quarterly numbers were tracked beginning in 1992.  It certainly indicates the staggering growth of China’s economy over the past decade. 

Credit Suisse analyst Dong Tao views the number positively, but cautioned that China isn’t out of woods as exports remain relatively weak.  Up to this point, the government’s stimulus to spur domestic demand and increasing investments in fixed assets has been been able to offset much of the weakness in exports to the US, Japan and Europe, but it will take a few more quarters to determine if they will be able to continue to do so.  Banks in China have already issued $670 billion in the 1st quarter which is more than 90% of the target for the entire year.

“The government’s rapid easing of credit and rollout of infrastructure projects has bolstered [fixed-asset investment], helping offset decreased investment by export manufacturers and property developers,” J.P. Morgan said

This Dead Cat Has Legs, But Big Resistance Looms

Well, the much anticipated relief rally finally arrived last week with the S&P vaulting more than 13% off oversold conditions.  The rally was a bit deceptive with no real spike in fear or capitulation accompanying the move, but remember that capitulation doesn’t necessarily need to occur to mark a bottom… and that’s not to say this is “THE” bottom.  There’s certainly a tremendous amount of overhead resistance to work through and this is nothing more than a short covering, bargain hunting rally until bulls can prove themselves by breaching key downtrend lines.  I’ll keep the commentary light this week and jump right into the charts..

Everyone wants to know.. is this the bottom? How long will the rally last?  I think the charts can provide some clues to that.  Taking a look at the magnitude of the initial rallies off the October and November lows reveals that the average gain was right around 20% with the rally in October rising 19% over 6 days and the November rally producing a quick 21.5% gain in just 5 days.  If we assume that this rally will be in the neighborhood of those moves and falter after popping 20%, that runs the S&P500 right into big resistance at 800.  So, it’s quite possible we see another quick 5 – 7% in the first half of next week.  Yeah, these bear market rallies are sharp and deceptive leaving many behind.  If you missed it, don’t sweat it!  Whatever you do, don’t chase these rallies.  Be patient and wait for a digestion of this sharp move up because it will come.

Taking a look at the technicals of the S&P shows the break of the Feb/March downtrend on Wednesday, followed by another big surge on Thursday that sent the S&P back above the November lows….

Continue reading This Dead Cat Has Legs, But Big Resistance Looms

Mr Market Gives Thumbs Down to Obama’s Big Goverment Budget, Dow Likely To Test 6500

I have to admit I was turning a bit optimistic there in the middle of the week when the market rallied on the Bernanke testimony, indicating the government wasn’t interested in wiping out Citi shareholders (although at $1.50 that’s essentially what’s happened) and that he was optimistic of a recovery in the economy within a year or so.  Ordinarily, I wouldn’t place much importance on a move following a comment from a Fed official, but given the oversold conditions I thought maybe, just maybe this market was poised for a short covering fueled, oversold, relief rally.  Let’s just say it didn’t pan out that way. 

While Obama continues to enjoy high approval ratings from the general public, on Wall St it’s been an entirely different story.  That’s not to say this administration is responsible for the entire additional 20% plunge in the indices, but clearly the cabinet IRS gaffes, the doom and gloom rhetoric, the questionable stimulus package and the budget proposal has left Wall St clinging to a crisis of confidence and wondering if we’ll ever get out of this mess.  You have to wonder as 401K’s continue to implode, how long those lofty approval ratings will last.  On Thursday morning, with the market looking strong and still poised to potentially breakout, the budget proposal was released, immediately sending the market into a tailspin that broke key long term support levels.  I sent the following to my members on Thursday night:

Continue reading Mr Market Gives Thumbs Down to Obama’s Big Goverment Budget, Dow Likely To Test 6500

Dry Bulk Shipping Stocks Breaking Out

A big move out of the dry bulk shipping stocks today with several breaking out of consolidations with heavy volume.  Excel Maritime (EXM) reclaimed support of its 50 day moving average in a big way.  The dry bulk shippers have been on a wild ride over the past year and a half, many plummeting 80 – 90%  from their peaks in late 2007.  Since late November, this group has been stabilizing along with the overall market, seeing a big wave of institutional buying back in early December, another wave of buying in early January and now the trend continues with a big surge in the past two days.

DryShips (DRYS) has been in the news of late, taking traders on a wild ride.  Last week the company was notified that it was in breach of its financial terms on a large chunk of debt and the company announced it would dump stock and cancel ship orders to preserve liquidity.  The stock plummeted more than 50% in just 3 trading days….

Continue reading Dry Bulk Shipping Stocks Breaking Out

Indices Break Out of October Downtrend, Showing Signs of Life Ahead of Election

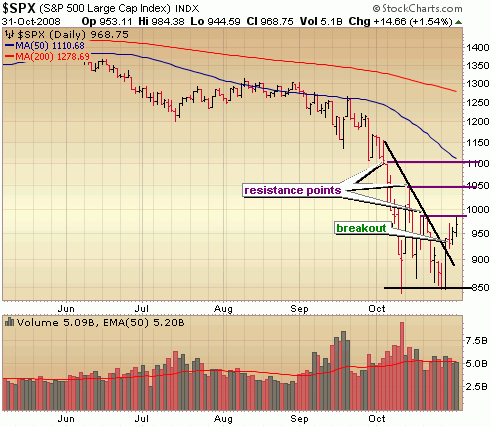
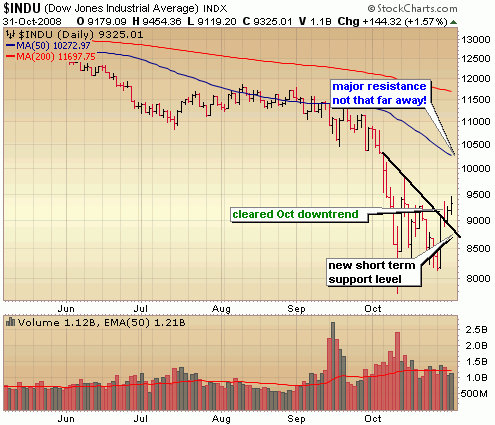
The indices finally began to show some signs of life last week with a firm break of the October downtrend.  While I have been increasingly bullish on this market, I did not expect the market to rally with such force as it did on Tuesday ahead of the GDP number, the Fed decision and the coming election. 

On Monday night I said to members:

To be completely cliche, I’m still cautiously optimistic on this market as sell volume continues to dry up following minor
capitulation days on October 10th and October 16th.  However, we must get going very soon with a big confirmation move up.  The longer the indices probe the October lows, the more likely they are going to plunge further.  The Nasdaq did close below the intraday low of the October 10 capitulation day today which is of concern but it may just find support at 1500 so keep an eye on that level tomorrow.  We certainly aren’t out of the woods for another significant move lower, so be careful out there.

We sure did get going!  The indices held the nearly 900 point move in the Dow on Tuesday and managed to tack on more gains throughout the week despite awful consumer sentiment numbers and a negative GDP (although better than expected).  Certainly the easing TED spread and Libor rates have helped stabilize this market and provided a foundation for a rally, but shrugging aside bad news and rallying  is certainly one important characteristic of a bottom.

Here are some points I made to my members on Thursday night regarding the current market:

– the character of this market appears to be changing ever so
slightly, becoming somewhat resilient in the face of bad news

– the indices have cleared the October downward trends, also bullish

– in the short term, the indices appear to be tiring a bit and may
need to take a bit of a rest heading into Tuesday election

– the Dow is ONLY 1100 points or so from major resistance of the 200
day moving moving average!  That kind of move nearly happened in one
day this week.

– (i’ll add this note here now) regarding the election, I’d imagine the only way the market rallies big the morning after the election is if McCain pulls out the upset victory.  On the flip side much of an Obama victory is probably already priced in so we could rally a bit just simply for the fact that the uncertainty of the election is over.  However, I think in either case, any rally would be relatively short lived considering the move we already had last week. 

Lets go ahead and take another look at the charts:

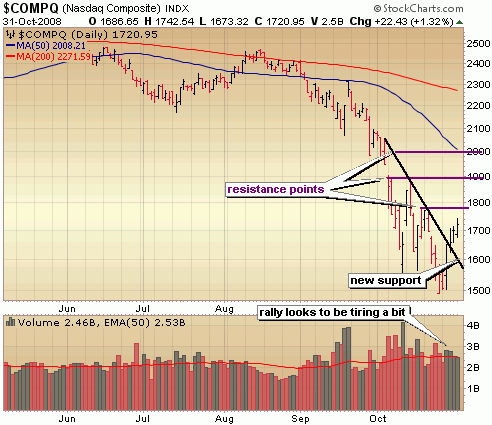
As you’ll see in all the charts below, the October downtrends have been taken out which is an important first step, but as you’ll also see we’ve come a bit too far too fast and volume diminished on the buy side as the week wore on.  It’s quite possible that soon we will need to digest the big ramp up that began on Tuesday, retracing as much as half the move and testing what is a new support area of the Oct downtrend line.. in this case around 1600 in the Nasdaq.  Note the overhead resistance points above around 1800, 1900 and 2000.  I do think its a bit late to be adding long positions right here.. wait for a pull back.  There will be plenty of opportunity, just wait for your price. 
11208_nasdaq

Same thing with the S&P.. technicals have improved but we’re getting overbought in the short term and need to come in some. 
11208_sp500

The Dow pushed above that October downtrend line as well and tacked on more gains heading into the weekend, but it does appear to be tiring and probably needs to come back and test new support at the trendline around 8700 or so.  Keep in mind – one more more big move like we had on Tuesday and the Dow is already at major resistance of the 200 dma around 10250.  It’s at that point that I exit and move almost entirely to cash again. 
11208_dow

I will continue adding long exposure on healthy pull backs from current levels.  This coming week is very important.  We need to hold this rally reasonably well with healthy, lighter volume pull backs, keeping the potential for an end of year really alive.  We are entering what is historically a good time of year for the market, so the bulls have some things working for them.. finally.

::: Model Portfolio :::

** This section will now appear as a separate report about every other Wednesday. 

The Self Investors Model Portfolio wrapped up 2006 with a gain of 27.6%, 2007 with a gain of 30.2% and is nearly 30% ahead of the S&P in a very difficult 2008.  This is a REAL portfolio with position sizing and features annualized returns of 24%.

Would you like to receive buy and sell alerts in the Model Portfolio within minutes (NEW! now get them via instant messaging in near real time) of each transaction?  You can receive these along with ALL of the tracking tools and video reports with the very popular Gold membership.  Don’t delay, get started today and join me for many more highly profitable months here at SelfInvestors.com.

::: Best/Worst Performers :::

– Top 10 Performing Industries For the Week –

1.Resorts & Casinos: 30.45%
2. Office Supplies: 25.80%
3. Gold: 25.00%
4. Agricultural Chemicals: 24.20%
5. Education & Training Services: 23.05%
6. Mortgage Investment: 19.55%
7. Residential Construction:  18.05%
8. Steel & Iron: 18.00%
9. Copper: 17.90%
10. Heavy Construction: 17.75%

– Top 10 Worst Performing Industries For the Week –

1. Health Care Plans: -11.55%
2. Meat Products: -7.90%
3. Research Services: -7.60%
4. Textile Manufacturing: -7.45%
5. Appliances: -6.50%
6. Internet Service Providers: -5.55%
7. Drugs Wholesale: -5.50%
8. Manufactured Housing: -4.75%
9. Air Services: -3.60%
10. Semis – Memory Chips: -3.05%

– Top 5 Best Performing ETFs For the Week –

1. Market Vectors Russia (RSX) 28.90% 
2. Market Vectors Gold Miners (GDX) 24.65%
3. iShares South Korea (EWY) 23.45% 
4. Mexico Fund (MXF) 23.30%
5. iShares South Africa (EZA) 21.70%

– Worst 5 Performing ETF’s –

1. Indonesia Fund (IF) -13.80%
2. US Oil Fund (USO) -4.60%
3. iShares Healthcare (IHF) -2.65%
4. China Fund (CHN) -2.60%
5. iShares Commodities (GSG) -2.15%

::: Upcoming Economic Reports (11/3/2008- 11/7/2008) :::

Monday:        Construction Spending, ISM Index
Tuesday:       Auto/Truck Sales, Factory Orders
Wednesday:  Crude Inventories, ISM Services
Thursday:      Productivity, Initial Claims
Friday:           Average Workweek, Hourly Earnings, Nonfarm Payrolls, Unemployment Rate, Wholesale Inventories

::: Earnings I’m Watching This Week :::

Monday: Atlas Energy Resources (ATN), Automatic Data Processing (ADP), Comstock Resources (CRK), Forest Oil (FST), Iconix Brands (ICON), Mastercard (MA), Open Text (OTEX), Sun Hydraulics (SUNH), Taleo Corp (TLEO), Transact Tech (TACT),

Tuesday: American Medical Systems (AMMD), Jacobs Engineering (JEC), Petroquest (PQ), W&T Offshore (WTI)

Wednesday: Clean Harbors (CLHB), Cisco (CSCO), Cognizant Technology (CTSH), Corinthian Colleges (COCO), Enersys (ENS), FTI Consulting (FCN), Gafisa (GFA), LMIA Aerospace (LMIA), Partner Communications (PTNR), Quicksilver Gas (KGS), Solera Holdings (SLH), T Three Energy Services (TTES), Transocean (RIG), Ultra Petroleum (UPL)

Thursday: AirMedia (AMCN), AthenaHealth (ATHN), Bancocolombia (CIB), Capella Education (CPLA), Carrizo Oil & Gas (CRZO), China Digital TV (STV), Continental Resources (CLR), Darling International (DAR), Exide Technologies (XIDE), Ezcorp (EZPW), Fuel Systems Solutions (FSYS), FMC Technologies (FTI), Genoptix (GXDX), Gulfport Energy (GPOR), Hansen Natural (HANS), Innerworkings (INWK), IPG Photonics (IPGP), Lumber Liquidators (LL), NIC Inc (EGOV), Priceline.com (PCLN), SandRidge Energy (SD), Nasdaq Group (NDAQ), True Religion (TRLG)

Snap Back Rally?; A Few Bullish ETF Trends – Gold, Nuclear, Agriculture, Japan & More

I took a look at the major indices in detail a few days ago, so in this weekly report I’ll take a look at the latest trends in ETF’s to get an idea of where money is being put to work in this challenging market.  As for the overall market, the odds are increasing for a major snapback rally of 3 – 5% before I believe bears resume control.  In my opinion, being aggressively short down here is a mistake with cash being the best option, while taking advantage of a snap back rally with aggressive day/swing trades on the long side using leveraged ETFs such as DDM, SSO or QLD.  The Dow is reaching oversold levels not seen since the January plunge, so could be the biggest beneficiary of a snap back rally.

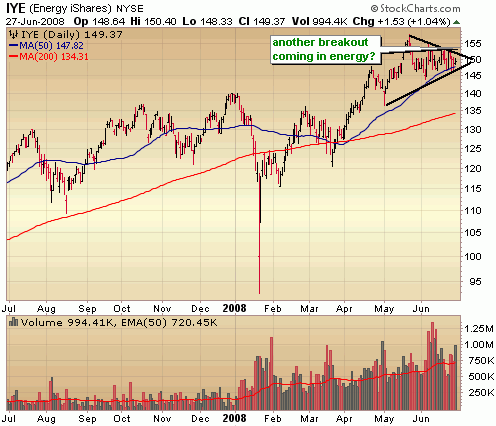
The bull run in energy continues unabated for the time being with the Energy Ishares ETF (IYE) carving out a bullish triangle formation on the daily chart.  A breakout from this formation could signal another upside move in energy stocks.  The US Oil Fund ETF (USO) broke out of a short consolidation last Thursday… so no bearish indications in the oil charts just yet.  However, I continue to hold my Ultra Short Oil & Gas ETF (DUG) for the time being.  It needs to break out above the 50 day moving average and soon.. the longer oil holds up without a significant correction, the greater the likelihood oil will continue pushing higher. 

62908_iye

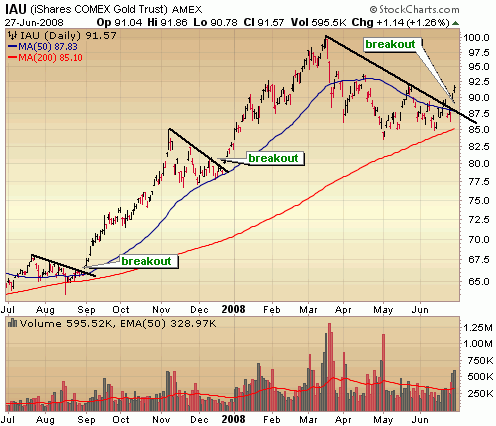
Gold as a long play was discussed here several days ago and it continues to be a top performer.  The iShares Gold Trust ETF (IAU) broke out of a downtrend and looks poised to test all time highs around 100 within the next few months.  If you missed out, be patient.. it should pull back and offer a better entry.  I have been playing gold with the Double Long ETN (DGP) and my top individual play is Yamana Gold (AUY)

62908_iaugold

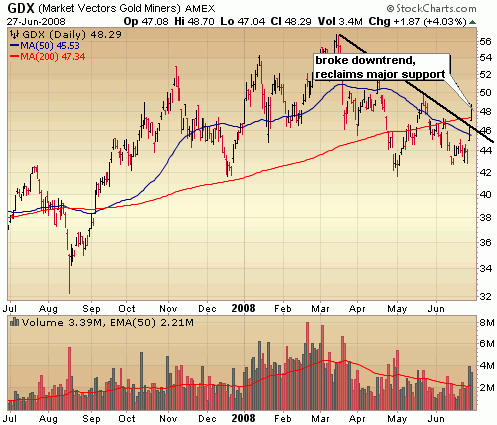
No surprise that the Gold Mining group broke out as well.  Bucyrus Intl (BUCY) is the play here and still looks quite bullish despite already doubling this year.

62908_goldminersgdx

I’ve liked the Market Vectors Nuclear Energy ETF (NLR) for some time now but have been patiently waiting for entry.  I still think we’ll see Uranium/Nuclear join the commodity party particularly if John McCain wins the presidency.  I just want to see price and volume surge a bit out of this handle formation in a double bottom base before initiating a position. 

62908_nlr

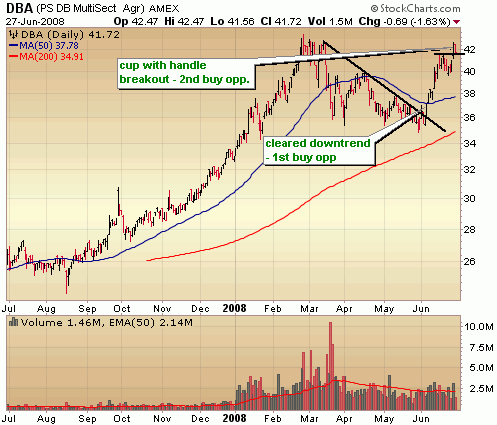
The PowerShares DB Agriculture ETF (DBA) was the hottest ETF in the last months of 07 and carved out a much needed base this year.  It broke out of the downtrend in early June offering an initial entry point, paused briefly for a handle formation and is breaking out again.  This is a fund that seeks a return based largely on the price of sugar, corn, soybeans and wheat.  Expect this fund to do well if Obama, who fully supports ethanol subsidies, wins the presidency.

62908_dba

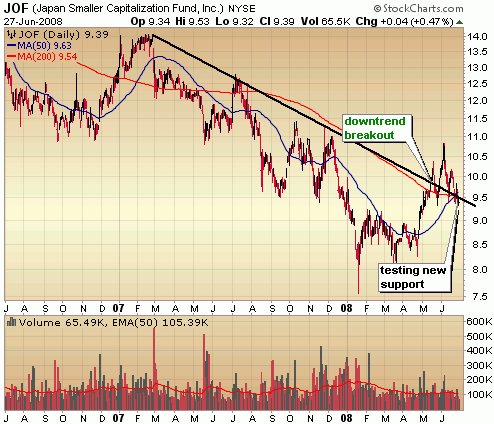
The Japan Small Cap ETF (JOF) looks mighty interesting down here for the patient investor.  It broke a more than one year downtrend in May and has been digesting those gains in a healthy manner, possibly setting up a decent entry as it tests new support.

62908_japanjof

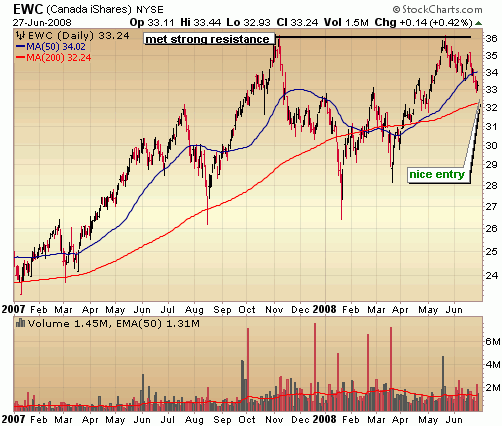
Oh Canada, the beneficiary of surging commodity demand without all the political risk.  The Canada iShares ETF (EWC) met strong resistance at 36 before digesting the big gains off the March lows.  I like the EWC off the 50 dma around 32.

62908_ewc

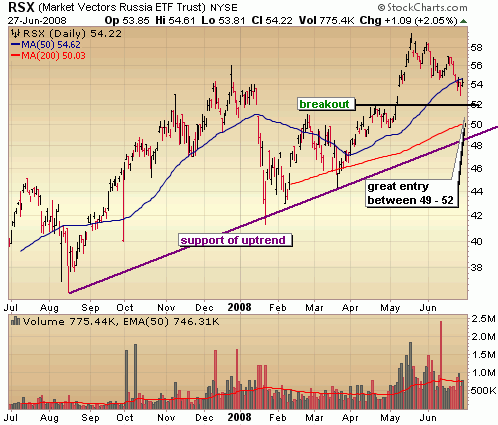
Russia is benefiting from surging oil demand BUT with major POLITICAL RISK.  Much more speculative than the Canada ETF, but with potentially more reward.  The area between 50 (support of upward trend) to 52 (where it broke out in May) is a big support area for the Market Vectors Russia ETF (RSX).  I’d consider a position in this area and hold it as long as it remains above the upward trend line in purple.

62908_rsxrussia

::: Model Portfolio :::

** This section will now appear as a separate report about every other Wednesday. 

The Self Investors Model Portolio wrapped up 2006 with a gain of 27.6%, 2007 with a gain of 30.2% and is more than 10% ahead of the S&P in a very difficult 2008.  This is a REAL portfolio with position sizing and features annualized returns of 24%.

Would you like to receive buy and sell alerts in the Model Portfolio within minutes (NEW! now get them via instant messaging in near real time) of each transaction?  You can receive these along with ALL of the tracking tools and video reports with the very popular Gold membership.  Don’t delay, get started today and join me for many more highly profitable months here at SelfInvestors.com.

::: Best/Worst Performers :::

– Top 10 Performing Industries For the Week –

1. Gold: 9.55%
2. Silver: 6.90%
3. Research Services: 3.25%
4. Oil & Gas Drilling & Exploration: 2.60%
5. Drugs Generic: 2.45%
6. Oil & Gas Equip & Services: 2.10%
7. Photographic Equip & Supplies:  2.10%
8. Drug Delivery: 1.45%
9. Hospitals: 1.40%
10. Computer Based Systems: 1.40%

– Top 10 Worst Performing Industries For the Week –

1. Semis – Memory Chips: -14.25%
2. Trucks & Other Vehicles: -13.35%
3. Surety & Title Insurance: -12.95%
4. Medical Practitioners: -11.65%
5. Mortgage Investment: -11.20%
6. Office Supplies: -10.50%
7. Major Airlines: -10.40%
8. Resorts & Casinos: -10.05%
9. Long Term Care Facilities: -9.20%
10. Sporting Activities: -9.20%

– Top 5 Best Performing ETFs For the Week –

1. Market Vectors Gold Miners (GDX) 10.15% 
2. Asa Gold (ASA) 9.85%
3. US Oil Fund (USO) 4.20%
4. PowerShares Agriculture (DBA) 4.05%
5. PowerShares Commodities (DBC) 3.95%

– Worst 5 Performing ETF’s –

1. iShares Sweden (EWD) -10.20%
2. iShares Belgium (EWK) -9.90%
3. India Fund (IFN) -8.80%
4. iPath India (INP)  -7.85%
5. PowerShares Clean Energy (PBW) -7.40%

::: Upcoming Economic Reports (6/30/2008- 7/4/2008) :::

Monday:        Chicago PMI
Tuesday:       Auto/Truck Sales, Construction Spending, ISM Index
Wednesday:  Crude Inventories, ADP Employment, Factory Orders
Thursday:      Initial Claims, Nonfarm Payrolls, Unemployment Rate, ISM Services 
Friday:           None – Holiday

::: Earnings I’m Watching This Week :::

None this week – earnings season won’t kick off in full force until mid July