Everyone wants to know.. how long can the rally last. It’s the same question that was being asked on the other side just one month ago. How low can we go and for how long? The market always seems to remain irrational longer than you think it will and that has certainly played out over the first quarter here in 2009. To help answer these questions, I always turn to the charts to gauge areas of support/resistance as well institutional demand. Admittedly, technical analysis has been considerably difficult in an environment of rumors, manipulation, intervention and extreme levels of fear and greed, but what it does and will always do well is provide an x-ray into the health or weakness of the market. In general, slices through support and weakness at resistance indicates a deteriorating market while surges above resistance and at support indicate good market strength.
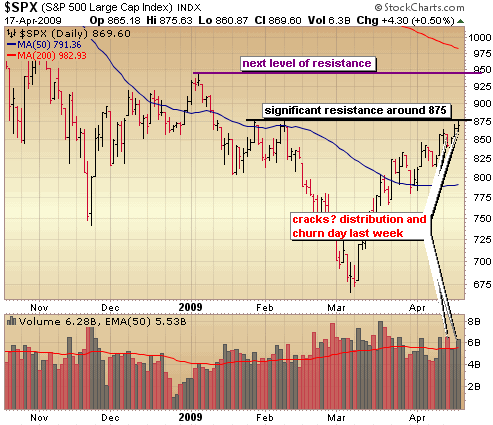
Market strength has certainly been on display over the past 6 weeks with 6 straight up weeks. Strength was on display when the S&P easily moved above resistance at 750. It was on display once again when the S&P moved quickly above resistance at 800 and again when it came back to find support at 800 and yet again when it took out the downward trend off the Oct and Jan highs around 840. Now the S&P faces another test of its strength at 875 which is an area where it formed a double top in late January and early February. Does the S&P have the kind of momentum now that it did back at 750 or 800? In a word – no.
I say this for a few reasons. One being the distribution day we had on Tuesday, then the two bounce back days with relatively light volume culminating in a near churn day on Friday. A churn day is when an index trades with significantly heavier volume than the day before with no progress in price. Ok, we did have options expiration which certainly accounts for some of the volume surge, so not a major churn day but certainly a day when the indices looked like they were tiring.
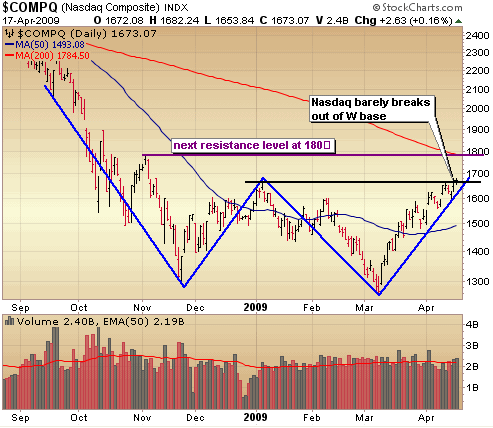
I won’t sit here and pretend this isn’t an incredibly tricky market to navigate up here. While the market does indeed look like it’s running out of steam there are some conflicting signals. You have the S&P looking like it will have a real tough time getting over and staying above 875 after the sharp V spike and “cracks” in the bulls armor last week, but on the other hand you have the Nasdaq breaking out above the Jan highs and holding that level to close the week. Technically, that is a breakout of a large double bottom base and considerably bullish for this market. Could this market vault another 5 – 10% to push it into the next level of resistance? Sure, anything is possible in this market. However, my strategy has always been to add long exposure on the pull backs. I added some long exposure when it appeared the indices were going to hold the 50 day moving averages, but the rally has largely been too swift for me to fully participate the way I would have liked. It’s disappointing, but I won’t abandon my strategy.
For next week, I want to see big sell volume come into this market with some key intraday support levels taken out, preferably in the first half of the week. If that does not happen and the bulls hold the line heading into the latter half of the week, it is possible we could get some kind of final flush to the upside in which I would trade very short term on the long side. IF another move of 5 – 10% takes place to finish this rally, in my opinion it would provide one of the finest areas to short this market since the top in May of 2008. Either way, once key intraday levels are taken out I will get considerably aggressive on the short side and look for a return to the 50 day moving averages (so a move down of about 10% from current levels).
Here are the charts of the S&P and Nasdaq.
Note the resistance at 875 which the S&P clearly had trouble with Friday. If we blow through that level too the odds greatly increase we test the next level around 950 but I don’t believe that happens without significant rest due to the distribution day on Tuesday and (almost) churn day Friday.
The Nasdaq nudged above the Jan highs at 1665 and held above to close the week, so technically a breakout from a large double bottom base which is considerably bullish. I know I said that kind of move would signal a new bull market for me, but I’m going to retreat from that statement a bit considering how it was done. IF we get an orderly pull back to around the 50 day moving average from here and institutions began to participate in a big way resulting in another break of the double bottom base (and probably by then a move above the 50 day moving average), THEN I will be ready to call it a new bull market. Like I said above, I suppose it’s possible this market blows the top off for one last finale with the Nasdaq touching near 1800, but I’d put the odds of that at 20 – 30%. I think at the very least we need to spend time sideways up here, but the market doesn’t care what I think. Bulls have the upper hand for now and if the cracks of last week don’t develop into gaping holes early this week, we could see one last stampede to the upside.
:::::::::::::::::::::::::::::::::::::::::::
Isn’t Time You Took Control of Your Financial Future?
The Self Investors Model Portfolio wrapped up 2006 with a gain of 27.6%, 2007 with a gain of 30.2%, finished nearly 35% ahead of the S&P in a very difficult 2008 and is off to a good start here in 2009, ahead of the S&P YTD performance by 5%. This is a REAL portfolio with position sizing and not based on extrapolated hypothetical gains for each trade. On average it beats the S&P by 20% per year. The result?
* Putting $100K into an S&P tracking index at the beginning of 2004 and you’re down more than $20K.
* The Self Investors Model in the same time period would have more than doubled your money. That’s the power of not buying and holding!
Would you like to receive buy and sell alerts in the Model Portfolio within minutes (NEW! now get them via instant messaging in near real time) of each transaction? You can receive these along with ALL of the tracking tools and video reports with the very popular Gold membership. Don’t delay, get started today and join me for many more highly profitable months here at SelfInvestors.com.
::: Best/Worst Performers :::
– Top 10 Performing Industries For the Week –
1. REIT – Hotel/Motel: 22.36%
2. Broadcasting – Radio: 22.10%
3. Hospitals: 19.15%
4. Banks – SE: 15.55%
5. Jewelry Stores: 13.35%
6. Banks – Mid Atlantic: 13.00%
7. Printed Circuit Boards: 11.30%
8. Residential Construction: 11.15%
9. Housewares & Accessories: 11.00%
10. Textile Manufacturing: 10.80%
– Top 10 Worst Performing Industries For the Week –
1. Home Health Care: -6.45%
2. Gold: -6.25%
3. Long Term Care Facilities: -4.80%
4. Silver: -3.80%
5. Surety & Title Insurance: -3.65%
6. Electronics Stores: -3.50%
7. Mortgage Investment: -3.20%
8. Appliances: -3.10%
9. Confectioners: -2.75%
10. Saving & Loans: -2.20%
– Top 5 Best Performing ETFs For the Week –
(excluding leveraged ETFs)
1. Herzfeld Caribbean Basin (CUBA) 30.30%
2. Indonesia Fund (KBE) 13.15%
3. Templeton Russia & E Europe (TRF) 12.70%
4. iShares Home Construction (ITB) 11.45%
5. SPDR Home Builders (XHB) 11.25%
– Worst 5 Performing ETF’s –
1. Market Vectors Gold Miners (GDX) -6.30%
2. HLDRS Internet Infrastructure (IIH) -4.65%
3. US Oil Fund (USO) -4.05%
4. iShares Silver (SLV) -4.05%
5. Central Fund of Canada (CEF) -3.30%
::: Upcoming Economic Reports (4/20/2009- 4/24/2009) :::
Monday: Leading Indicators
Tuesday: None
Wednesday: Crude Inventories
Thursday: Existing Home Sales, Initial Claims
Friday: Durable Orders, New Home Sales
::: Earnings I’m Watching This Week :::
Monday: Allegiant Travel (ALGT), Bank of America (BAC), Intl Biz Machines (IBM)
Tuesday: Ametek (AME), Capital One (COF), Caterpillar (CAT), Cree (CREE), Gilead Sciences (GILD), Hudson City Bank (HCBK), Johnson Controls (JCI), New Oriental Education (EDU), Terra Industries (TRA), Terra Nitrogen (TNH), US Bancorp (USB)
Wednesday: Altria (MO), Apple (AAPL), AsiaInfo (ASIA), Axys Technologies (AXYS), Core Laboratories (CLB), Ebay (EBAY), Epiq Systems (EPIQ), Freeport McMoran (FCX), Genzyme (GENZ), Morgan Stanley (MS), Wells Fargo (WFC)
Thursday: ABB (ABB), Amazon (AMZN), American Express (AXP), Bucyrus (BUCY), Computer Programs & Systems (CPSI), Credit Suisse (CS), CyberSource (CYBS), DeVry (DV), Diamond Offshore (DO), HDFC Bank (HDB), ITT Educational Services (ESI), MEMC Electronics (WFR), Netflix (NFLX), Omniture (OMTR), Potash (POT), Starent Networks (STAR), SunPower (SPWRA), United Parcel (UPS)
Friday: 3M (MMM), Ford (F)


Thanks Guys, this really is a great place to make home. So much info at your fingure tips. Like all the reporting and what up for the whole week. I am glad we as Self Investors, take the guess work out of it.
So here are my stocks for all to share and hopefully make money like I Have. We had a double bottom in March – April 09. These are the stocks I have:
SIRI, BZ, ETLY; KOG; LVS; PIR; CAR; HAZY. Hope these help. Look at the Small stuff too! God Bless! Denver