All posts by Tate Dwinnell

Stock Market Offers Another Chance To Lock In Gains

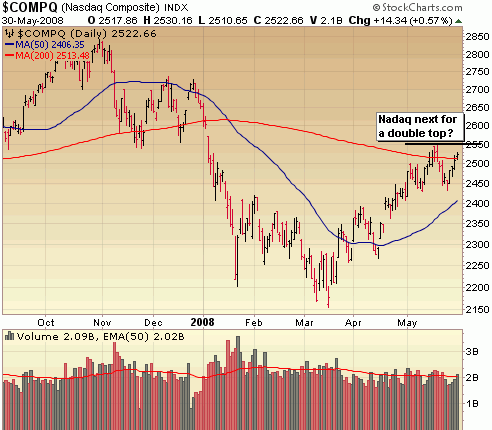
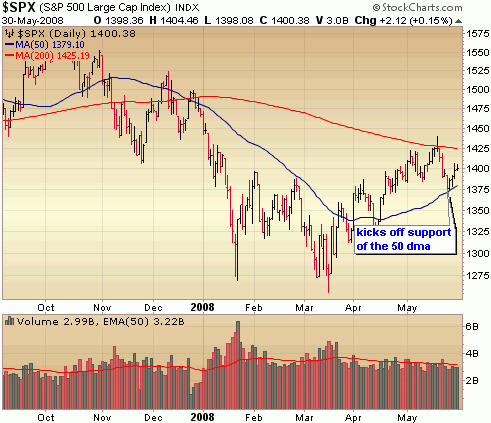
Lots of intraday swings in both the overall equities market and crude prices, with the end result at the end of the week being a small pull back in crude with a decent recovery in stock prices, following a dismal week of distribution.  With the S&P bouncing off the 50 day moving average and the Nasdaq reclaiming support of the 200 day moving average it’s time buy, buy, buy right?  Wrong!  I still believe we’re seeing some intermediate topping action in the indices and last week’s move up was just an oversold retracement of a bearish move.  If you didn’t lock in hard earned gains off that March bottom in mid May, now is your chance.  What if I’m wrong and the indices blow through their May highs with volume?  In the off chance that happens, then you just get back in with very little lost in potential on the long side.  Not much potential reward to give up for taking significant risk off the table in my opinion.

6108_nasdaq  

6108_sp500

6108_dow

::: Model Portfolio :::

** This section will now appear as a separate report about every other Wednesday. 

The Self Investors Model Portolio wrapped up 2007 with a 30.2% gain and features annualized returns of 24%.  Would you like to receive buy and sell alerts within minutes (NEW! now get them via instant messaging in near real time) of each transaction in the portfolio?  You can receive these along with ALL of the tracking tools and reports with the very popular Gold membership.  Don’t delay, get started today and join me for many more highly profitable months here at SelfInvestors.com.

::: Best/Worst Performers :::

– Top 10 Performing Industries For the Week –

1. Pollution & Treatment Controls: 8.10%
2. Personal Computers: 7.85%
3. Major Airlines: 7.60%
4. Consumer Services: 6.60%
5. General Contractors: 6.30%
6. Semiconductor – Integrated Circuit: 6.05%
7. Long Distance Carriers:  6.00%
8. Technical & System Software: 6.00%
9. Sporting Goods Stores: 5.45%
10. Textile – Apparel Clothing: 5.40%

– Top 10 Worst Performing Industries For the Week –

1. Gold: -4.80%
2. Banks – Mid Atlantic: -4.20%
3. Banks – SE: -4.10%
4. Cement: -4.05%
5. Silver: -4.05%
6. Tobacco Products: -4.00%
7. Dairy Products: -4.00%
8. Surety & Title Insurance: -3.75%
9. Industrial Metals & Minerals: -3.65%
10. Entertainment – Diversified: -3.20%

– Top 5 Best Performing ETFs For the Week –

1. Greater China Fund (GCH) 5.70% 
2. Turkish Invest (TKF) 5.60%
3. HLDRS Internet Architecture (IAH) 5.40%
4. Japan Small Cap (JOF) 5.20%
5. HLDRS Broadband (BDH) 4.65%

– Worst 5 Performing ETF’s –

1. iShares Silver (SLV) -6.25%
2. Thai Fund (TTf) -6.15%
3. Asa Limited Gold (ASA) -4.60%
4. Market Vectors Gold Miners (GDX)  -4.50%
5. iShares Gold (IAU) -3.90%

::: Upcoming Economic Reports (6/2/2008- 6/6/2008) :::

Monday:        Construction Spending, ISM Index
Tuesday:       Auto/Truck Sales, Factory Orders
Wednesday:  Productivity, ISM Services,  Crude Inventories
Thursday:      Initial Claims
Friday:           Nonfarm Payrolls, Unemployment Rate, Wholesale Inventories, Consumer Credit

::: Earnings I’m Watching This Week :::

Tuesday:
Layne Christensen (LAYN)

Wednesday:
Comtech Telecommunications (CMTL), Greif Brothers (GEF), Hovanian (HOV), Vimpel Comm (VIP)

Thursday:
Bio Reference Labs (BRLI), Ciena (CIEN), Focus Media (FMCN)

Friday:
A-Power Energy Generation Systems (APWR)

Small Caps Moving: Watch CTS Corp (CTS)

The following is exclusive content from The Correct Call provided to readers of SelfInvestors.com.  Enjoy!

::::::::::::::::::

Every week The Correct Call analyzes more than 500 sector, index and ETF charts looking for emerging up or down trends. Once we have a feel for the big picture, we can then look under the hood to discover the stocks that have the engine purring or squealing.

Small cap stocks look like they could outperform in the weeks and months ahead.

CTS Corporation (CTS) is a small cap stock we believe could provide investors with a eye-catching 20%+ return in the next 3-to-6 months.

CTS Corporation designs, manufactures and sells a broad line of electronic components and sensors and is a provider of electronics manufacturing solutions to the automotive, computer, communications markets, medical, defense & aerospace, and industrial markets

.

On April 29th, CTS reported earnings that exceeded Wall Street’s expectations by 20% and all 3 analysts who cover CTS have raised their estimates for the remainder of 08 and for all of 2009. Yet the stock price remains unchanged. The Correct Call sees this as an invitation to buy a growing company for a reasonable price.

    CTS trades at .52 its sales to earnings; meaning for every dollar CTS does in sales, their stock is worth 52 cents. The average company in their industry trades at 1.46 times sales.
    Based on the 2008 full year estimate of 81 cents per share, CTS is trading at a forward P/E of 11.56. At the industry average P/E of a hair under 16; CTS’ share price would approach $13.

Apparently this bargain has been recognized by the CTS’ management. Three insiders purchased shares in the open market within the last 2 weeks between $10.46 and $10.70 per share. The Correct Call loves insider buying as management rarely lies with their wallets.

CTS’ chart leads us to believe the next move should be up.

Suggested Stop: $10.22

Stock Watch Video – Longs, Shorts & ETFs

It’s time again for another video presentation for trade ideas on the long side, the short side as well as a few ETFs.

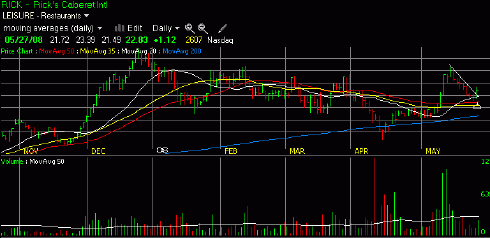
Longs: RICK, ANSS, BIDU, MORN, ACL, MATK, TDY
Shorts: URBN, NUE, MOS, SYT
ETFs: GCH, DUG, TKF, EWA, NLR, RSX, PIO, PBW, TAN

Note: Please view in Internet Explorer to avoid sound issues.  Please click the image to launch the video.

[swf src=”http://www.selfinvestors.com/premiumvideos/Stock Watch/movies/51909_stockwatch.swf” height=”350″ width=”550″ params=”play=false”][/swf]

[kml_flashembed publishmethod=”static” fversion=”8.0.0″ movie=”http://www.selfinvestors.com/premiumvideos/Stock Watch/movies/51909_stockwatch.swf” width=”525″ height=”375″ targetclass=”flashmovie” play=”false”]

[kml_flashembed publishmethod=”static” fversion=”8.0.0″ movie=”http://www.selfinvestors.com/premiumvideos/Stock Watch/movies/51909_stockwatch.swf” width=”400″ height=”300″ targetclass=”flashmovie” play=”false” menu=”true” quality=”best”]

Get Adobe Flash player

[/kml_flashembed]

Get Adobe Flash player

[/kml_flashembed]

Nasdaq and S&P500 to Test Key Support As GDP Approaches

THANK YOU TO ALL THE BRAVE MEN AND WOMEN WHO HAVE MADE GREAT SACRIFICES FOR THIS GREAT NATION.  WE SALUTE YOU NOT JUST ON THIS MEMORIAL DAY, BUT EVERY DAY.

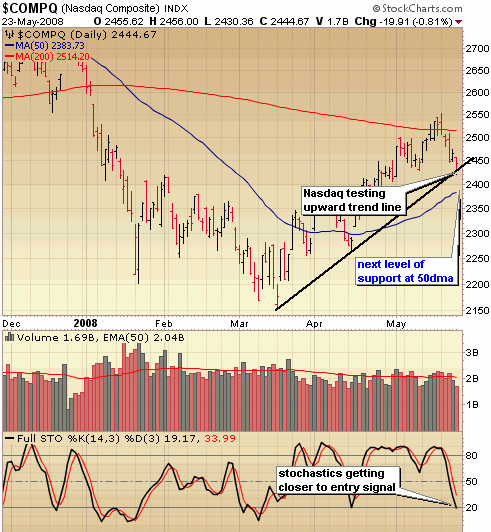
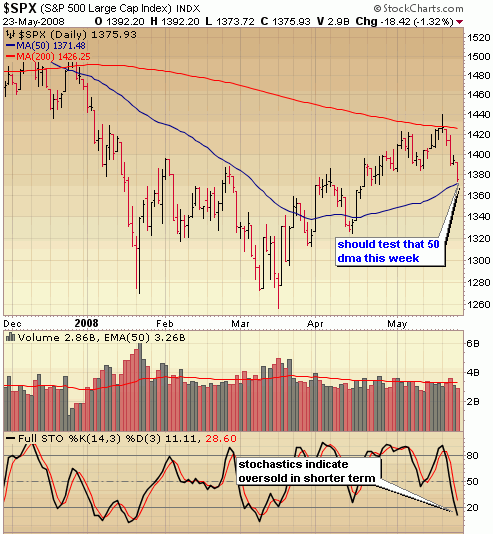
Last week we saw the indices take a much needed breather after an impressive run off those March lows and as expected the next level of key support levels are in the process of being tested – I’m referring to the upward trend line of the Nasdaq (see below) as well as the 50 day moving average of the S&P (see below).  At this point, the selling of last week doesn’t indicate anything other than significant profit taking and while there was distribution going on, I don’t think it’s enough at this point to completely derail the rally and take us back to the March lows.  What would be more of a concern is if the S&P and Nasdaq join the Dow in taking out their 50 day moving averages.  A breach of this area with high volume selling would in my opinion set us up for the possibility of a retest of those March lows.  We’ll just have to see how traders respond later in the week as they file in from a long weekend and ponder the GDP report on Thursday.  Taking a look at stochastics reveals the market is nearing oversold levels in the short term and likely due for some kind of bounce very soon.  I would not bite on that and get too aggressive too quickly.  I just think it’s really difficult to be aggressive on either side of the market right now and the best place to be is in cash. 

52608_naz

52608_sp500

::: Model Portfolio :::

** This section will now appear as a separate report about every other Wednesday. 

The Self Investors Model Portolio wrapped up 2007 with a 30.2% gain and features annualized returns of 24%.  Would you like to receive buy and sell alerts within minutes (NEW! now get them via instant messaging in near real time) of each transaction in the portfolio?  You can receive these along with ALL of the tracking tools and reports with the very popular Gold membership.  Don’t delay, get started today and join me for many more highly profitable months here at SelfInvestors.com.

::: Best/Worst Performers :::

– Top 10 Performing Industries For the Week –

1. Health Care Plans: 5.21%
2. Drugs – Generic: 3.10%
3. Medical Appliances & Equipment: 1.90%
4. Long Term Care Facilities: 1.40%
5. Oil & Gas Refining & Marketing: 1.30%
6. Home Health Care: .70%
7. Drug Related Products:  .55%
8. Music & Video Stores: .40%
9. Gold: .40%
10. Waste Management: .20%

– Top 10 Worst Performing Industries For the Week –

1. Major Airlines: -23.50%
2. Sporting Goods Stores: -12.40%
3. Residential Construction: -12.25%
4. Resorts & Casinos: -8.80%
5. Investment Brokerage – Regional: -8.70%
6. Semiconductor – Memory: -8.50%
7. Department Stores: -8.10%
8. Regional Airlines: -8.10%
9. Home Furnishing Stores: -8.10%
10. Surety & Title Insurance: -7.90%

– Top 5 Best Performing ETFs For the Week –

1. Ishares Silver (SLV)  7.60%
2. Market Vectors Nuclear Energy (NLR) 6.10%
3. US Natural Gas (UNG) 5.90%
4. United States Oil (USO) 4.60%
5. Central Fund of Canada (CEF) 4.00%

– Worst 5 Performing ETF’s –

1. SPDR Homebuilders (XHB) -12.60%
2. iShares Home Construction (ITB) -12.55%
3. Morgan Stanley China (CAF) -9.95%
4. Claymore China Real Estate (TAO)  -7.50%
5. iPath India (INP) -7.40%

:::  IPO’s Worth Watching for This Week :::

This section will now appear as a separate post on Mondays.

While 2008 should be a much slower year for IPO’s considering the deterioration of the market, there will continue to be some good companies coming to market here and there.  I’ll be highlighting the best IPO’s every Monday.

::: Upcoming Economic Reports (5/26/2008- 5/30/2008) :::

Monday:        None – Holiday
Tuesday:       Consumer Confidence, New Home Sales
Wednesday:  Durable Orders, Crude Inventories
Thursday:      GDP (prelim), Initial Claims
Friday:           Personal Income/Spending, PCE Core Inflation, Chicago PMI

::: Earnings I’m Watching This Week :::

Tuesday:
Donaldson (DCI), Shanda Interactive (SNDA), Wuxi Pharma Tech (WX)

Wednesday:
Jinpan (JST),  Synovis Life Technologies (SYNO), Esterline (ESL),

Thursday:
Caraco Pharmaceutical (CPD), Costco (COST), Netezza (NZ)

Friday:
China Finance Online (JRJC)

A Short Opportunity in Jack in the Box (JBX)?

The following is exclusive analysis from The Correct Call, provided to my readers here at SelfInvestors.com beginning today and provided on a weekly basis.  Hope you enjoy these weekly trade ideas.. your feedback is appreciated.

::::::::

With the Stock Market sinking on higher Oil prices, The Correct Call’s models are dangerously close to moving into sell territory. With that in mind, in our weekly review of ETF charts, we were on the lookout for short selling opportunities.

One such chart, PowerShares Food and Beverages (PBJ) looks like it’s starting to run a fever.

As you can see in the chart, PBJ’s price has moved below the 50 day moving average and the Short Term MACD has crossed below the longer term line- usually not good.

The Correct Call screened the holdings of PBJ in search of companies we can short with deteriorating fundamentals and a poor technical picture. One popped out to us.

Jack in the Box’s (JBX) short-term prospects favor the stock price moving lower.

    – In the company’s latest earnings call, management anticipates a 2% decrease in same store sales for the rest of this quarter JBX’s restaurants in California, Las Vegas and Phoenix have been impacted by the souring economy in those hard hit states.

    – Higher food and commodity costs are reducing JBX’s profit margins at a time when Jack might be forced to lower its prices to keep up with the very aggressive value menu pricing campaigns of their fast food peers.

    – Management recently offered inline earnings guidance for the remainder of 2008, but admitted much of their outlook is backend loaded. Any miscue in execution could lead to an earnings disappointment and a much lower stock price.

Analysis of JBX’s chart reveals a negative MACD crossover and double bottom around $23.25. If Jack’s price were to violate and close below that support line, the next stop should be in the $19-20 range.

Investors worried about potential big losses from shorting a stock, should consider buying put options. With put options, your risk is limited to the dollars invested. For JBX, aggressive investors should consider the September 25 Put Options. If we have made The Correct Call and Jack in the Box trades at $20 per share by August 1st, the September 25 Puts value would be worth around $5. A 67% increase from yesterday’s close of $3 per contract.

Tune Into the Charts, Tune Out the Talking Heads

How many times over the past couple weeks have you heard the so-called "experts" declare that now is a great time be adding stocks, despite the fact we had just run up more than 10% off a bottom created as a result of a severe correction.  Despite the fact that technical indicators were flashing overbought signals and most importantly, despite the fact that the character of the market was changing as traders looked for any nugget of bad news to lock in hard earned profits over the past couple months. 

As an independent self investor myself, part of what I try and do here at SelfInvestors.com is remind new traders that thinking for themselves is of utmost importance to successful trading.  By tuning out the talking heads and focusing on the technicals (price and volume, support and resistance, stochastics and MACD) of the major indices, it is possible to come very close to timing the market with great accuracy.  Will you always get in at the bottom and out at the top?  Absolutely not… but you can get a very good sense of when the market is beginning to turn.

I’ve talked a lot about the character change of this market recently and the slow shift to a more bearish tone.  All that was needed was a clear technical indication that a top was being put in.  The first technical red flag took place on Monday as the market reversed sharply off the lows.  In an email to my premium members I said:

"It’s been quite awhile since we’ve seen such a wild reversal
intraday and the action is somewhat significant.  I say somewhat
because although we had a dramatic end of day reversal in which the
S&P closed below important resistance of the 200 day moving average,
volume was not heavy.  Dramatic, high volume reversals indicate
topping action but this wasn’t quite the drama I was looking for to
indicate a top to this run and the Dow remains above the 200 day
moving average while the Nasdaq sits right on the mendoza line.  It
will be interesting to see if sellers can continue the momentum
tomorrow with more conviction. At any rate I still think this market
is tiring and caution is urged."

I was a bit hesitant in calling an absolute top to this run due to the lack of volume and wanted to see some continuation of the selling momentum the following day.  That’s exactly what we got which was confirmation that indeed we were topping.  Last night I sent the following to premium members:

"Following yesterday’s sharp end of day reversal in the major
indices, the market was primed and ready for a big, sustained move
down.  With inflation coming in a bit hot, a bearish outlook from an
Openheimer analyst of the banking sector and poor results out of Home
Depot and Target, today was the day that bears were finally able to
exert some strength.

I do think yesterday’s reversal and  today’s confirmation mark an
intermediary top.  It’s difficult to say just how far we pull back
at this point, but one thing is for certain -  remain extremely
cautious on the long side here.  I’ve finished production on a new
video review of the Model Portfolio and take a look at the major
indices as well…."

The selling didn’t let up at all today and the conviction on the sell side was considerably stronger than yesterday.  The Nasdaq and S&P appear to be well on their way to  testing the 50 day moving averages (an area where I might look to add a new long trade or two) and the Dow actually took out this important level of support today.  Given the magnitude of the selling over the past two days we’re probably due for a little bounce, but do not get sucked in.  This is significant technical damage over the past 2 days and will most likely lead to further deterioration in the coming days.

Let’s take a quick look at the charts:

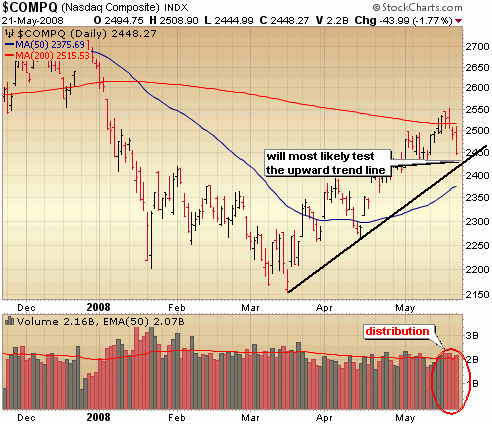
An ugly move in the Nasdaq today with a test of that upward trend line around 2425 almost certain.  If we take out that level of support, a test of the 50 day moving average becomes likely. 

52108_naz

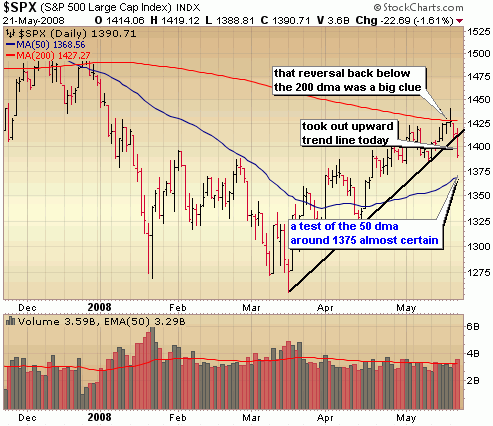
The S&P took out that upward trend line today with significant selling volume behind it.  The next major level of support around the 50 day moving average is  the next target.

52108_sp500

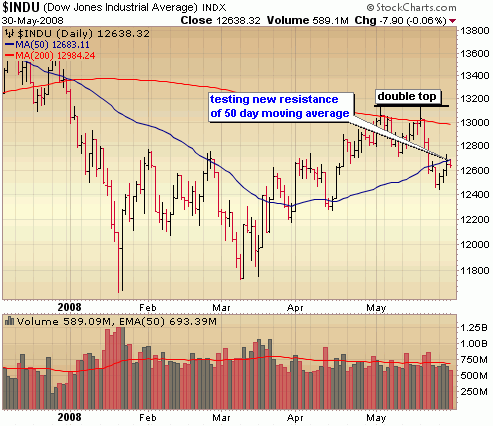
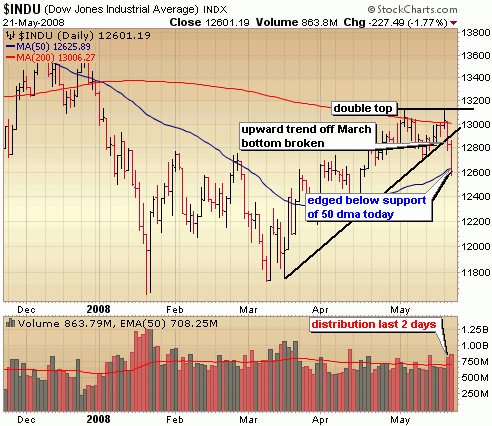
Note the double top in the Dow, followed by slicing and dicing of support levels – a breach of the 200 day moving average, then the upward trend line and today the 50 day moving average..  Given the magnitude of the selling over the past couple days, we could see a short term oversold bounce, but that should be short lived.  The doom and gloomers might begin calling for a test of those March lows, but I don’t think we’ll get that far.  More deterioration is ahead and staying away from the long side is still the best strategy, but the good news is that big opportunities will be created for those that missed this rally.

52108_dow

Trade of the Day: Another Breakout in Digital Alley (DGLY)

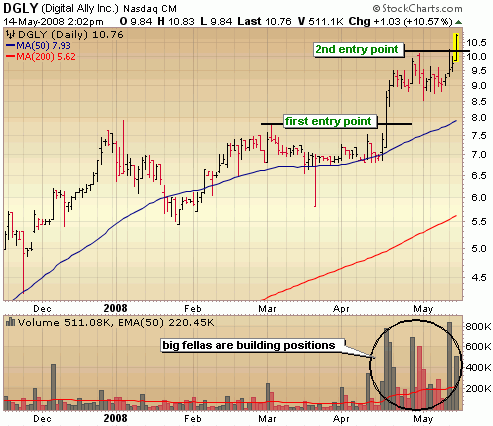
I first highlighted DGLY back on April 11th in a Top Breakouts post, then again on April 17th as it broke out of a base with big volume.  Today it continues to surge higher, producing yet another breakout from a short consolidation.  The stock actually broke out of a triangle formation just two days ago, but reversed sharply and closed in the lower half of the range.  It wasn’t enough to stop the momentum as institutions continue to build positions in this emerging company.  Today, it cleared an all time high and volume looks like it’s going to come in at nearly 4x the average.  It’s a bit extended at this time, so considerably more risky then when I first profiled it but it still has tremendous momemtum behind it. 

digital alley dgly breakout

Disclaimer: I absolutely own DGLY.

Sentiment Shifts As Traders Take Profits

Oil continued to surge higher this week, but it was a different story for the overall market as traders began to lock in profits following an impressive surge off the March double bottom. 

I talk about this quite a bit here, but it’s worth repeating.  At market bottoms, the sentiment begins to shift as traders look for just about any positive news to rally as the bad news gets fully priced in.  Near market tops (or after sustained runs), you’ll notice a shift in the opposite direction as traders look for an excuse to take profits.  No longer does the good news spark a rally because it’s been largely priced in.

On Monday evening I sent the following to my members (you can receive these reports by signing up at the left)

"It was fairly subtle but did you notice it today?  Perhaps a shift in sentiment is underway.  I’ve began discussing the shift in sentiment after the Bear Stearns bailout to a more bullish tone.  That is, the
market seemed to be beginning to focus on the positives, looking for any glimmer of daylight to rally.  It was time to begin adding on the long side.  BUT, the action today revealed a possible reversal to
increasingly bearish sentiment.  Over the past several weeks the market rallied on any economic news that was "better than expected".  What happened today?  That non manufacturing ISM index
came in better than expected and well ahead of last months reading (49.6) at 52 which indicated expansion.  While the market surged initially, it quickly wore off and the indices never recovered.  A
few weeks ago, it probably would have been enough to kick start AND sustain a rally.  This isn’t a clear indication that this rally is coming to an end, just a small clue.  Considering today’s selling volume came in on the light side, it’s considered a healthy day of consolidation keeping the bulls in charge for now.  However, I’m still playing it cautiously and trading only in the very short term. As further indication that the end of the rally is very near, be on the lookout for a day of distribution.  I think we are close to that."

That was clue number 1 that perhaps the market was stalling out.  Then came Wednesday and the big day of distribution.  It’s important to remember that one day of distribution won’t kill a rally.  After the run up we’ve had, it’s not unusual to have a big day of selling like that.  However, it’s also important to remember that this is still a bear market that’s to be respected, not to mention we’re heading into what is notoriously one of the worst months for the market.  After a bear rally like that why not lock in a good portion of those gains?

On Wednesday evening I sent the following to members:

"A couple days ago I mentioned that the market provided a subtle clue that perhaps the rally was coming to an end by not rallying after a positive ISM report.  Today, the market provided a much bigger clue that the rally is coming to an end with a big day of distribution as the Dow was unable to take out resistance of the 200 day moving average.  It was the first day where sellers really exerted some control since April 11th, when GE reported awful results. 

There really wasn’t a glaring catalyst that induced today’s selling.. Oil approaching 125/barrel will certainly stoke inflationary fears and put further strain on an already strapped consumer and I don’t think the market has fully priced those concerns in.  Outside of that and a weak pending home sales
number, this was probably more of a technical sell off.

Volume wasn’t through the roof on the sell side today, but it was considerably heavier than the day before and sets us up for additional weakness in the coming days.  Just how far the market pulls back is very difficult to get a read on after just one day.   We’ll have to keep an eye on support levels and the amount of sell volume on down days.  The next areas of support and likely test areas for the indices are Dow 12700 (upward trend line & previous highs), Nasdaq 2400 (april high) and S&P 1385 (upward trend line).  If we take out these levels (which I think is quite likely), we’re most likely headed down to test the 50 day moving averages.  Testing this moving average would be roughly a 50% retracement of the rally off the March bottom and an area where I’d be looking to get more aggressive on the long side once again. 

I closed out most of my long positions last week and two more today.  I’m sitting on 50% cash, 25% long and 25% short."

Currently, both the Dow and S&P are sitting right on their upward trend lines but probably poised to break through.  Let’s take a closer look…

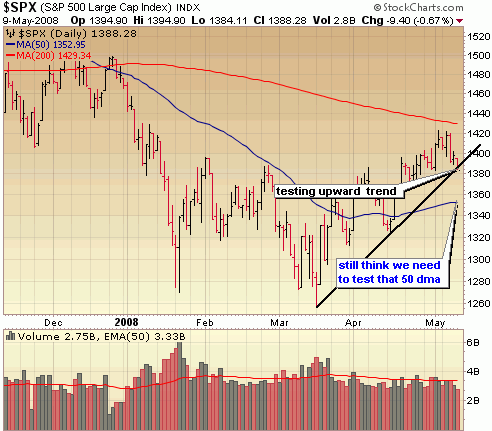
The S&P as you can see sits right on that line, but give the distribution we saw Wednesday I really think we break through that level and ultimately test the 50 day moving average at some point.  I probably won’t get more aggressive on the long side until we get down to those levels.  Some people are even calling for a retest of the lows of the correction but in my opinion we don’t get down that far again.  I do think that double bottom is a long term bottom for the market.  We’ll see. 
51008_sp500

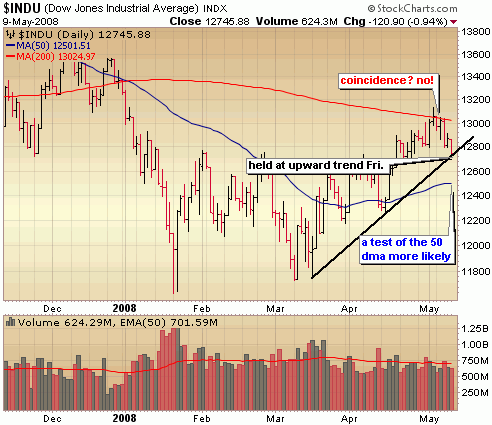
Notice how the Dow tested major resistance of the 200 day moving average on several occasions and was unable to bust through.  That was another signal that the market was tiring.  It’s no coincidence that that was the barrier in the Dow.  We now turn our attention to support levels for an indication of how far this pull back will go.  The Dow did hold at the upward trend on Friday, but again, I just don’t think this is the end of the pull back and the Dow soars to new heights.  A test of the 50 day moving average seems more likely. 
51008_dow

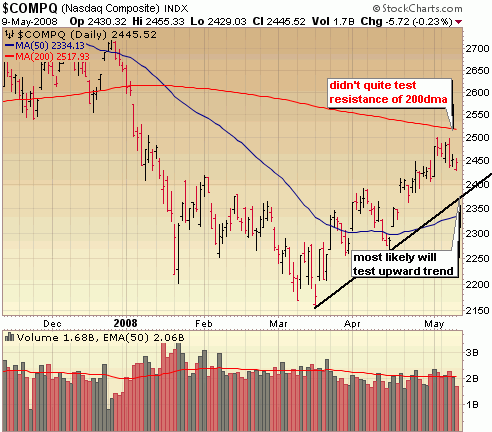
The Nasdaq never quite tested that 200 day moving average, but did have trouble with psychological resistance at 2500 and appears headed to test the upward trend line in the 2400 range. 
51008_naz

The bottom line is that this is no time to be aggressive on the long side, but I don’t think it’s necessarily a  good time to be aggressive on the short side either.  If you’re not a shorter term trader trying to take advantage of some of these moves in solar, china and oil plays it’s probably best to sit on cash for awhile as we get further into May. 

::: Model Portfolio :::

** This section will now appear as a separate report about every other Wednesday. 

The Self Investors Model Portolio wrapped up 2007 with a 30.2% gain.  Would you like to receive buy and sell alerts within minutes (NEW! now get them via instant messaging in near real time) of each transaction in the portfolio?  You can receive these along with ALL of the tracking tools and reports with the very popular Gold membership.  Don’t delay, get started today and join me for many more highly profitable months here at SelfInvestors.com.

::: Best/Worst Performers :::

– Top 10 Performing Industries For the Week –

1. Oil & Gas Equip & Services: 7.70%
2. Industrial Equipment Wholesale: 7.45%
3. Industrial Metals & Minerals: 7.25%
4. Oil & Gas Drilling & Exploration: 5.55%
5. Independent Oil & Gas: 5.55%
6. Gold: 5.40%
7. Silver:  5.30%
8. Metal Fabrication: 4.90%
9. Heavy Construction: 4.40%
10. Specialty Chemicals: 3.85%

– Top 10 Worst Performing Industries For the Week –

1. Major Airlines: -11.40%
2. Drugs – Generic: -11.05%
3. Banks – SE: -8.85%
4. Drugs – Related Products: -7.90%
5. Building Materials Wholesale: -7.90%
6. Regional Airlines: -7.80%
7. Investment Brokerage: -6.65%
8. Education & Training Services: -6.55%
9. Department Stores: -6.50%
10. Home Improvement Stores: -6.40%

– Top 5 Best Performing ETFs For the Week –

1. Market Vectors Russia (RSX) 10.05%
2. United States Oil (USO) 9.35%
3. US Natural Gas (UNG) 8.15%
4. SPDR Oil & Gas Equip & Services (XES) 7.30%
5. iShares S&P Commodity Index (GSG) 7.30%

– Worst 5 Performing ETF’s –

1. HOLDRS Internet Infrastructure (IIH) -30.30%
2. Greater China Fund (GCH) -10.90%
3. Morgan Stanley India (IIF) -10.05%
4. India Fund (IFN)  -9.15%
5. Ishares Home Construction (ITB) -8.60%

:::  IPO’s Worth Watching for This Week :::

This section will now appear as a separate post on Mondays.

While 2008 should be a much slower year for IPO’s considering the deterioration of the market, there will continue to be some good companies coming to market here and there.  I’ll be highlighting the best IPO’s every Monday.

::: Upcoming Economic Reports (5/12/2008- 5/16/2008) :::

Monday:        Treasury Budget 
Tuesday:       Retail Sales, Export/Import Prices, Business Inventories
Wednesday:  CPI, Crude Inventories
Thursday:      Initial Claims, Capacity Utilization, Industrial Production, Philly Fed
                      Construction Spending, ISM Index
Friday:           Building Permits, Housing Starts

::: Earnings I’m Watching This Week :::

Monday:
XFMedia (XFML)

Tuesday:
Applied Materials (AMAT), Cameco (CCJ), Canadian Solar (CSIQ), Gushan Environmental (GU)

Wednesday:
China Digital TV (STV), Ctrip.com (CTRP), Deere (DE)

Thursday:
Hewlett Packard (HPQ), Urban Outfitters (URBN)

Friday:
Abercrombie & Fitch (ANF)

::: In Case You Missed It – SelfInvestors Blog Entries of the Past Week :::

1. Visa (V) Vs. Mastercard (MA): Earnings Results

2. Peak Oil, Peak Water.. We’re All Gonna Die

3. Selling in May Is Not a Bad Strategy

4. Colfax (CFX) & Real Goods Solar (RSOL) IPOs Begin Trading
Colfax (CFX) & Real Goods Solar (RSOL) IPOs Begin Trading
The number of decent IPO’s coming to market is picking up to a slow trickle and today two IPO’s worth watching began trading – Colfax (CFX), a global supplier of pumps for the water and oil industry & Real Goods Solar (RSOL), one of the largest installers of solar energy systems. 

colfax_cfx Colfax (CFX) began its life as a public company with a bang opening up at 24/share but finishing the day 3 bucks lower at 21/share.  Still well ahead of the 18/share initial price which raised the company 338 million.

According to Google Finance, the company is a global supplier of a range of fluid handling products, including pumps, fluid handling systems and specialty valves. The Company is a manufacturer of rotary positive displacement pumps, which include screw pumps, gear pumps and progressive cavity pumps. Its products serve a variety of applications in five markets: commercial marine, oil and gas, power generation, global navy and general industrial. The Company’s are marketed principally under the Allweiler, Fairmount, Houttuin, Imo, LSC, Portland Valve, Tushaco, Warren and Zenith brand names. Colfax Corporation’s customer base includes commercial, industrial, marine and governmental customers, such as Alfa Laval, Cummins, General Dynamics, Hyundai Heavy Industries, Siemens, Solar Turbines, Thyssenkrupp, the United States Navy and various sovereign navies around the world. In January 2007, the Company acquired Lubrication Systems Company. In November 2007, it acquired Fairmount Automation, Inc.

The financials appear to be strong and the company said that 2007 net income rose to $64.9 million on revenue of $506 million from net income of $94,000 on revenue of $394 million in 2006, but it’s difficult to say how much of that is through acquisitions rather than organic growth.  I have not poured over the numbers in Colfax but will let it trade it for a couple weeks as I do with all IPO’s then take a closer look at the financials and technicals.

::::::::

real_goods_rsol It was not such a good day for Real Goods Solar (RSOL) as the stock finished considerably lower than the $10 that it initially priced at with much of the proceeds going to parent company Gaiam.  As I mentioned in a previous post, Real Goods Solar is a subsidiary of Gaiam (GAIA), the environmentally friendly lifestyle products retailer.

From the website of Real Goods:

Real Goods has led the Sustainable Living market through sales, education and installation of solar and other renewable energy products. As the original and most experienced solar installer, we are ideally positioned to install solar on your home or business. In fact, there has never been a better time to go solar! Rebates and tax incentives like those in Colorado and California have made solar power systems more affordable than ever.

The decision to go solar is the first step. Now you must choose an experienced, reliable partner to walk you through the process—from design to installation to rebate paperwork—we’re with you every step of the way.

  • We sold the very first solar panel in the US in 1978 and expect to be here for many decades to come.
  • Real Goods has installed 2500 homes (and counting) with unparalleled and caring customer service.
  • Instant rebate –no paperwork and waiting for reimbursement.
  • 20+ years construction experience.

The company says it’s installed more residential energy systems in the US than any other company, including competitor Akeena Solar (AKNS) which reported awful results this morning.  Akeena said losses soared to 4.6 million, despite revenues nearly doubling.  Real Goods has been turning some profits and appears to be the better play in the residential solar installation field.