Category Archives: Weekly/After Stock Market Review Archives

Every Sunday evening a full market review is sent to members of SelfInvestors.com which provides commentary on the technical and economic picture, a review of the SelfInvestors Model Portfolio, the best/worst performing industries and ETF’s for the week, IPOs to watch, upcoming economic reports as well as notable earnings reports. In addition, on days when the market makes a significant move I’ll highlight the technical action discussing price/volume movements and support/resistance levels, industries/sectors leading and lagging the market as well as a Stock of the Day. In the past these were sent in the middle of the trading day but I’ve since begun publishing them and sending them to members after the market closes. These reports will be archived here as well.

This 3 Legged Bull Will Contend With Housing, PPI, GDP and Bernanke

You could call Friday’s action an exclamation point to one of the wildest weeks of intraday reversals I’ve ever seen.  With about 30 minutes to go of trading, the market was dead in the water with volume picking up and the indices right on the verge of taking out the lows of the day.  We had already taken out support of those wedge formations I’ve been discussing which was critical to staying away from the possibility of testing the January lows.  The only way we were going to avoid serious technical damage today was some kind of end of day miracle rally.  I have to admit, given the trading of the past week it was in the back of my mind.  But nothing like this.  There he was, Charlie Gasparino of CNBC mentioning a rumor of an Ambac bailout plan that was imminent (Monday or Tuesday of next week). 

.. and here we go again.  It led to a 250 point reversal in 30 minutes.  Suddenly, the short positions I had put on earlier in the day didn’t look like such a good idea!  In 30 minutes, the market changed from one on the verge of another big break down to one in a state of uncertainty.  As has been the case for much of the past 8 months or so, good technical and fundamental analysis has given way to rumor, Fed speak and news driven rallies.  It remains an incredibly difficult environment to trade and one that I have to continue to recommend staying out of for now.  You’ve seen how difficult it has been for me to pull profits out this year and I eat and breathe this stuff while trading for a living. 

I liked what one member said in an email to me: "It feels like skill is being replaced by luck."  So true.  Of course there is luck involved to successful investing, but it seems much more so in recent weeks.  There will come a time when new leaders emerge and the rumors, Fed speak and big news headlines subside.  When the technicals matter and patterns become more predictable.  When that time comes, there will be extraordinary profit potential.  Take this time to watch and learn.  Maybe read that investing book you’ve always wanted to read, study the tutorial here and the nearly 4 years of Stock Watch report archives to get an idea of what  a great looking chart looks like.  Keep your watch lists up to date (the Hot Stocks screen here at Self Investors is a great place to start!).  Be patient but prepared.

On Friday, Don Worden of Telechart summed up the recent action so well in his notes:

"There is an old saying you seldom hear anymore: "The market knows." It is generally uttered in kind of a spooky, ghostly tone. But it would mean the same thing even if somebody like the late Judy Garland were belting out the ghostly lyrics. It means that the market is clairvoyant. It often behaves in a way that convinces traders it must have known all along what was going to happen. 

     It is something the market has repeated very often–over the years. And nobody has ever been able to explain it, although many think they know. However, if I know anything about ghosts, they are very "shut mouthed." They don’t give away many secrets.  I think it’s possible that I’ve never encountered a market that lacks intuitive insight to the degree this one does. It’s clear the market spends most of the time bewildered these days. This obviously means the ghosts themselves are confused. Maybe they went on strike with the writers and are refusing to come back.
     In the meantime, the rest of us mortals are forced to think for ourselves. All we can do is try not to lose money until the market or the ghosts lurking about make a mistake and inadvertently drop a clue.

     That was an impressive move during the last half hour today. The problem is that was an ominous move yesterday. And a bullish move the day before that. And so it’s been. Each day the market puts on a show for us, delivering a believable clue that soon falls apart–or more often is just forgotten. "

Let’s turn to the charts.  Perhaps they provide us with some clues (or not!)

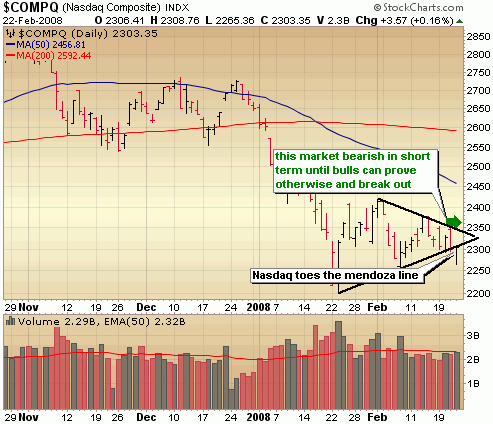
Like all the indices, the Nasdaq too was left for dead heading into the last 30 minutes of trading on Friday.  It broke down below the wedge formation in convincing fashion before staging that massive late day  reversal.  Notice how it just got back to the point of resistance/support of that bottom short term trend.  Are we bearish or bullish here?  It’s just damn tough to tell at this point.  We do appear to be breaking down in the short term but with the bulls having an outside chance to still break out from the top of the wedge, given Friday’s high volume reversal.  It’s entirely possible that Friday’s lows just marks the bottom of a wider triangle formation, but at this point I have to give the nod to the bears.  It took a massive rally based on speculation of a deal getting done with Ambac and a whole helluva lot has to happen for that to work out.  With all of the deteriorating economic news and rising inflation, the bulls are pinning their hopes on a bail out of bond insurers.  The bulls have legs to stand on, but I’m darn certain it’s less than 4.
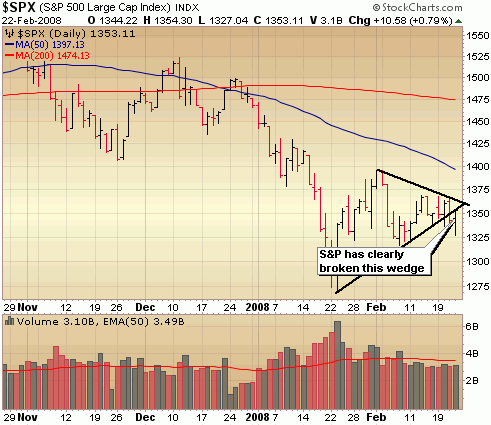
Notice that the S&P really took out that wedge on Friday with the massive rally just getting it back to resistance of the wedge.  It just looks like this market is going to need to see a massive follow through very early in the week next week for Friday’s move to mean anything.  Again, Friday’s lows could just mark the bottom of a much wider wedge formation, but regardless, we’re going to need to break out of the top of the formation to avoid a retest of the January lows.
The Dow looks better than the S&P and Nasdaq do and was able to get back inside that wedge but lets remember that the Dow isn’t the best representative of the overall market.
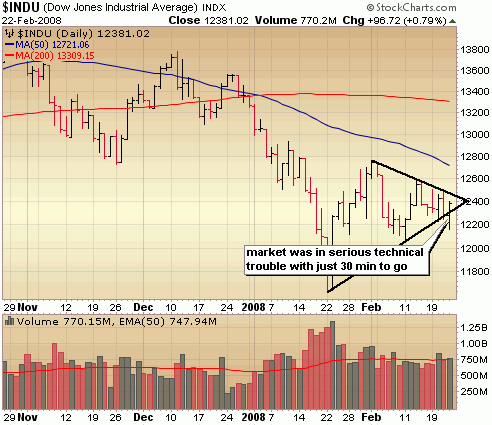
The bottom line is that this market remains a big uncertainty with no trend, little leadership (commodities) and a flurry of upcoming important economic events (PPI, GDP, housing numbers).  Not to mention a speech from Bernanke on Thursday to contend with.  This market is probably ready to explode very soon, but which way remains to be seen.  It’s best to stay out until a firm sense of direction is resolved.

::: Model Portfolio :::

** This section will now appear as a separate report to be published every other Wednesday

The Self Investors Model Portolio wrapped up 2007 with a 30.2% gain.  Would you like to receive buy and sell alerts within minutes (NEW! now get them via instant messaging in near real time) of each transaction in the portfolio?  You can receive these along with ALL of the tracking tools and reports with the very popular Gold membership.  Don’t delay, get started today and join me for many more highly profitable months here at SelfInvestors.com.

::: Best/Worst Performers :::

– Top 10 Performing Industries For the Week –

1. Internet Service Providers: 10.75%
2. Steel & Iron: 8.15
%
3. Wholesale – Other: 7.80%
4. Aluminum: 7.60%
5. Copper: 7.25%
6. Gold: 7.15%
7. Technical Services:  6.05%
8. Meat Products: 6.05%
9. Heavy Construction: 5.95%
10. Diversified Computer Systems: 5.75%

– Top 10 Worst Performing Industries For the Week –

1. Toy & Hobby Stores: -7.65%
2. Sporting Activities: -6.70%
3. Consumer Services: -5.75%
4. Apparel Footwear: -4.95
6. Rental & Leasing Services: -4.65%
7. Manufactured Housing: -4.50%
8. Personal Computers: -4.25%
9. Drug Delivery: -4.20%
10. Security Software & Services: -4.20%

– Top 5 Best Performing ETFs For the Week –
 
1. Herzfeld Caribbean Basin (CUBA) 22.35%
2. Market Vectors Steel (SLX)  7.60%
3. Asa Gold (ASA) 7.40%
4. Ishares Brazil (EWZ) 7.30%
5. Market Vectors Gold Miners (GDX) 7.15%

– Worst 5 Performing ETF’s –

1. HOLDRS Telecom (TTF) -6.20%
2. Ishares Telecom (IYZ) -5.45%
3. 
iPath India (INP) -5.30%
4. SPDR Biotech (XBI) -4.80%
5. Powershares Clean Energy (PBW
) -4.75%

:::  IPO’s Worth Watching for This Week :::

This section will now appear as a separate post on Mondays (if there are some interesting IPO’s coming to market).

While 2008 should be a much slower year for IPO’s considering the deterioration of the market, there will continue to be some good companies coming to market here and there.  I’ll be highlighting the best IPO’s every Monday.

::: Upcoming Economic Reports (2/25/2008– 2/29/2008) :::

Monday:         Existing Home Sales
Tuesday:       PPI, Consumer Confidence
Wednesday:  Durable Orders, New Home Sales, Crude Inventories
Thursday:      GDP, Initial Claims
Friday:            Personal Income/Spending, Core PCE Inflation, Chicago PMI

::: Earnings I’m Watching This Week :::

Monday:
Henry Schein (HSIC), Donaldson (DCI), Focus Media (FMCN), LDK Solar (LDK), Shanda Interactive (SNDA)

Tuesday:
China Fire & Security (CFSG), Foster Wheeler (FWLT), Home Depot (HD), Internet Gold (IGLD), Natus Medical (BABY)

Wednesday:
Amedisys (AMED), Toll Brothers (TOL), LifeCell (LIFC), Central European Distribution (CEDC), Ctrip.com (CTRP), Flowserve (FLS), Gmarket (GMKT)

Thursday:
Arena Resources (ARD), Chart Industries (GTLS), Flour (FLR), Rowan (RDC), American Intl (AIG), China Finance Online (JRJC), China Medical Tech (CMED), Comp Vale Do Rio (RIO), Deckers Outdoor (DECK), Grant Prideco (GRP), Hansen Natural (HANS), Heico (HEI), SW Energy (SWN)

::: In Case You Missed It – SelfInvestors Blog Entries of the Past Week :::

1. Goldcorp (GG) Breaking Out After Blowing Out Estimates, Vasco Data (VDSI) Crushed Again

2. Axsys (AXYS) Breaks Out to All Time Highs, Suntech (STP) Blinds Solar

3. The Coal ETF, Gold / Agriculture Topping? Time to Play Financials / Homebuilders?
The Coal ETF, Gold / Agriculture Topping? Time to Play Financials / Homebuilders?
For this week’s market report I’m doing something a bit different by highlighting moves in certain sectors through ETF’s to get a good picture of the overall market.  I’ll have analysis of the major indices following any significant moves next week.

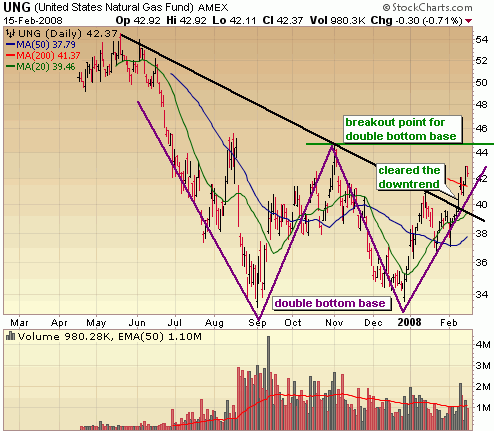
In the last ETF review, I discussed the opposite trends of gas and oil – oil generally breaking down, while natural gas appears to be in the beginning stages of new major uptrend.  Note the double botton base in the US Natural Gas Fund and a beak of the downward trend.  It’s overbought in the short term, but natural gas appears to be in play on the long side for 08.

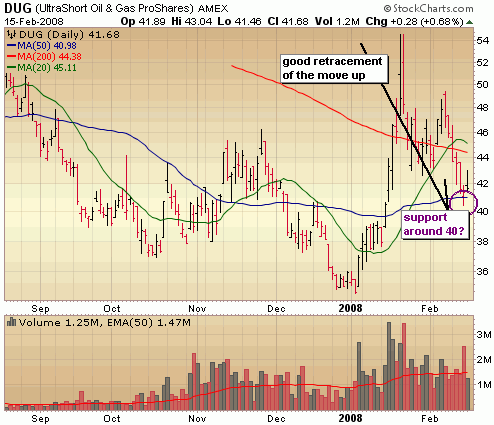
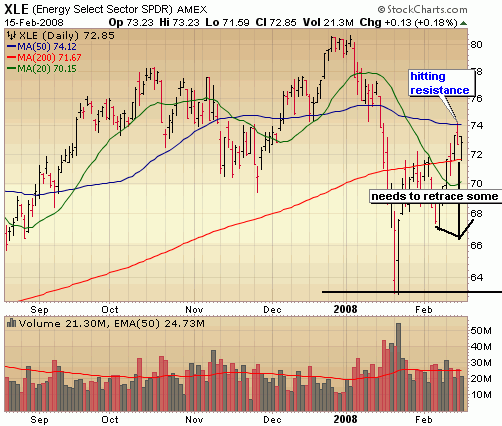
Oil did indeed break down in a big way but has retraced much of that move back to resistance.  I think it’s probably setting up for another move down soon to test the lows of the correction.  The Energy Select SPDR ETF (XLE) is hitting resistance of the 200 day moving average.

Interested in leveraging up on another move down in oil?  Then DUG is your tool.  It seeks to return twice the inverse of the move in oil. 

Topping High Flyers?

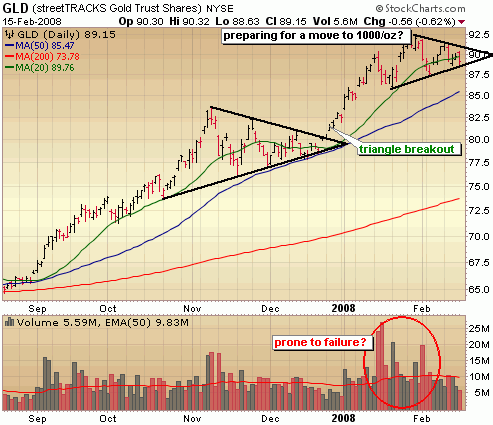
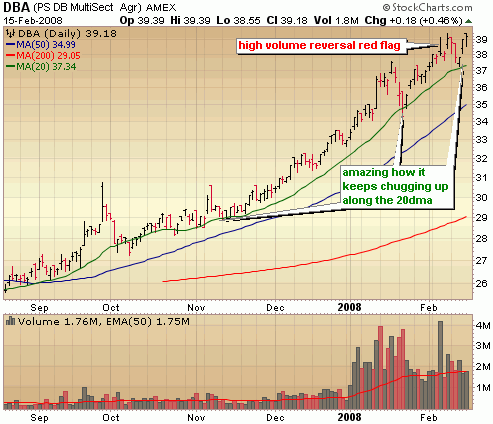
Gold and Agriculture stocks have been flying but showing some signs of deterioration, at least in the short term.

Gold broke out of a nice looking bullish triangle formation back in December and is carving out another.  However, this triangle formation is showing some heavy selling and more likely prone to failure.  My guess is that it needs to form a more substantial base than a short triangle in order to coil the spring for a move to 1000/oz and beyond.  If this triangle is broken up here, look for a move to the 50 day moving average around 86, where it has found support in the past.

The Powershares Agriculture ETF (DBA) just keeps pushing higher, but topping signals are beginning to appear.  The high volume reversal on Feb 6th was the first.  Perhaps it hits psychological resistance around 40 and fails.  This thing is well overdue for a correction, but it won’t happen until it can take out that 20 day moving average, which it has been trending along for several months.

Left for Dead, Now Bottoming Out? Homebuilders & Financials

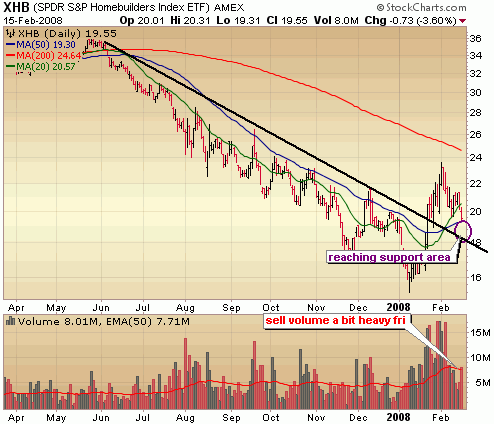
I’ve written about the bottoming homebuilders on a couple of occasions in the past several weeks and admittedly received some flak from people for making the first call.  Then they ran up 50% and the talking heads began to call a bottom.  That’s when I wrote up my 2nd report mentioning they were bottoming but very overbought in the short term (time to profit on the short side!).. and profit we did!  So where do we stand now?

The homebuilders continue to retrace that big ramp up out of downward trends and in my opinion getting close to ending this consolidation phase and beginning a new leg up.  The sell volume on Friday was a bit on the heavy side, so I think there is the possibility of more consolidation (maybe another 5 – 10%)  The key is not trying to jump in too early and wait for a new leg up to emerge.  In other words you want to wait for big buyers to step in again and start buying just as they did the first time around. 

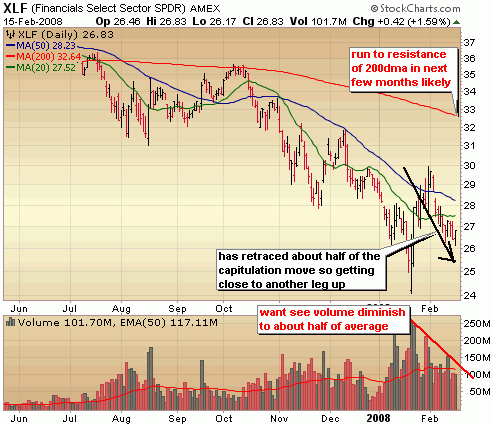
Financials are trading in near tandem with the builders.  The big run up after the Fed cuts, followed by a retracement of that move.  I think the financials are a bit closer to beginning a new leg up then the builders are, but I want to see sell volume diminish to about half of the average followed by another big surge in buying.   I do think the financials bottomed though as a whole.  That certainly doesn’t mean individual financial names couldn’t continue to slide further or go bankrupt. 

New Kid on the Block – Market Vectors Coal ETF (KOL)

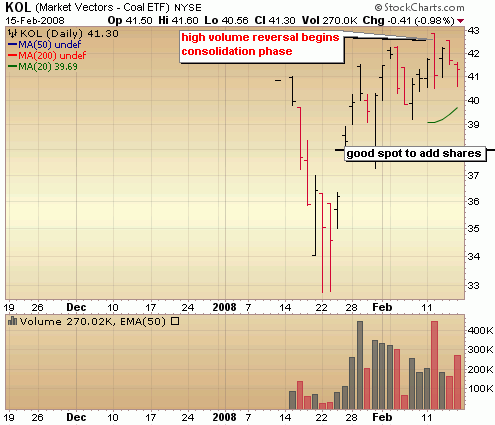
Coal has been hot of late and recently has been receiving much mainstream attention at lofty levels.  No wonder coal names have begun to see some correcting.  I think that continues for a bit longer, but coal does seem like another good play in 08 once it retraces some of this move up.  KOL is a new ETF from Market Vectors that began trading in January.  It’s liquid enough out of the gates to consider as a good, diversified way to play coal.

 ::: Model Portfolio :::

** This section will now appear as a separate report to be published every other Wednesday

The Self Investors Model Portolio wrapped up 2007 with a 30.2% gain.  Would you like to receive buy and sell alerts within minutes (NEW! now get them via instant messaging in near real time) of each transaction in the portfolio?  You can receive these along with ALL of the tracking tools and reports with the very popular Gold membership.  Don’t delay, get started today and join me for many more highly profitable months here at SelfInvestors.com.

::: Best/Worst Performers :::

– Top 10 Performing Industries For the Week –

1. Rubber & Plastics: 10.70%
2. Internet Service Providers: 10.70
%
3. Aluminum: 8.90%
4. Heavy Construction: 7.80%
5. CATV Systems: 7.45%
6. Oil & Gas Equipment Services: 6.30%
7. Nonmetallic Mineral & Mining:  5.50%
8. Steel & Iron: 5.45%
9. Broadcasting – Radio: 5.15%
10. Shipping: 5.10%

– Top 10 Worst Performing Industries For the Week –

1. Toy & Hobby Stores: -12.00%
2. Surety & Title Insurance: -8.90%
3. Manufactured Housing: -5.45%
4. Education & Training Services: -5.15
6. Jewelry Stores: -4.90%
7. Electronic Stores: -4.75%
8. Gaming Activities: -4.25%
9. Medical Practitioners: -4.20%
10. Healthcare Info Providers: -3.90%

– Top 5 Best Performing ETFs For the Week –
 
1. Market Vectors Global Alernative Energy (GEX) 10.35%
2. Market Vectors Nuclear Energy (NLR)  8.85%
3. Powershares China (PGJ) 7.55%
4. Market Vectors Russia (RSX) 7.50%
5. Ishares Sweden (EWD) 6.40%

– Worst 5 Performing ETF’s –

1. Ishares Home Construction (ITB) -3.45%
2. KBW Banking (KRE) -3.20%
3. 
Powershares High Yield Dividend (PEY) -2.45%
4. SPDR Gold (GLD) -2.05%
5. SPDR Homebuilders (XHB
) -2.00%

:::  IPO’s Worth Watching for This Week :::

This section will now appear as a separate post on Mondays if there are some interesting IPO’s coming to market.

While 2008 should be a much slower year for IPO’s considering the deterioration of the market, there will continue to be some good companies coming to market here and there.  I’ll be highlighting the best IPO’s every Monday.

::: Upcoming Economic Reports (2/18/2008– 2/22/2008) :::

Monday:         None
Tuesday:       None
Wednesday:  CPI, Building Permits, Housing Starts, FOMC Minutes
Thursday:      Leading Indicators, Initial Claims, Philly Fed
Friday:            None

::: Earnings I’m Watching This Week :::

Tuesday:
Walmart (WMT), China Fire & Security (CFSG), Fossil (FOSL), Crocs (CROX), iRobot (IRBT)

Wednesday:
Garmin (GRMN), Transocean (RIG), Given Imaging (GIVN), Sina (SINA)

Thursday:
The Street.com (TSCM), Morningstar (MORN), Hornbeck Offshore (HOS), ICON (ICLR), ANSYS (ANSS), Pan American Silver (PAAS)
Ritchie Bros. Auctioneers (RBA), GFI Group (GFIG), Blue Coat Systems (BCSI), Cleveland Cliffs (CLF)

Friday:
Life Time Fitness (LTM)

::: In Case You Missed It – SelfInvestors Blog Entries of the Past Week :::

1. Yahoo Rejects Microsoft, Google Wins

2. Technicals Improving, But Significant Risk Remains

3. Gaiam (GAIA) to Spinoff Real Goods Solar (RSOL)

4. Focus on the Present to Improve the Future

5. Market In Need of Some Roger Clemens Juice; Stock of Day – Balchem (BCPC)

6. Jim Cramer Credibility Problem Part Deux

4. Stop, Drop and Think

Market In Need of Some Roger Clemens Juice; Stock of Day – Balchem (BCPC)

It was a great day for bulls on the surface with a better than expected retail number (although in part fueled by rising gas prices) and not as bad as expected results from Applied Materials (AMAT).  Near the bottom, the market looks for excuses to rally and I think there was certainly some of that today but I don’t think we’re out of the woods from testing the lows of this correction. 

There continues to be no leadership.  When I’m running through my watch lists on a day the market rises nearly 200 points and have a hell of a time finding good buy candidates, I know it’s still not a healthy market.  That’s exactly what I’ve been seeing over the past few weeks.  Sure there are pockets of strength in some of the metals, railroads, coal, etc but most of the stocks moving are those that have been beaten down the most. 

The brightest red flag of the day was in the volume levels.  Institutions just aren’t putting big money to work as buy volume continues to trickle in at below average levels.  You want to see some gusto on a day like today, but it just wasn’t there.  There is a good chance of pushing a bit higher, but combine the lack of leadership with the lack of volume and the long side remains a dangerous place to play.

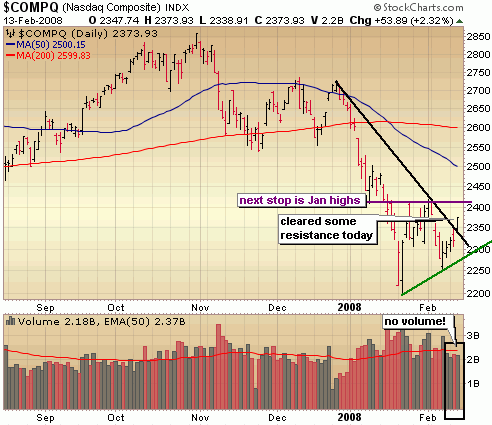
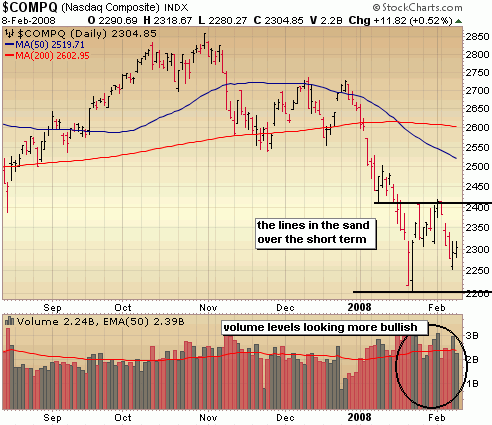
The Nasdaq cleared that first steep downward trend today with light volume.  Considering the Nasdaq reversed off its highs yesterday with increasing volume I was a bit surprised at today’s move and in hindsight regret closing my QLD positions   This move sets up a move to the next resistance area at the Jan highs around 2425, but given the lack of buy volume recently, we may need to pull back first and test that developing short term upward trend line (in green).  Keep an eye on the green line.  If we take that out, I think there is a very good chance of testing the lows of the correction or worse.

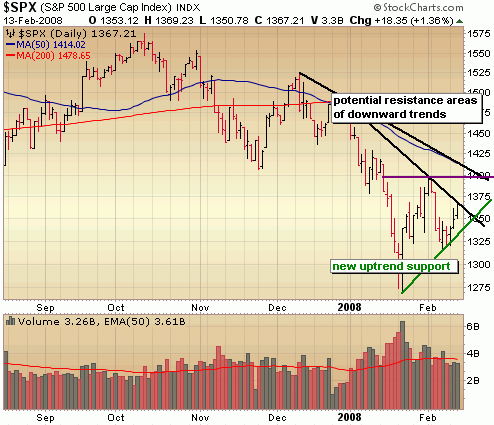
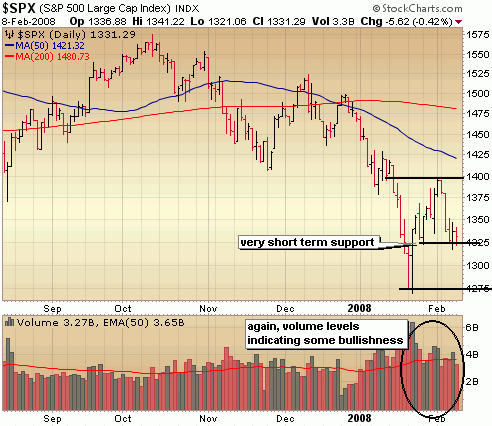
The S&P has yet to clear that first downward trend resistance and may have a tough time doing so given the lack of buy volume.  If it does clear, look for a retest of the next resistance level around 1400.  Also, keep an eye on the short term upward trend developing off the bottom – again, if we take that out there is a decent chance of testing the lows of the correction.

s&p 500

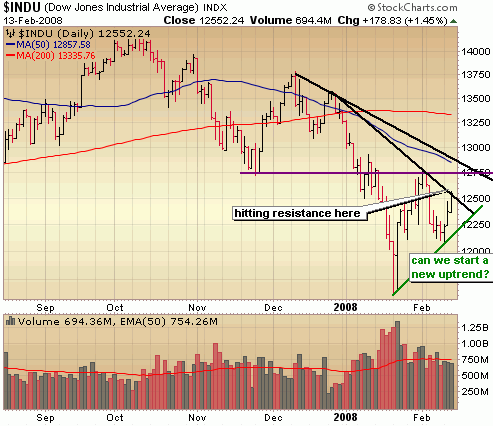
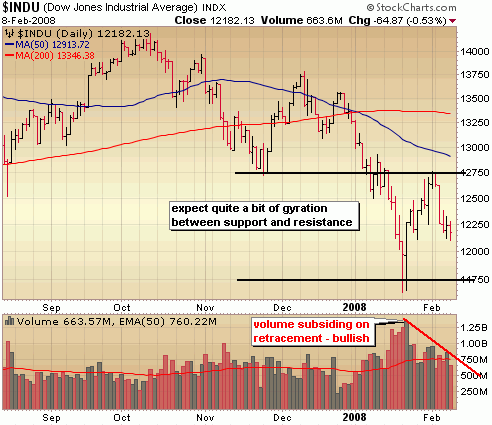
The Dow is a near replica of the S&P in terms of support and resistance.  Notice the downward slope of buy volume.. not what you want to see in a strong market.


::: Major Indices Performance – The Numbers :::

(Note: volume averages are based on the average over the past 50 days)
Data as of 4:00EST – End of Day February 13th 2008

Nasdaq: UP 2.32% today with volume 7% BELOW average
Nasdaq ETF (QQQQ) 2.19%, volume 14% BELOW average
Dow: UP 1.45%, with volume 8% BELOW the average
Dow ETF (DIA): UP 1.2%, with volume 25% BELOW the average
S&P ETF (SPY): UP 1.02%,  with volume 21% BELOW the average
Russell Small Cap ETF (IWM): UP 2.05%, with volume 12% BELOW the average

::: SelflInvestors Leading Stocks :::

The Self Investors Leading Stocks Index is comprised of stocks in the Breakout Tracker, which is a database of the fastest growing companies near a breakout or having already broken out of a base.  Leading stocks performed about in line with the Nasdaq and Russell today and also saw little conviction on the buy side

Summary:

* Advancers led Decliners 197 to 34
* Advancers were up an average of 3.03% today, with volume 10% BELOW average
* Decliners were down an average of 1.37% with volume 31% above the average
* The total SI Leading Stocks Index was UP 2.38% today with volume 4% BELOW average

::: Where’s the Money Flowing :::

Many investing websites provide leading industries based on price performance alone. However, without accompanying volume levels, this can sometimes be misleading.  The only way that I know of to gauge industry/sector strength WITH volume levels is through the analysis of ETF’s.  A couple years ago this was not possible, but as more traders/investors use ETF’s they become a much better tool for gauging the health of the market and seeing where the money is flowing (or not flowing).  Using the proprietary SelfInvestors Demand Indicator score which measures price and volume movements, I’m able to quickly see which sectors/industries are seeing the greatest inflows of cash.  For a detailed look at how I go about gauging sector/industry strength please see the following post: http://selfinvestors.com/si/industry_tracking/

* Current Leading Sectors/Industries (over last 30 trading days):  
Agriculture, Commodities, US Oil, Materials, Gold
                                          
* Current Lagging Sectors/Industries (over last 30 trading days): 
Broadband, Health Care Providers, Aerospace/Defense, Utilities

* Today’s Market Moving Industries/Sectors (UP):
Clean Energy, Oil Services, Dynamic Oil & Gas, Broadband, Semis, Internet Infrastructure

* Today’s Market Moving Industries/Sectors (DOWN):
Bonds, Health Care Providers

::: Stocks :::

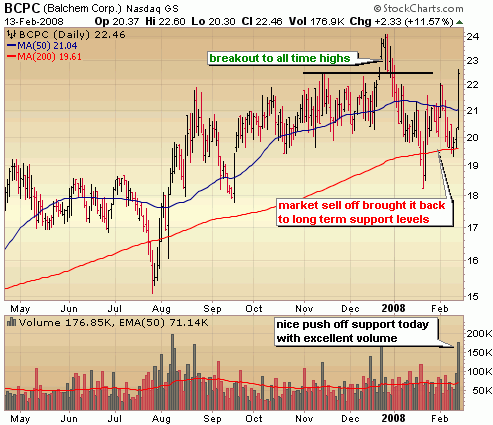
The stocks section will be an area where I highlight one stock selected from a group of stocks moving up with volume well above average and most likely breaking out of a base or consolidation.  It’s been quite some time (last featured Parexel (PRXL) since I featured a Stock of the Day here as the market just hasn’t yielded many quality candidates, but as the market pushes higher off a bottom, a few more leading stocks are beginning to move up with significant volume (although leadership is non existent at this point and caution is urged).  I try and highlight stocks in this section that most people aren’t talking about but "could" be talking about (hopefully after you’ve already pocketed big gains).  Today’s stock certainly fits the bill – Balchem Corp (BCPC), a diversified specialty chemical company.

ABOUT: 

Balchem Corporation (Balchem) is engaged in the development, manufacture and marketing of specialty performance ingredients and products for the food, nutritional, feed, pharmaceutical and medical sterilization industries. The Company has three segments: specialty products, encapsulated/nutritional products and the unencapsulated feed supplements segment (BCP Ingredients). The Company operates four subsidiaries, all of which are wholly owned: BCP Ingredients, Inc. (BCP), Balchem Minerals Corporation (BMC), BCP St. Gabriel, Inc. (BCP St. Gabriel) and Chelated Minerals Corporation (CMC). In August 2006, Balchem acquired from BioAdditives, LLC, CMB Additives, LLC and CMB Realty of Louisiana, an animal feed-grade aqueous choline chloride manufacturing facility and related assets located in St. Gabriel, Louisiana. In May 2007, the Company completed acquisition of the European-based choline chloride and methylamines businesses of Akzo Nobel Chemicals S.p.A. in Marano Ticino.

It’s a bit difficult to get a good grasp of what this company actually does but SmallCapInvestor.com recently wrote an outstanding research piece on the company.  It does require registration to read the entire article but it’s worth it if I’ve piqued your interested.
FUNDAMENTALS: 

Balchem (BCPC) is a diamond in the rough with the combination a history of strong earnings growth but virtually no Wall St. coverage.  That’s a good thing for self investors like you and I because once Wall St starts covering it with more analysts, the stock will continue to rise in my opinion.  Over nearly the last decade, this is a company that has posted year over year revenue growth in each and every year.  With the exception of 2003, it has done the same with EPS growth with an average in the 20 – 25% range.  That’s expected to continue in 08 with estimates calling for growth of 23%.  Margins have been quite good throughout it’s history, fluctuating between 10 – 13% and well above the industry average.  Return on Equity is more impressive at 19% indicating a strong management team.  All in all, this company isn’t an exceptional grower but one with exceptional consistency for such a small company. 

TECHNICAL:  

BPCP is a thin stock, trading just 70K shares a day so it will be prone to higher volatility on a day to day basis.  Over the long term though, this is a stock that has been in a steady uptrend for several years now, dating back to early 1999.  In that time, the stock has soared from just 1.50 a share to its current levels above 20.  Wow!  Taking a look at the daily chart below, you see that the stock broke out to a new all time high in December.. .then the market sell of hit and BCPC was far from immune.  It brought the stock back all the way to its long term upward trend line where once again (as it has for the past 9 years) found support and is again chugging right along.  Today, it surged again off that 200 day moving average with very heavy volume.  It probably goes on to form a new base from this point point forward but I’d be looking to add shares on any pull back from here as close to support levels as possible.  This is the kind of stock that is good for scaling into.  Adding small positions on pull backs.  Then, should the market get going again and the stock breaks out from a new base, you can add shares their as well with a nice profit cushion in the bag.

 
SELFINVESTORS RATING: With a total score of 50/60 (25/30 for fundamentals, 25/30 for technical), Balchem (BCPC) is a very good SelfInvestors leading stock and should be near the top of any watch list.

Full Disclosure/Disclaimer: The stock of the day is by no means a buy recommendation.  Please do your own research and make a personal decision based on your own tolerance for risk.  I currently do not own a position in Balchem (BCPC). 

Technicals Improving, But Significant Risk Remains

The Fed induced capitulation gave way to a quick ramp up in the market off an oversold bottom but it didn’t long for traders to lock in profits as poor economic news poured in.  Just as the conviction behind buying levels reveals much about the health of the overall market, the conviction behind the selling does the same. 

The technical action last week was encouraging.  Some fear crept back into the market on Tuesday’s nearly 400 point Dow plunge, but as I mentioned in the after market report that day, there was a divergence between price and volume.  The selling intensity was not characteristic of institutions dumping positions left and right.  To me, it looked like healthy selling following, a V like spike up off the bottom.  Notice that over the next 3 days, the market stopped the bleeding almost immediately despite a significant futures sell off following a poor Cisco outlook.  That action on Thursday was a good indication that maybe buyers are beginning to return.  I remember reading all the doom and gloom regarding Cisco on some of the discussion boards with calls for a drop below 20.   Cisco closed in the green for the day with a massive day of capitulation.   It was significant for Cisco, for tech and the Nasdaq in general. 

Let’s take a quick look at the charts….

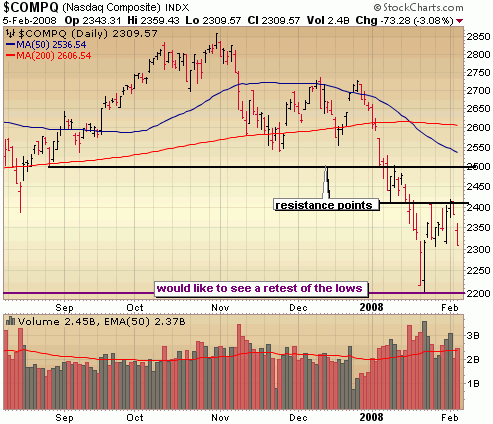
The Nasdaq looks mighty close to bottoming, but if in fact that is the case we need to get some big buying follow through soon.  That revesal off the lows on Thursday with heavy volume was in my mind a telling sign that bulls are resuming some control at least in the short term.  I do believe that the odds of a rally here are significantly greater than another leg down below key support of 2200 but much risk remains.  This is still a headline driven market with no leadership.  Keep that in mind when making trading decisions.  If the Nasdaq can take out 2425, look for a run to 2500.

I like the healthy retracement of the initial surge off the bottom.  Notice that buy volume has been overshadowing sell volume.  There is short term support in the S&P at 1325 so taking out that level and closing below that level would indicate that a test of the lows  around 1275 are likely.  Again, I think big buying needs to happen quickly (sometime next week) or testing the lows of this correction (or worse) becomes much more likely.

You see the Dow is about at the half way point of a retracement as well and could very well yo yo back and forth between support and resistance as the market sorts out a bottom down here.  Volume levels do indicate more bullishness, but institutions need to step in and start doing some buying soon or we’re testing the lows around 11500 – 11750.

 ::: Model Portfolio :::

** This section will now appear as a separate report to be published on most Wednesdays

The Self Investors Model Portolio wrapped up 2007 with a 30.2% gain.  Would you like to receive buy and sell alerts within minutes (NEW! now get them via instant messaging in near real time) of each transaction in the portfolio?  You can receive these along with ALL of the tracking tools and reports with the very popular Gold membership.  Don’t delay, get started today and join me for many more highly profitable months here at SelfInvestors.com.

::: Best/Worst Performers :::

– Top 10 Performing Industries For the Week –

1. Wholesale – Other: 2.75%
2. Medical Laboratories & Research: 2.55%
3. Medical Practitioners: 2.30%
4. Home Health Care: 2.05%
5. Drug Related Products: 1.50%
6. Drug Delivery: 1.10%
7. Entertainment Diversified:  .85%
8. Medical Instruments & Supplies: .65%
9. Medical Equipment Wholesale: .35%
10. Independent Oil & Gas: .25%

– Top 10 Worst Performing Industries For the Week –

1. Semiconductor – Memory Chips: -15.35%
2. Residential Construction: -14.45%
3. Credit Services: -11.05%
4. Recreational Vehicles: -10.70%
5. Banks – SE: -10.25%
6. Toy & Hobby Stores: -10.05%
7. Heavy Construction: -9.90%
8. Cement: -9.55%
9. Home Furnishing Stores: -9.20%
10. Farm Products: -9.10%

– Top 5 Best Performing ETFs For the Week –
 
1. US Natural Gas (UNG)  7.50%
2. Powershares Agriculture (DBA) 4.80%
3. Powershares Commodity (DBC) 4.70%
4. US Oil (USO) 3.45%
5. Ishares Silver (SLV) 2.45%

– Worst 5 Performing ETF’s –

1. SPDR Homebuilders (XHB) -14.60%
2. Ishares Home Construction (ITB) -12.60%
3. 
Chile Fund (CH) -10.90%
4. Market Vectors Global Alernative Energy (GEX)  -10.10%
5. iPath
India (INP) -9.85%

:::  IPO’s Worth Watching for This Week :::

This section will now appear as a separate post on Mondays.

While 2008 should be a much slower year for IPO’s considering the deterioration of the market, there will continue to be some good companies coming to market here and there.  I’ll be highlighting the best IPO’s every Monday.

::: Upcoming Economic Reports (2/11/2008– 2/15/2008) :::

Monday:         None
Tuesday:       Treasury Budget
Wednesday:  Retail Sales, Business Inventories, Crude Inventories
Thursday:      Trade Balance, Initial Claims
Friday:            Export/Import Prices, Capacity Utilization, Industrial Production,
Mich. Sentiment

::: Earnings I’m Watching This Week :::

Monday:
Qiagen (QGEN)

Tuesday:
Rick’s Cabaret (RICK)

Wednesday:
Nvidia (NVDA), First Solar (FSLR), The Navigators (NAVG), Baidu.com (BIDU), Healthcare Services Group (HCSG), Genzyme (GENZ), Rio Tinto (RTP), Millicom Intl (MICC)

Thursday:
Bucyrus (BUCY), Capella Education (CPLA), Chipotle Mexican Grill (CMG), Strayer Education (STRA), Hittite Microwave (HITT)

Friday:
Abercrombie and Fitch (ANF), Diana Shipping (DSX), Yingli Green Energy (YGE)

::: In Case You Missed It – SelfInvestors Blog Entries of the Past Week :::

1. Not So Super Tuesday But Selling Constructive

2. Solera Holdings (SLH) One To Watch After Strong Earnings

3. Model Portfolio Update: Big Tech Is Killing Me

4. WMS Industries (WMS) Breaks out to All Time Highs On Earnings

5. China Oil Perspective – CNOOC (CEO), Petrochina (PTR) & China Petroleum (SNP)

6. Vanguard Mutual Funds Tops in 07

Not So Super Tuesday But Selling Constructive

No, it wasn’t a super tuesday for the market today for bulls, but in terms of finding a bottom it was VERY constructive.  Huh? (more on this below).  The selling started early with the ISM report which showed contraction for the first time in a few years and provided a bit of ammunition for recession forecasters.  With Merrill Lynch predicting another inter-meeting Fed rate cut, maybe we’ll also see Jim Cramer making another irresponsible, irrational exclamation of a market soaring to new heights after another surprise Fed rate cut.  It’s hard to say, but one thing is for sure – if you make investment decisions based on his wild, "sure thing" predictions you will lose and lose big.  I really do want to quit picking on the guy, but he just makes it so difficult.  He needs to be held accountable.

The magnitude of the move down today was a bit surprising, but the move down in and of itself was not.  Carving out a bottom after a major sell off is a long process with many fits and starts.  The Fed induced rally off the bottom led by financials and homebuilders had just simply run out of steam with traders looking for an excuse to take profits into short term overbought conditions.  Today’s selling, believe it or not was positive!  It’s hard to see that if you were too aggressive long, but looking at the sell volume reveals there was little conviction behind the move.  That’s what I call constructive selling!  Let’s have a look.

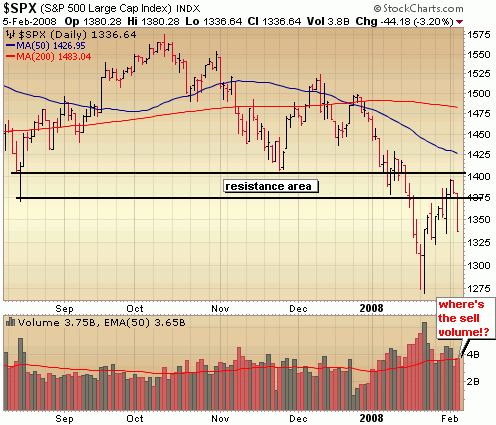
It was easy to get wrapped up in the headlines today – Dow down 370, ISM Index worst in 5 years.. and think another melt down was on the horizon.  I didn’t see it that way today.  Just take a look at the volume levels today in the S&P.  The selling volume was average!  This looked like big profit taking and healthy consolidation of a V like run up off the bottom to me.  A healthy bottom always begins with constructive selling and today, while large in magnitude, could be categorized as just that.  I’ve said it several times here in the past few weeks and I’ll say it again – until we begin to see new leadership emerge in this market, we are not at a bottom.  We could still very well test the lows of this correction.  If you’re not a shorter term trader, you should STILL be out of the market.


I didn’t note in the graphic below but note that again sell volume didn’t correlate with the big sell off today.  A test of the lows would be healthy and go a long way in helping to repair the recent technical damage and shake out a few more sellers… and hopefully begin the process of producing new leadership in this market.

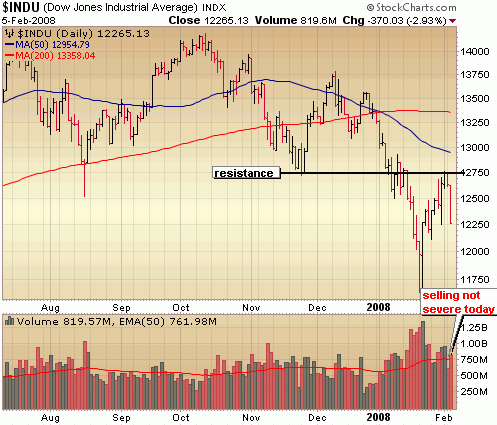
Same thing for the Dow.  The sharp, V like move off the bottom simply wasn’t sustainable and the ISM report this morning just provided an excuse to take profits en masse.

::: Major Indices Performance – The Numbers :::

(Note: volume averages are based on the average over the past 50 days)
Data as of 4:00EST – End of Day February 5th, 2008

Nasdaq: DOWN 3.08% today with volume 1% ABOVE average
Nasdaq ETF (QQQQ) DOWN 2.85%, volume 11% ABOVE average
Dow: DOWN 2.93%, with volume 8% ABOVE the average
Dow ETF (DIA): DOWN 2.44%, with volume 2% BELOW the average
S&P ETF (SPY): DOWN 2.68%,  with volume 27% ABOVE the average
Russell Small Cap ETF (IWM): DOWN 2.56%, with volume 31% ABOVE the average

::: SelflInvestors Leading Stocks :::

The Self Investors Leading Stocks Index is comprised of stocks in the Breakout Tracker, which is a database of the fastest growing companies near a breakout or having already broken out of a base.  There continues to be no leadership in this market and that was reflected today with Self Investors Leading Stocks down significantly more than the general market.

Summary:

* Decliners led Advancers 239 to 16
* Advancers were up an average of 1.62% today, with volume 34% ABOVE average
* Decliners were down an average of 4.17% with volume 8% above the average
* The total SI Leading Stocks Index was DOWN 3.8% today with volume 9% ABOVE average

::: Where’s the Money Flowing :::

Many investing websites provide leading industries based on price performance alone. However, without accompanying volume levels, this can sometimes be misleading.  The only way that I know of to gauge industry/sector strength WITH volume levels is through the analysis of ETF’s.  A couple years ago this was not possible, but as more traders/investors use ETF’s they become a much better tool for gauging the health of the market and seeing where the money is flowing (or not flowing).  Using the proprietary SelfInvestors Demand Indicator score which measures price and volume movements, I’m able to quickly see which sectors/industries are seeing the greatest inflows of cash.  For a detailed look at how I go about gauging sector/industry strength please see the following post: http://selfinvestors.com/si/industry_tracking/

* Current Leading Sectors/Industries (over last 30 trading days):  
Agriculture, Commodities, Gold, Bonds
                                          
* Current Lagging Sectors/Industries (over last 30 trading days): 
Global Energy, Utilities, Aerospace/Defense, Broadband, Clean Energy

* Today’s Market Moving Industries/Sectors (UP):
None

* Today’s Market Moving Industries/Sectors (DOWN):
Broker/Dealers, Nuclear Energy, Telecom, Energy, Financials

::: Stocks :::

The stocks section will be an area where I highlight one stock selected from a group of stocks moving up with volume well above average and most likely breaking out of a base or consolidation.  No major moves in leading stocks to speak of today.

Rate Cut Rollercoaster; Jobs Data Awaits

If I were a bear I’d probably bury my cash in a hole (can bears bury things?) and hibernate for 3 months, but I’m neither bear nor bull, choosing to be objective through chart analysis.  Lately..  ‘er should I say for  the past year, that hasn’t been so easy.  There is a reason why I’ve been recommending for the past few months that most investors stay out of this market for now.  Volatility, irrationality, manipulation, rumor, Fed/government bailouts, blah, blah.. and that thing called a bear market.

Today, I thought I was clever.. maybe clever isn’t the word.. but pursuing opportunity in what I thought was sound technical analysis.  It was sound technical analysis, really it was.  Throw that out the window.  Home builders were overbought (up 70 – 80% in 3 weeks!, many were hitting resistance and showing distribution on the daily.  Easy short right?  Wrong.  They defied gravity today and rocketed through the roof with heavy volume, burying me in debris.  I have never. .. Let me repeat. . I have never been as in disbelief as I was watching those builders today.  I know..fed cut.. stimulus package…. how could I short the builders in this environment?  Trusting the technicals usually treats me well, but they won’t always and they didn’t today.  I was reminded of one my rules which I broke today.  Don’t make significant trading decisions on the day of or the day after a Fed announcement.   Tomorrow is a new day.. perhaps a day when the technicals will prevail and I obey my rules.  Discipline, discipline, discipline.

For the second day in a row it was a vomit inducing roller coaster ride.  250 point swing yesterday, 400 points today.  Yesterday signaled distribution, today signaled accumulation.  It continues to be difficult to know which way to trade but one thing is for sure.  Anything affected by rate cuts – financials, home builders and gold, have been soaring.  Not much else is working and there continues to be no leadership.  Yes, cash is still the best place to be for most.  Tomorrow could be another wild ride as the market (for some reason) seems to trade big off the unemployment reports.  Strap on the belts and enjoy the show from the sidelines.  Now where did I put that gin and pepto cocktail.

::: Major Indices Performance – The Numbers :::

(Note: volume averages are based on the average over the past 50 days)
Data as of 4:00EST – End of Day January 31st  2008

Nasdaq: UP 1.74% today with volume 19% ABOVE average
Nasdaq ETF (QQQQ) UP 1.71%, volume 41% ABOVE average
Dow: UP 1.67%, with volume 25% ABOVE the average
Dow ETF (DIA): UP 1.79%, with volume 62% ABOVE the average
S&P ETF (SPY): UP 1.82%,  with volume 48% ABOVE the average
Russell Small Cap ETF (IWM): UP 2.48%, with volume 20% ABOVE the average

::: SelflInvestors Leading Stocks :::

The Self Investors Leading Stocks Index is comprised of stocks in the Breakout Tracker, which is a database of the fastest growing companies near a breakout or having already broken out of a base.  With beaten down stocks leading the way in this bear market rally, leading stocks didn’t fare all that well today, significantly lagging the general market

Summary:

* Advancers led Decliners 187 to 69
* Advancers were up an average of 2.79% today, with volume 24% ABOVE average
* Decliners were down an average of 2.51% with volume 68% above the average
* The total SI Leading Stocks Index was UP 1.36% today with volume 35% ABOVE average

::: Where’s the Money Flowing :::

Many investing websites provide leading industries based on price performance alone. However, without accompanying volume levels, this can sometimes be misleading.  The only way that I know of to gauge industry/sector strength WITH volume levels is through the analysis of ETF’s.  A couple years ago this was not possible, but as more traders/investors use ETF’s they become a much better tool for gauging the health of the market and seeing where the money is flowing (or not flowing).  Using the proprietary SelfInvestors Demand Indicator score which measures price and volume movements, I’m able to quickly see which sectors/industries are seeing the greatest inflows of cash.  For a detailed look at how I go about gauging sector/industry strength please see the following post: http://selfinvestors.com/si/industry_tracking/

* Current Leading Sectors/Industries (over last 30 trading days):  
Agriculture, Gold Miners, Commodities, Gold, Bonds
                                          
* Current Lagging Sectors/Industries (over last 30 trading days): 
Energy, Utilities, Aerospace/Defense, Broadband, Clean Energy

* Today’s Market Moving Industries/Sectors (UP):
Homebuilders, Retail, Cosumer Discretionary, Financial

* Today’s Market Moving Industries/Sectors (DOWN):
Oil Services, Energy

::: Stocks :::

The stocks section will be an area where I highlight one stock selected from a group of stocks moving up with volume well above average and most likely breaking out of a base or consolidation.  There just aren’t many (should say any) leading stocks breaking out to new highs or on the verge of doing so, but here’s a short list of leading stocks that moved up with volume today and are above both moving averages. 

In order of fundamental rank:

Mastercard (MA)
CyberSource (CYBS)
Helmerich & Payne (HP)
Allergan (AGN)
Investment Technology (ITG)
Green Mountain Coffee Roasters (GMCR)
Greif (GEF)

Officially a Bear Market, Now Where’s the Bottom?

Recent discussion has revolved around whether this is a bear market or not.   Well, I think that debate can officially be put to rest now.  This is a bear market and has been for at least a couple weeks after the major indices broke key long term trendlines.  Of course, now the debate turns to "Are We At a Bottom?" following the massive capitulation early last week following the emergency Fed rate cut.  That isn’t such an easy question to answer, but we can remind ourselves of some of the characteristics of a bottom.

First of all a bottom is a process, often a long one following the kind of severe technical damage we’ve seen over the past few week.  Bottoms typically occur once everyone quits talking about when it will happen and we are a long ways off from that.  We are no doubt in the early stages of a bottom forming process that will take months to sort out. 

Significant rallies can occur in a bear market.  The spike in fear as measured by the VIX this week and subsequent capitulation sets us up for some kind of a rally over the coming weeks, but I think buying into long term positions is a mistake.  It just provides "trading" opportunities on the long side.  It’s important to shift focus from a predominant core strategy of adding to winning long positions on the dips to a strategy of initiating shorts on any bumps up (in addition to locking in short term long trade profits).  If you don’t have a successful short strategy you better be preserving cash and limiting your trading to just "dabbling" on the long side. 

I personally am being cautious on the long side until I see further evidence of some stability in the market (ie. light volume selling) followed by some follow through buying by the institutions.  I never like to see big reversals off the highs like we saw on Friday, but the volume came in much lighter than in previous days.  That’s a start, but this market is still too dangerous to get aggressive with.  Given that the Fed decision is on Wednesday and the tendency for the market to whipsaw in the days following, I may just hold off on aggressive trading until the following week.  The bottom line for most people is to keep sitting on your cash until the dust settles a bit. 

It’s a BARE market.  There is absolutely no leadership right now and very little opportunity on the long side which can be seen in my watch lists.  I maintain a top shorts and top longs watch list that I update every single day and watch in real time during the trading day.  Months ago there were nearly 3 great long opportunities for every short.  That has reversed and now I’m seeing 2 great short opportunities for every long.  You have to take what the market gives you.  While the market remains oversold and potentially bottoming over the intermediate term, the short side is going to be the place to be over the next several months.  Until I begin to see a flurry of new leaders breaking out of healthy bases, we aren’t at a bottom.  It’s as simple as that. 

 ::: Model Portfolio :::

** This section will now appear as a separate report to be published on Wednesdays

The Self Investors Model Portolio wrapped up 2007 with a 30.2% gain.  Would you like to receive buy and sell alerts within minutes of each transaction in the portfolio?  You can receive these along with ALL of the tracking tools and reports with the very popular Gold membership.  Don’t delay, get started today and join me for many more highly profitable months here at SelfInvestors.com.

::: Best/Worst Performers :::

– Top 10 Performing Industries For the Week –

1. Residential Construction: 28.75%
2. Surety & Title Insurance: 27.05%
3. Banks – SE Region: 18.25%
4. Savings & Loans: 15.15%
5. Banks – Mid Atlantic: 14.00%
6. Auto Dealerships: 13.90%
7. Toy & Hobby Stores:  12.85%
8. Apparel Clothing: 12.65%
9. Home Furnishing Stores: 11.90%
10. Sporting Goods Stores: 11.90%

– Top 10 Worst Performing Industries For the Week –

1. Diagnostic Substances 13.15%
2. Personal Computers: -12.65%
3. Heavy Construction: -9.50%
4. Health Care Plans: -8.10%
5. Drug Manufacturers – Major: -7.45%
6. Specialized Health Services: -6.80%
7. Water Utilities: -6.45%
8. Medical Equipment Wholesale: -6.45%
9. Drug Manufacturers – Other: -6.00%
10. Drugs – Generic: 5.85%

– Top 5 Best Performing ETFs For the Week –
 
1. Ishares Homebuilders (ITB)
21.00%
2. SPDR Homebuilders (XHB) 18.70%
3. KBW Regional Banking  (KRE) 10.40%
4. KBW Bank (KBE) 9.45%
5. HLDRS Regional Banks (RKH) 9.25%

– Worst 5 Performing ETF’s –

1. SPDR Biotech (XBI) -8.65%
2. PowerShares Dynamic Biotech (PBE)
-8.25%
3. Ishares Health Care (IHF)  -7.90%
4. HLDRS Pharma (PPH)
  -7.40%
5.
Ishares Germany (EWG)  -7.20%

:::  IPO’s Worth Watching for This Week :::

This section will now appear as a separate post on Mondays.

While 2008 should be a much slower year for IPO’s considering the deterioration of the market, there will continue to be some good companies coming to market here and there.  I’ll be highlighting the best IPO’s every Monday.

::: Upcoming Economic Reports (1/28/2008– 2/1/2008) :::

Monday:         New Home Sales
Tuesday:       Durable Orders, Consumer Confidence
Wednesday:  GDP, Fed Rate Decision
Thursday:      Personal Income/Spending, PCE Inflation, Initial Claims, Chicago PMI, Crude Inventories
Friday:            Auto / Truck Sales, Nonfarm Payrolls, Construction Spending, ISM Index

::: Earnings I’m Watching This Week :::

Monday:
Chattem (CHTT), American Express (AXP), VMWare (VMW)

Tuesday:
CyberSource (CYBS), 3M (MMM), Centex Homes (CTX), Emc Corp (EMC), OptionsExpress (OXPS), Yahoo (YHOO)

Wednesday:
Covance (CVD), Altria Group (MO), Amazon (AMZN), Pulte Homes (PHM), Starbucks (SBUX), Boeing (BA), United Parcel (UPS)

Thursday:
Intuitive Surgical (ISRG), Green Mountain Coffee (GMCR), Google (GOOG), Dolby Laboratories (DLB), Monster Worldwide (MNST), Cameron Intl (CAM), Nasdaq (NDAQ), Hologic (HOLX), Mastercard (MA), Abaxis (ABAX)

Friday:
NYMEX Holdings (NMX), MF Global (MF), Exxon Mobile (XOM)

::: In Case You Missed It – SelfInvestors Blog Entries of the Past Week :::

1. Subprime Mortage Meltdown on 60 Minutes

2. Portfolio Update: Hello I Have Losses

3. Rick Santelli Calls Out Cramer

4. Upcoming IPO’s – RMG, HOO & IPCM

5.
Fed to the Rescue, Capitulation Day But BE PATIENT

6. ETF Trends & Observations: Gold, Oil, Banks, India, China & More

Fed to the Rescue, Capitulation Day But BE PATIENT

Whenever you have extreme moves in the markets, emotions run high.  You can see that clearly in a quick run through the blogosphere.  When the overseas markets began selling off and our own US futures sold off in tandem, the web was a buzzin.  Trash talking ensued from those who have been short, calls for a crash were common.  Would the Dow hit 10,000 before it’s all said and done?  The emails came in wondering what the heck to do.

It’s the kind of thing you see at bottoms.  Throw in the fact that the major indices were flashing oversold signals and the VIX was sure to spike at the open and you had a perfect recipe for a big flush out of sellers and resulting capitulation.  However, I have to admit I was concerned this morning about a potential crash.  Hank Paulson was was reiterating that the economy was strong blah blah blah.  Was this it?  Where was the Fed.  With the Dow taking out 12,000, the Nasdaq taking out 2300 and S&P 1300 the only way to avoid a meltdown today was massive Fed action.  .. and there it came.  Why the Fed has been hinting at a big cut and waited so long is the billion dollar question but 75 bp cut and the Fed saves the day.  A reactionary rather than a proactive cut, but futures took off ..
but only briefly.  We were right back to where we started.  Dow down over 400, Nasdaq 70, S&P 65. 

Uh oh, didn’t work this time.  The biggest cut in decades ahead of next week’s meeting and the market isn’t impressed.  The crash scenario is still alive and well but it’s no time to panic.  I emailed members last night and ran through some scenarios and what I planned to do but most of all it served as a reminder to avoid panic and remain cool headed if you have long positions.  It is critical to give the market 30 minutes to one hour to sort itself out at the open.  If you did that you were in good shape and avoided selling positions at what might have been the lows.

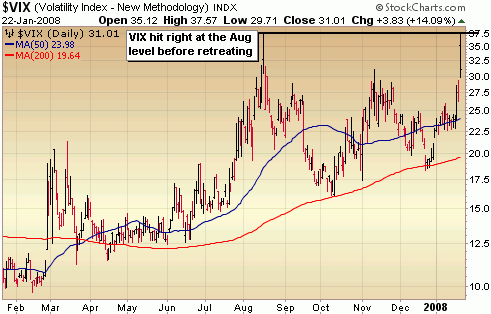
Just as the Volatility Index spiked to levels not seen since the low of last August (see below), buyers stepped in right from the open and pushed the indices well off their lows creating the potential for a capitulation day.  The gains of the day held up very well and we still closed near the highs of the day, but the lack of a stampede of buying into the close casts a shadow over today’s move.  We are not out of the woods yet and you should not be getting aggressive on the long side.  Institutions did not step up and buy into the close.

Today was a good start though.  I’d like to see a retrace of today’s move with light selling volume followed by some kind of confirmation day.  Then a big 2% move or more with volume higher than the day before.  Until that happens, cash remains the best place to be.   Remember that we’re just now getting into the bulk of earnings and as was seen with Apple (AAPL) after the bell today it’s going to be a mine field this quarter. 

There currently is no leadership in this market and good trade setups on the long side are few and far in between.  Wait for new quality bases to form and new leadership to emerge.  There will be plenty of time to profit.  Patience. 

::: Major Indices Performance – The Numbers :::

(Note: volume averages are based on the average over the past 50 days)
Data as of 4:00EST – End of Day January 22nd 2008

Nasdaq: DOWN 2.04 today with volume 37% ABOVE average
Nasdaq ETF (QQQQ) DOWN 2.58%, volume 81% ABOVE average
Dow: DOWN 1.06%, with volume 70% ABOVE the average
Dow ETF (DIA): DOWN 1.128%, with volume 62% ABOVE the average
S&P ETF (SPY): DOWN 1.01%,  with volume 95% ABOVE the average
Russell Small Cap ETF (IWM): DOWN .71%, with volume 57% ABOVE the average

::: SelflInvestors Leading Stocks :::

The Self Investors Leading Stocks Index is comprised of stocks in the Breakout Tracker, which is a database of the fastest growing companies near a breakout or having already broken out of a base.  Leading stocks didn’t do particularly well but outperformed the tech heavy Nasdaq.  Today’s rally was all about laggards recovering from extreme oversold conditions.

Summary:

* Decliners led Advancers 186 to 72
* Advancers were up an average of 2.4% today, with volume 62% ABOVE average
* Decliners were down an average of 3.25% with volume 58% above the average
* The total SI Leading Stocks Index was DOWN 1.67% today with volume 59% ABOVE average

::: Where’s the Money Flowing :::

Many investing websites provide leading industries based on price performance alone. However, without accompanying volume levels, this can sometimes be misleading.  The only way that I know of to gauge industry/sector strength WITH volume levels is through the analysis of ETF’s.  A couple years ago this was not possible, but as more traders/investors use ETF’s they become a much better tool for gauging the health of the market and seeing where the money is flowing (or not flowing).  Using the proprietary SelfInvestors Demand Indicator score which measures price and volume movements, I’m able to quickly see which sectors/industries are seeing the greatest inflows of cash.  For a detailed look at how I go about gauging sector/industry strength please see the following post: http://selfinvestors.com/si/industry_tracking/

* Current Leading Sectors/Industries (over last 30 trading days):  
Agriculture, Gold Miners, Bonds, Gold
                                          
* Current Lagging Sectors/Industries (over last 30 trading days): 
Broadband, Global Energy, Utilities, Aerospace/Defense

* Today’s Market Moving Industries/Sectors (UP):
Homebuilders, Retail, Real Estate

* Today’s Market Moving Industries/Sectors (DOWN):
Nuclear Energy, Software, Biotech, Broadband, Heath Care Providers, Health Care

::: Stocks :::

The stocks section will be an area where I highlight one stock selected from a group of stocks moving up with volume well above average and most likely breaking out of a base or consolidation.  I’m exhausted tonight so won’t highlight a stock of day today.. There were only two leading stocks above both moving averages and moving with volume today.  Check ’em out  —–

Meridian Bioscience (VIVO) and Yamana Gold (AUY).  I’ll be considering both personally for a purchase soon.

Fear Here? Bottom Near? Look for Massive Capitulation

Nowhere to run to, nowhere to hide.  That was the mantra of last week as the bears ripped the market to shreds.  Just about every ounce of it.  Even Gold and Oil sold off.  Remember the good old days when every time Bernanke spoke, the market rallied.  My how times have changed. 

It is a bear market and has been for close to 2 weeks now as all major indices have now taken out support of more than 4 year trend lines.  In the past four years the strategy was to buy the breakouts and add to positions in strong companies on the dips.  Every market correction no matter how severe was met with ferocious buying, resulting in V like bases.  This time it’s different and bears are firmly in control.  The strategy changes to shorting and/or trimming positions into rallies (although oversold conditions within a bear market do present some short term long opportunities).

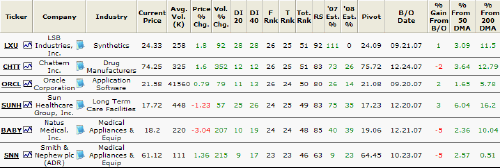
Dips aren’t finding buyers and the market leaders such as Research and Motion (RIMM), Garmin (GRMN), Google (GOOG) and Apple (AAPL) have all but disappeared.  There are no leaders in this market.  Take a look at the Self Investors "Hot Stocks" screen.  This filter spits out a list of companies that are above both the 50 and 200 day moving averages, showing great demand (a SelfInvestors Demand Indicator (DI) score of 20 or above), within a buyable breakout range (within 5% of the pivot point) AND/OR within 4% above the 50 day moving average.  In a nutshell, the best looking leading stocks.  In a typical market there are 20 – 40 candidates in this list.  Currently, there are just 6 – LXU Industries (LXU), Chattem (CHTT), Oracle (ORCL), Sun Healthcare (SUNH), Babus Medical (BABY) and Smith & Nephew (SNN).  Note that 4 of the 6 are medicals.  Keep an eye on medical industries for possible leadership once the market turns around.

Yeah it’s gloomy out there but I think we’re close to an intermediate bottom.  It seems like the market will never rise again, but bears do sleep and we are reaching levels that indicate an oversold rally is near.  Just remember that we really need that big capitulation day to mark a bottom.  Several days ago we got some minor capitulation which led to a short lived bounce and resulting failure.  We need panic selling followed by a stampede of buying, not just bargain hunting and short covering.  Only then can a bottom be in place.

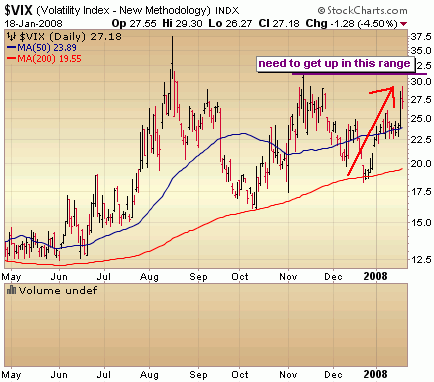
There has been much mention that the Volatility Index isn’t quite at panic levels but the fear is creeping into the market.  Perhaps once the VIX nears those November levels above 30 we can begin talking about a capitulation point. 

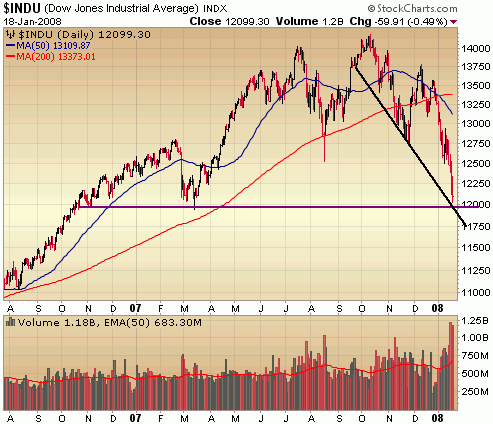
The VIX aside, the price and volume levels of the major indices aren’t indicating a bottom is in place yet, but we are sitting on some key support levels now and an area of a potential rally. 

As you’ll see in the charts of the major indices, we’re hitting support of a downward trend as well as areas of previous consolidation.  Nobody knows if we’ll capitulate, hold at these levels and rally into resistance but we certainly need to begin looking for it.  I’m looking for a test and possible breach of Dow 12,000 to induce some panic selling and induce a big reversal.  I think it happens sooner rather than later.  So look for another 100 – 200 point plunge in the Dow next week and keep an eye on the VIX if it does so.  If it gets above 30, perhaps the buying stampede begins.  To take advantage of any stampede consider trading a leveraged long ETF such as the Proshares Ultra Q’s (QLD) or the Proshares Ultra Russell (UWM)

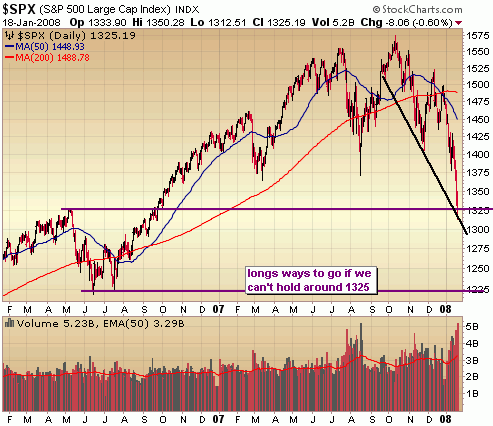
We see the S&P touching the bottom of a downward trend as well indicating a good potential point to begin rallying.  Also note this is the point of the 2006 high, creating another potential support area.  If we can’t hold in the 1300 – 1325 area it’s a long ways down to the next level of support, S&P 1225.  We need to hold here or it’s going to get even uglier.

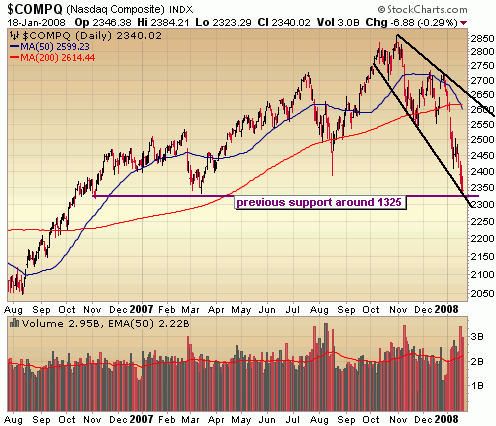
Same story with the Nasdaq.  Support at the bottom of the downward channel and an area of previous consolidation around 2325.  Also a long ways to go if we don’t hold  around these levels.  Next support is at Nasdaq 2000.  Yeah, that’s a nearly 15% additional drop from current levels.  Ouch.  We better get going here.

 ::: Model Portfolio :::

** This section will now appear as a separate report to be published on Wednesdays

The Self Investors Model Portolio just wrapped up 2007 with a 30.2% gain.  Would you like to receive buy and sell alerts within minutes of each transaction in the portfolio?  You can receive these along with ALL of the tracking tools and reports with the very popular Gold membership.  Don’t delay, get started today and join me for many more highly profitable months here at SelfInvestors.com.

::: Best/Worst Performers :::

– Top 10 Performing Industries For the Week –

1. Home Improvement Stores: 5.80%
2. Sporting Goods: 4.70%
3. Trucking: 3.80%
4. Residential Construction: 3.30%
5. Semiconductor – Equipment & Materials: 3.15%
6. Department Stores: 2.65%
7. Jewelry Stores:  2.15%
8. Food Wholesale: 2.10%
9. Specialty Retail: 1.15%
10. Medical Equipment Wholesale: 1.10%

– Top 10 Worst Performing Industries For the Week –

1. Surety & Title Insurance: -25.60%
2. Heavy Construction: -13.40%
3. Agricultural Chemicals: -12.30%
4. Copper: -11.55%
5. Technical Services: -11.40%
6. Oil & Gas Equipment & Services: -11.30%
7. Building Materials Wholesale: -11.15%
8. Wholesale Other: -11.10%
9. Industrial Metals & Minerals: -10.65%
10. Nonmetallic Mineral & Mining: -12.85%

– Top 5 Best Performing ETFs For the Week –
 
1. HLDRS Internet Infrastructure (IIH)
4.60%
2. SPDR Homebuilders (XHB) 3.30%
3. Ishares US Home Construction (ITB) 3.05%
4. Ishares Tawain (EWT) 2.05%
5. HLDRS Retail (RTH)
 1.50%

– Worst 5 Performing ETF’s –

1. iPath India (INP) -22.25%
2. PowerShares Asia (PDQ)
-15.70%
3. Market Vectors Global Alternative Energy (GEX)  -14.30%
4. India Fund (IFN)
  -13.20%
5. 
Powershares Clean Energy (PBW)  -12.60%

:::  IPO’s Worth Watching for This Week :::

This section will now appear as a separate post on Mondays.

While 2008 should be a much slower year for IPO’s considering the deterioration of the market, there will continue to be some good companies coming to market here and there.  I’ll be highlighting the best IPO’s every Monday.

::: Upcoming Economic Reports (1/21/2008– 1/25/2008) :::

Monday:         None – Holiday
Tuesday:       None
Wednesday: Initial Claims, Existing Home Sales, Crude Inventories
Thursday:      None
Friday:            None

::: Upcoming Notable Earnings Reports :::

Monday:
Satyam Computer (SAY), HDFC Bank (HDB)

Tuesday:
Jacobs Engineering (JEC), Fastenal (FAST), Apple (AAPL), Bank of America (BAC)

Wednesday:
Noble (NE), Ametek (AME), Stryker (SYK), Freeport-McMoRan (FCX), Parexel (PRXL), CNH Global (CNH), Energen (EGN), Gilead Sciences (GILD)

Thursday:
Siemens (SI), Nokia (NOK), MEMC Electronics (WFR), Alladin Knowledge Systems (ALDN), Sunpower (SPWR), Danaher (DHR), Microsoft (MSFT), VistaPrint (VPRT)

Friday:
Weatherford Intl (WFT), IDEXX Laboratories (IDXX), Caterpillar (CAT)

::: In Case You Missed It – SelfInvestors Blog Entries of the Past Week :::

1. 2030 Projections for the Oil & Gas Industry

2. Brief Hiatus

3. Take the Fear Out Of Options With a Straddle

4. Final Portfolio Review – SelfInvestors Up 30.2% in 2007