No, it wasn’t a super tuesday for the market today for bulls, but in terms of finding a bottom it was VERY constructive. Huh? (more on this below). The selling started early with the ISM report which showed contraction for the first time in a few years and provided a bit of ammunition for recession forecasters. With Merrill Lynch predicting another inter-meeting Fed rate cut, maybe we’ll also see Jim Cramer making another irresponsible, irrational exclamation of a market soaring to new heights after another surprise Fed rate cut. It’s hard to say, but one thing is for sure – if you make investment decisions based on his wild, "sure thing" predictions you will lose and lose big. I really do want to quit picking on the guy, but he just makes it so difficult. He needs to be held accountable.
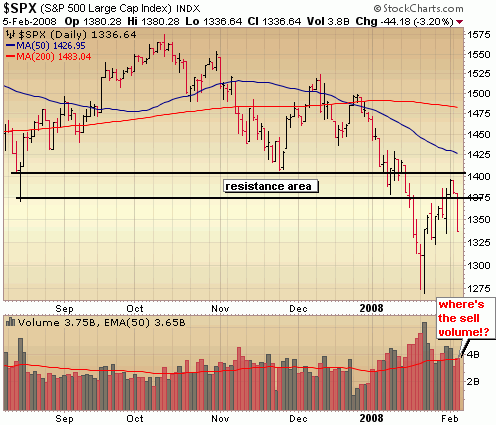
The magnitude of the move down today was a bit surprising, but the move down in and of itself was not. Carving out a bottom after a major sell off is a long process with many fits and starts. The Fed induced rally off the bottom led by financials and homebuilders had just simply run out of steam with traders looking for an excuse to take profits into short term overbought conditions. Today’s selling, believe it or not was positive! It’s hard to see that if you were too aggressive long, but looking at the sell volume reveals there was little conviction behind the move. That’s what I call constructive selling! Let’s have a look.
It was easy to get wrapped up in the headlines today – Dow down 370, ISM Index worst in 5 years.. and think another melt down was on the horizon. I didn’t see it that way today. Just take a look at the volume levels today in the S&P. The selling volume was average! This looked like big profit taking and healthy consolidation of a V like run up off the bottom to me. A healthy bottom always begins with constructive selling and today, while large in magnitude, could be categorized as just that. I’ve said it several times here in the past few weeks and I’ll say it again – until we begin to see new leadership emerge in this market, we are not at a bottom. We could still very well test the lows of this correction. If you’re not a shorter term trader, you should STILL be out of the market.

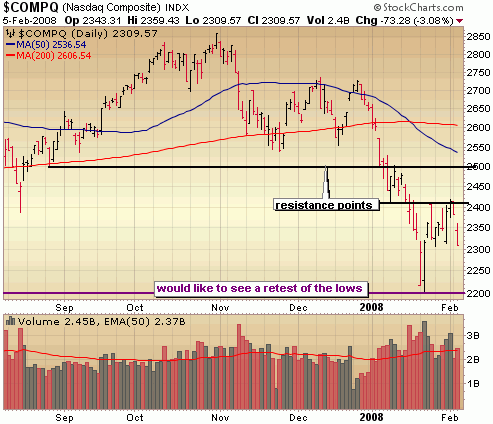
I didn’t note in the graphic below but note that again sell volume didn’t correlate with the big sell off today. A test of the lows would be healthy and go a long way in helping to repair the recent technical damage and shake out a few more sellers… and hopefully begin the process of producing new leadership in this market.

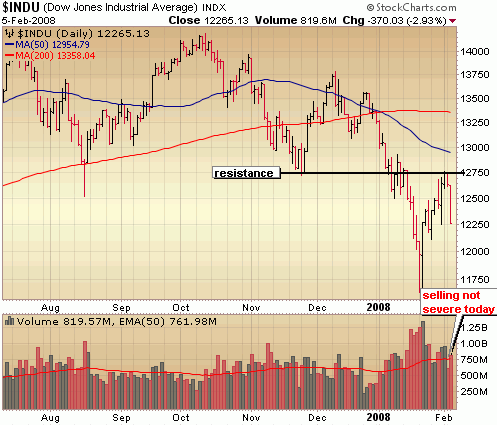
Same thing for the Dow. The sharp, V like move off the bottom simply wasn’t sustainable and the ISM report this morning just provided an excuse to take profits en masse.

::: Major Indices Performance – The Numbers :::
(Note: volume averages are based on the average over the past 50 days)
Data as of 4:00EST – End of Day February 5th, 2008
Nasdaq: DOWN 3.08% today with volume 1% ABOVE average
Nasdaq ETF (QQQQ) DOWN 2.85%, volume 11% ABOVE average
Dow: DOWN 2.93%, with volume 8% ABOVE the average
Dow ETF (DIA): DOWN 2.44%, with volume 2% BELOW the average
S&P ETF (SPY): DOWN 2.68%, with volume 27% ABOVE the average
Russell Small Cap ETF (IWM): DOWN 2.56%, with volume 31% ABOVE the average
::: SelflInvestors Leading Stocks :::
The Self Investors Leading Stocks Index is comprised of stocks in the Breakout Tracker, which is a database of the fastest growing companies near a breakout or having already broken out of a base. There continues to be no leadership in this market and that was reflected today with Self Investors Leading Stocks down significantly more than the general market.
Summary:
* Decliners led Advancers 239 to 16
* Advancers were up an average of 1.62% today, with volume 34% ABOVE average
* Decliners were down an average of 4.17% with volume 8% above the average
* The total SI Leading Stocks Index was DOWN 3.8% today with volume 9% ABOVE average
::: Where’s the Money Flowing :::
Many investing websites provide leading industries based on price performance alone. However, without accompanying volume levels, this can sometimes be misleading. The only way that I know of to gauge industry/sector strength WITH volume levels is through the analysis of ETF’s. A couple years ago this was not possible, but as more traders/investors use ETF’s they become a much better tool for gauging the health of the market and seeing where the money is flowing (or not flowing). Using the proprietary SelfInvestors Demand Indicator score which measures price and volume movements, I’m able to quickly see which sectors/industries are seeing the greatest inflows of cash. For a detailed look at how I go about gauging sector/industry strength please see the following post: http://selfinvestors.com/si/industry_tracking/
* Current Leading Sectors/Industries (over last 30 trading days):
Agriculture, Commodities, Gold, Bonds
* Current Lagging Sectors/Industries (over last 30 trading days):
Global Energy, Utilities, Aerospace/Defense, Broadband, Clean Energy
* Today’s Market Moving Industries/Sectors (UP):
None
* Today’s Market Moving Industries/Sectors (DOWN):
Broker/Dealers, Nuclear Energy, Telecom, Energy, Financials
::: Stocks :::
The stocks section will be an area where I highlight one stock selected from a group of stocks moving up with volume well above average and most likely breaking out of a base or consolidation. No major moves in leading stocks to speak of today.