Category Archives: Weekly/After Stock Market Review Archives

Every Sunday evening a full market review is sent to members of SelfInvestors.com which provides commentary on the technical and economic picture, a review of the SelfInvestors Model Portfolio, the best/worst performing industries and ETF’s for the week, IPOs to watch, upcoming economic reports as well as notable earnings reports. In addition, on days when the market makes a significant move I’ll highlight the technical action discussing price/volume movements and support/resistance levels, industries/sectors leading and lagging the market as well as a Stock of the Day. In the past these were sent in the middle of the trading day but I’ve since begun publishing them and sending them to members after the market closes. These reports will be archived here as well.

Market Recap SelfInvestors Style: Panic, Capitulation, Retrace = Buy (little)

I’m alive, really .. but barely.  It’s been a crazy few weeks with the gyrating market and a spike of new members here at SelfInvestors.com but I assure you that posting will resume more frequently very soon.  Lots to catch up on.. now where was I last here at the blog….

Ah, in my last full market report on September 7th, I thought the market would test the July lows and test it did in a big way.  I haven’t done a good job of updating on the market action here recently, but have been on top of it with my members (remember, you can receive my near nightly reports for free by registering at the top left).

I’d like to recap my notes to members over the past few weeks, then provide a look at the current market action and where we might be headed from here.

A day after my last full report, Fannie and Freddie were bailed out and the resulting move had me a bit surprised, but mentioned to members "Remember a few things – we are still in a bear market and there is absolutely little to no leadership.  Tomorrow’s action will be very important.  I always like to see what the market does AFTER a major news event or Fed decision.. it’s often much more telling.  So we wait…."

Indeed, the action the following day on September 9th was telling and a complete reversal of the temporary Fannie/Freddie bailout euphoria as the market plunged big with heavy volume. In my email to members.. "Today’s move was obviously a big negative if you’re a bull.  While volume didn’t come in heavier than yesterday (so technically not considered distribution), it was way above average so I’ll go ahead and call it what it is.. institutional selling.  I still believe the indices are poised to test the July lows at some point.  Who knows.. they may just do that tomorrow.  Please remain extremely careful down here.. 100% cash isn’t a bad place to be while the market negotiates another bottoming attempt."

Following a few days of relative stability, the market again took a turn for the worse on Sept 15th as Lehman collapsed and AIG was on the brink, which prompted me to send an email to my members titled "Who’s Controlling Your Financial Future".  I’m including it here in its entirety.

"First of all I want to congratulate you if you’ve taken the time out
of your busy week each week to spend the 5 minutes to read my
reports.  You likely watched today’s plunge in the market with no
worry, knowing your portfolio was intact, possibly even making money.
I have been stressing the importance of moving to cash particularly
in the last few weeks as the market became much more uncertain.  No,
I’m not a market magician, not a guru, just a guy who happens to
trade for a living based on what the charts are telling me.  There is
no magic involved, just price and volume, support and resistance.  I
just try to relay that information to you in a concise manner a few
times a week.  I know that many will delete my reports as soon as
they arrive, but if I can hammer home the idea that yes you can time
the markets to a certain degree and preserve that hard earned capital
to just a few people, then I will continue to do what I do.  I’d
love to hear how you are faring in this market, so feel free to drop
me a line.

Of course, I don’t need to spend any more of your time rehashing
today’s events.  You can hear all about it on the evening news.  My
job is to help make you money and preserve your capital because quite
frankly Wall St. and the Jim Cramers of the world aren’t going to do
that for you.  If the tech crash less than 10 years ago and financial
crash of today aren’t enough to convince people of that, I don’t
know what will.  It’s time to take control of your own account and
trade for yourself. 

Lately I’ve been thinking of those that are retired and trusting
their retirement accounts will be there for them.  These people
don’t check their accounts on a daily  basis because they trust.
They believe, because Wall St has ingrained it in them for so many
years, that there are "safe" investments that will provide nice
returns if you just hold them for the long haul.  Let me ask you –
wouldn’t you have considered a Washington Mutual safe? How about
Citigroup? AIG?  I hope that the general investing public now
realizes that few investments are safe for the long haul.

It’s hard to see what good can come from this financial disaster
with so many lives ruined (at least in a financial sense) but I
always believe that things happen for a reason with a much better
situation when the dust clears – as cliche as that sounds.  Wall St
was way overdue for a wake up call after years of extraordinary greed
and arrogance and you can’t help but think that new rules and
regulations will now pave much of Wall St, leading to a stronger
institution.  That being said, I my heart goes out to those that
spent so many years at firms like Bear and Lehman, trusting that
their leaders wouldn’t run the company into the ground.  Prison
should be the only option for those inept CEOs.

If you have been hurt financially by the events of the past year,
keep your head up and take some important lessons away.  I also
encourage you to take the next step and take control of your own
account.  It’s empowering and financially rewarding with the right
guidance.  If you’re willing to take that step I can get you headed
in the right direction, just let me know. 

Switching gears a bit, I’d like to talk briefly about today’s
market action.  Yes it was ugly.  More importantly, the S&P took out
the July low and closed at the low of the day with heavy volume.
What this does unfortunately is set us up for further deterioration
in the coming days.  On the bright side, the Nasdaq and Dow are still
holding up above the July lows so we’ll need to watch these levels
tomorrow right along with the VIX which looks poised and ready to
test the levels of the Aug 07, Jan 08 and March 08 correction bottoms
around 35 -37.50."

It didn’t take long before all the indices took out the July lows and appeared headed for the abyss.  Two days later on September 17th, growing concerns about the financial markets caused widespread panic with the indices closing at the lows of the day with heavy volume and no major support levels intact.  It certainly created a situation where murmurs of a market meltdown became more widespread on that Wednesday evening.  I mentioned this to members..

"Certainly, taking out the lows of yesterday sets the market up for
the possibility of another big plunge down, but there are some silver
linings to point out.  For one, the VIX is nearly at levels not seen
since Jan 08 and Aug 07.  The VIX currently sits at 36.22 and will
need to hit 37.50 to touch the level of those previous correction
bottoms.  However, I want to point out that at the 2001 and 2002
bottoms, the VIX spiked to above 55.  The Dow would need to plunge
another 1500 – 2000 points to reach that level.  It "could" happen
at some point, but lets zero in on at that 37.50 level first and see
how the market reacts to that level.  Another positive is that Jim
Cramer, who is quite possibly the worst market timer (at least
visible one) that has ever lived, doesn’t believe this market is
done going down.  I tend to agree, but hey I’m trying to find some
positives from today.. it aint easy.

Tomorrow will obviously be a very important day.  Remember though..
it’s not how we open, but how we close.  Until we start seeing a
trend of institutions buying into the close, this market isn’t going
anywhere.  I wouldn’t mind seeing the market down a few hundred more
in the morning, the VIX touching 37.50, followed by sustained buying
throughout the day for another day of capitulation.  .. but of course
the market doesn’t care what I want."

Thursday morning, after an initial rise, the market fell off a cliff and panic ensued with the VIX ("fear index") rising to levels not seen since the market crash of 2001/2002 which created the possibility of capitulation…  then news that the UK was banning short selling and Paulson working on an RTC type fix for banks and brokerages broke, sending shorts scrambling as the day ended in dramatic capitulation.  My email to members titled "Extreme Fear? You Betcha, Capitulation? You Betcha summed up the days action:

"Heading into today we had that VIX spike and major plunge in the indices yesterday to contend with, setting us up for the potential of some kind of wash out.  I felt like we were close.  I mentioned the doom and gloom of Jim Cramer last night and working late last night I couldn’t help but notice the story on Nightline about the "market in crisis".  They were interviewing CNBC talking heads including Cramer and discussing the collapse of AIG, Lehman, etc.  The world was coming to an end and Nightline was there with the story.. Read any major newspaper and the headlines were the same.  When you see this kind of negativity headlining the major news networks and newspapers, the average person becomes aware, creating a situation where everyone who has wanted to sell has done already done so.

Quite frankly, I was disappointed with the open as the indices jumped right out of the gate.  I really wanted to see a quick flush out right at the open.  It wasn’t long before I got my wish.  The indices turned tail, not only erasing a 200 point gain, but closing in on a loss of 200 by mid day as the VIX ("the fear index") broke through 37.50 (where it topped during the Aug 07 and Jan 08 bottoms) and touched 42.  The fear was here and everywhere.  Putnam Investments announced that were closing an institutional money market fund due to significant redemption pressure.  My concern at the time was that the VIX would want to test the area round 50, which it tested during the 2001/2002 market crash.  For that to happen, the Dow would have had to plunge another 400 points from the lowest levels of the day.

That may have very well happened if not for news out of the UK that it was halting all shorting on financial stocks until January.  That seemed to put a floor under the market for the time being and the market recovered quickly.  The icing on the cake for today’s dramatic reversal was news that Hank Paulson was working on an RTC type fix for banks and brokerages in order to clear their balance sheets of toxicity.  That sent shorts, who have had a field day this year, scrambling to cover positions.

Today was huge.  It’s a tremendous start to finding a bottom in this market and the lows of the day could very well be a lasting bottom.  What we got today was capitulation on a grand scale which changes the game for me.  Instead of sitting largely on the sidelines, I’m now going shopping and looking to scale into a few more long positions but only on orderly pull backs.  There is no reason to chase this move because there will be plenty of opportunity.. be patient, wait for you entry and don’t be afraid to initiate a position (albeit a smaller one that you would initiate in a bull market).  "

Now obviously a recap of what happened to the market in the past isn’t going to help make you money in the market next week but I wanted to recap my notes to members over the past couple weeks because it helps illustrate the kinds of emotions I was going through, the importance of fear as illustrated by the VIX and newspaper/TV headlines , the importance of how the market closes each day (not where it trades intraday)… oh and Jim Cramer as the ultimate contrarian indicator 🙂

So where do we stand now?  This market is certainly on much better footing now than it was on Wednesday night/Thursday morning of last week following that dramatic day of capitulation and it has changed the game for me somewhat, but I am being cautious.  I wanted to see an orderly retracement of that big move on Thurs & Friday in order to add a bit more skin into the game on the long side and we are getting it now.  I actually added a long position in the semiconductors near the close today but may hold off on additional long exposure until the rescue plan is passed.

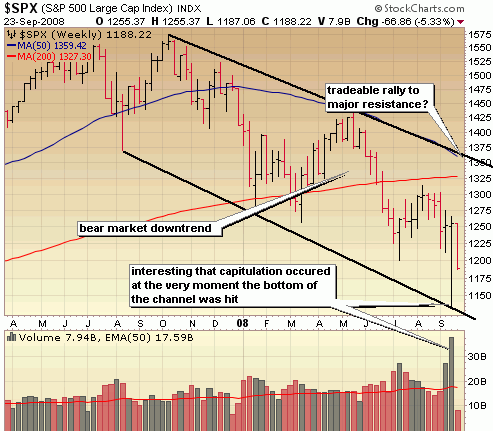
Let’s take a look at the charts of the indices.  I’m using the weekly charts of the indices this week to get a better sense of the bigger picture.  The big picture is the large downward "bear market" channel that has been carving out since late last year, finding support and resistance along the way.  With Thursday’s capitulation move off the bottom of the channel, we find ourselves in a situation with good potential for a tradeable rally to the next level of major resistance which would most likely come in the area around S&P 1325 in another month or so. See how we have retraced about half of that weekly capitulation move?  This is the point where I want to put a little skin in the game on the long side.  By no means am I getting overly aggressive though.. this is STILL a bear market and should be respected. 

92308_spweekly

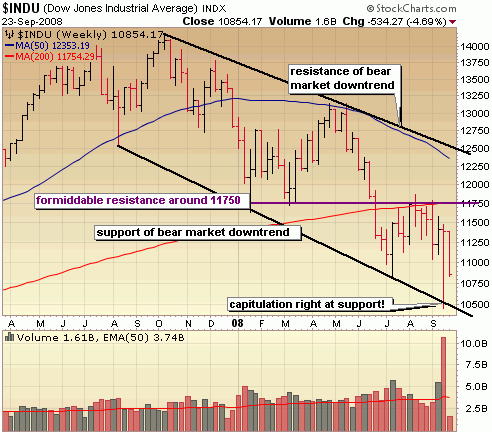
You see a nearly identical situation in the Dow with a capitulation move off support of the bottom of the channel last week and retracing some of that move this week.  So, major support around 10500 and the first major level of resistance around 11750 (previous resistance and the 200 dma on the weekly) .. if it can clear that, look for a move to test the top of the channel around 12250.

92308_dowweekly

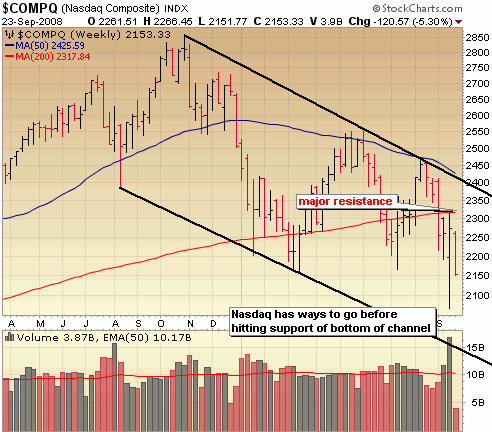
The Nasdaq is much further up in its channel currently and that’s a bit of a concern because it doesn’t have much room to run before hitting major resistance.  The area around 2325 – 2350 is going to be mighty formidable resistance but that’s still a nice 200 point pop from current levels, so certainly a tradeable rally.  I would like to see the Nasdaq close at 2200 or higher by the end of the week because it hasn’t closed below that level on a weekly basis during the correction of 2008.

92308_nazweekly

That wraps it up for now.. please continue to be careful out there.  Don’t be afraid to put a bit of skin into the game now on the long side, but by no means take excessive risk!  That means smaller positions, fewer positions and absolutely no margin!  I’d even advocate sticking to ETFs for the time being, which carry considerably less risk than an individual stock.

::: Model Portfolio :::

** This section will now appear as a separate report about every other Wednesday. 

The Self Investors Model Portolio wrapped up 2006 with a gain of 27.6%, 2007 with a gain of 30.2% and is more than 10% ahead of the S&P in a very difficult 2008.  This is a REAL portfolio with position sizing and features annualized returns of 24%.

Would you like to receive buy and sell alerts in the Model Portfolio within minutes (NEW! now get them via instant messaging in near real time) of each transaction?  You can receive these along with ALL of the tracking tools and video reports with the very popular Gold membership.  Don’t delay, get started today and join me for many more highly profitable months here at SelfInvestors.com.

::: Best/Worst Performers :::

– Top 10 Performing Industries For the Week –

1. Mortgage Investment: 42.00%
2. Silver:  29.70%
3. Gold: 23.80%
4. Banks – SE: 21.20%
5. Semis – Memory Chips: 19.45%
6. Nonmetallic Mineral Mining: 14.75%
7. Oil & Gas Drilling & Exploration:  11.95%
8. Toy & Hobby Stores: 11.70%
9. Pollution & Treatment Controls: 10.80%
10. Music & Video Stores: 10.65%

– Top 10 Worst Performing Industries For the Week –

1. Processing Systems & Products: -13.15%
2. General Entertainment: -9.30%
3. Health Care Plans: -9.10%
4. Packaging & Containers: -8.60%
5. Printed Circuit Boards: -8.40%
6. Data Storage Devices: -8.30%
7. Electronic Stores: -7.70%
8. Dairy Products: -7.60%
9. Publishing – Books: -6.65%
10. Office Supplies: -6.60%

– Top 5 Best Performing ETFs For the Week –

1. Central Fund of Canada (CEF) 29.00% 
2. Market Vectors Gold Miners (GDX) 25.30%
3. iShares Silver (SLV) 21.90%
4. PowerShares Precious Metals (DBP) 17.10%
5. Asa Gold (ASA) 16.60%

– Worst 5 Performing ETF’s –

1. Chile Fund (CH) -6.70%
2. HLDRS Retail (RTH) -5.95%
3. iShares US Healthcare (IHF) -4.50%
4. iShares US Consumer (IYC) -4.40%
5. SPDR Select Consumer (XLP) -4.35%

::: Upcoming Economic Reports (9/22/2008- 9/26/2008) :::

Monday:        None
Tuesday:       None
Wednesday:  Existing Home Sales, Crude Inventories
Thursday:      Durable Orders, Initial Claims, New Home Sales
Friday:           GDP (final)

::: Earnings I’m Watching This Week :::

Tuesday: FactSet (FDS), Lennar (LEN)

Wednesday: Copart (CPRT), Nike (NKE)

Thursday: Accenture (ACN), Chattem (CHTT), CRA International (CRAI), Research In Motion (RIMM)

Friday: KB Home (KBH)
BAC Buys Merrill, Lehman On the Brink, Fed Decision & CPI Tues

No detailed market report this week – I’ll hold off for a few days until the Lehman, Merrill issues (updated: BAC buys Merrill) get sorted out.. of course the July lows will be the critical hold area. 

Fed rate decision and CPI Tuesday and earnings out of Goldman, Morgan Stanley and Lehman this week so remaining on the sidelines for the most part continues to be the best strategy.

::: Model Portfolio :::

** This section will now appear as a separate report about every other Wednesday. 

The Self Investors Model Portolio wrapped up 2006 with a gain of 27.6%, 2007 with a gain of 30.2% and is more than 10% ahead of the S&P in a very difficult 2008.  This is a REAL portfolio with position sizing and features annualized returns of 24%.

Would you like to receive buy and sell alerts in the Model Portfolio within minutes (NEW! now get them via instant messaging in near real time) of each transaction?  You can receive these along with ALL of the tracking tools and video reports with the very popular Gold membership.  Don’t delay, get started today and join me for many more highly profitable months here at SelfInvestors.com.

::: Best/Worst Performers :::

– Top 10 Performing Industries For the Week –

1. Food Wholesale: 7.79%
2. Air Delivery & Freight Service:  7.75%
3. Residential Construction: 7.50%
4. Banks – Mid Atlantic: 7.20%
5. REIT – Hotel/Motel: 6.40%
6. Manufactured Housing: 6.10%
7. Banks – Southeast:  5.50%
8. Regional Airlines: 5.20%
9. Auto Parts: 5.20%
10. Banks Pacific: 5.10%

– Top 10 Worst Performing Industries For the Week –

1. Mortgage Investment: -50.25%
2. Investment Brokerage – National: -17.60%
3. Internet Service Providers: -11.55%
4. Silver: -10.20%
5. Broadcasting – Radio: -9.70%
6. Investment Brokerage – Regional: -6.90%
7. Personal Computers: -6.90%
8. Resorts & Casinos: -6.20%
9. Nonmetallic Mineral & Mining: -5.70%
10. Semiconductor – Specialized: -5.30%

– Top 5 Best Performing ETFs For the Week –

1. iShares US Home Construction (ITB) 8.75% 
2. iShares South Korea (EWY) 7.75%
3. SPDR Banking (KRE) 7.35%
4. SPDR Homebuilders (XHB) 6.90%
5. Korea Fund (KF) 6.15%

– Worst 5 Performing ETF’s –

1. Herzfeld Cuba (CUBA) -13.40%
2. Indonesia Fund (IF) -11.75%
3. Templeton Dragon Fund (TDF) -11.25%
4. iShares Silver (SLV) -10.65%
5. iShares Dow Jones (IAI) -9.65%

::: Upcoming Economic Reports (9/15/2008- 9/19/2008) :::

Monday:        Capacity Utilization, Industrial Production
Tuesday:       CPI, FOMC Policy
Wednesday:  Building Permits, Housing Starts, Crude Inventories
Thursday:      Leading Indicators, Initial Claims, Philly Fed
Friday:           None

::: Earnings I’m Watching This Week :::

Monday: Titan Machinery (TITN)

Tuesday: Adobe Systems (ADBE), Goldman Sachs (GS)

Wednesday: Morgan Stanley (MS)

Thursday: Lehman Bros (LEH), Oracle (ORCL)

Indices Poised to Test July Lows, Caution Urged

It’s been mighty quiet at the blog here for the past few weeks but more frequent posts will resume now!  I’ve been dealing with some personal stuff and spent nearly two weeks over in Lake Chelan in central WA.  I’m recharged and ready to go!.. as is this market.  Unfortunately that direction appears to be down in the coming weeks which I’ll get into in more detail in a bit. 

To recap:

In my report on Aug 10th titled "Volume Reveals Rally May Be Weakening As Indices Clear Key Resistance", I highlighted the fact that the Nasdaq was weakening after running up more than 10% in a month.

"The Nasdaq is now up more than 10% in one month as it approaches big, bad resistance of the 200 day moving average.  If it does test that level, and I think there is a very good chance that it will, it’s time to lock in profits and get very conservative .. The easy money of this rally has been made, so any further spikes up from here will offer an opportunity to lock in some profit and/or initiate a few short positions.  If you’re not a shorter term trader it’s going to best to just lock in much of your profits and sit tight in cash for a few weeks."

The Nasdaq did end up testing that 200 day moving average and actually moved above it for a brief time as volume continued to diminish.  That was a good time to lock in some hard earned profits and/or begin hedging your bets a bit.  

In that report I also said that ".. 2350 is the new line in the sand for the Nasdaq.  A close below this level with heavy volume would indicate significant weakness and put the Nasdaq back in danger of testing the lows of this correction."

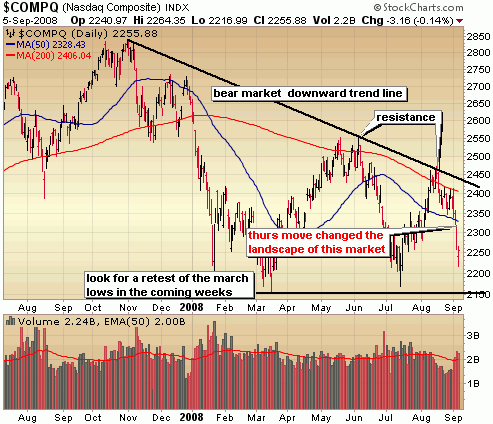
Well, last Thursday that line in the sand was breached with heavy volume so we find ourselves in a position where the indices are likely to test the lows of this correction.

9608_nasdaq

The first sign of potential trouble didn’t occur on Thursday though, it showed up in a high volume reversal on Tuesday.  I sent the following note to my premium members that evening:

"Today was the first day of trading with significant volume in a few weeks and the technical action wasn’t pretty.  I talk a lot about the significance of high volume reversals in the video presentations I do for you with individual stocks but the significance is just as great in the indices.  The Dow nearly touched a gain of 250 in the morning before wiping away that entire gain and then some by the close as institutions used the rally to dump some positions.  That kind of action typically leads to further deterioration ahead, so we’ll need to keep a close eye on how this market responds to today’s weakness in the days ahead.  Another big distribution day or two could spell big trouble for this market as we move into a historically weak month for the market."

It’s important to be extremely cautious now with any bounces from here offering another chance to move more to cash and initiate short positions.

::: Model Portfolio :::

** This section will now appear as a separate report about every other Wednesday. 

The Self Investors Model Portolio wrapped up 2006 with a gain of 27.6%, 2007 with a gain of 30.2% and is more than 10% ahead of the S&P in a very difficult 2008.  This is a REAL portfolio with position sizing and features annualized returns of 24%.

Would you like to receive buy and sell alerts in the Model Portfolio within minutes (NEW! now get them via instant messaging in near real time) of each transaction?  You can receive these along with ALL of the tracking tools and video reports with the very popular Gold membership.  Don’t delay, get started today and join me for many more highly profitable months here at SelfInvestors.com.

::: Best/Worst Performers :::

– Top 10 Performing Industries For the Week –

1. Banks – SE: 12.00%
2. Banks – Pacific:  7.30%
3. Banks – Mid Atlantic: 6.85%
4. Surety & Title Insurance: 6.70%
5. Major Airlines: 6.50%
6. Tobacco Products: 4.65%
7. Semiconductor – Memory Chips:  4.10%
8. Home Improvement Stores: 3.75%
9. Banks – Midwest: 3.60%
10. Specialty Retail: 3.25%

– Top 10 Worst Performing Industries For the Week –

1. Silver: -16.40%
2. Steel & Iron: -15.90%
3. Heavy Construction: -15.40%
4. Gold: -15.30%
5. Industrial Metals & Minerals: -14.50%
6. Copper: -14.00%
7. General Contractors: -13.95%
8. Farm & Construction Machinery: -13.50%
9. Communication Equipment: -13.30%
10. Printed Circuit Boards: -13.05%

– Top 5 Best Performing ETFs For the Week –

1. SPDR Regional Banking (KRE) 5.70% 
2. HLDRS Regional Banking (RKH) 3.40%
3. SPDR Retail (XRT) 2.70%
4. SPDR Financials (XLF) 1.65%
5. iShares Home Construction (ITB) 1.30%

– Worst 5 Performing ETF’s –

1. Market Vectors Coal (KOL) -18.10%
2. Market Vectors Steel (SLX) -15.20%
3. SPDR Metals & Mining (XME) -14.60%
4. Market Vectors Gold Miners (GDX) -13.90%
5. iShares Brazil (EWZ) -13.30%

::: Upcoming Economic Reports (9/8/2008- 9/12/2008) :::

Monday:        Consumer Credit 
Tuesday:       Pending Home Sales, Wholesale Inventories
Wednesday:  Crude Inventories
Thursday:      Export/Import Prices, Initial Claims, Trade Balance, Treasury Budget
Friday:           PPI, Retail Sales, Business Inventories

::: Earnings I’m Watching This Week :::

Tuesday: Aerovironment (AVAV), ARCSIGHT (ARST)

Thursday: Lululemon (LULU)

Volume Reveals Rally May Be Weakening As Indices Clear Key Resistance

On Friday the market managed to put an immediate end to the weakness of the previous day, hold at key short term support levels and stage a big rally as commodities continued to plunge and the dollar continued to strengthen.  In a bit of a divergence of bullish trends, the indices did get through some important resistance levels but did so on curiously weak volume for such a big price move.

I’ll get right into the charts of the indices.

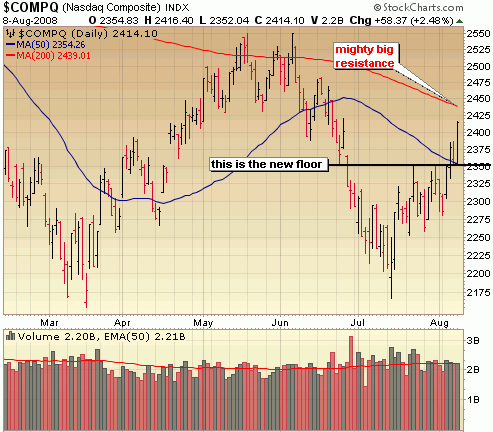
A new floor is developing in the Nasdaq at the 50 day moving average around 2350.  It closed above this area on Wednesday, pulled back on lighter volume Thursday to test this new found support area, then staged the massive rally on Friday to confirm Wednesday’s move.  So, 2350 is the new line in the sand for the Nasdaq.  A close below this level with heavy volume would indicate significant weakness and put the Nasdaq back in danger of testing the lows of this correction.

The Nasdaq is now up more than 10% in one month as it approaches big, bad resistance of the 200 day moving.  If it does test that level, and I think there is a very good chance that it will, it’s time to lock in profits and get very conservative.  This is still a bear market until proven otherwise (a break of the bear downtrend lines) and this rally is a bit too steep to be sustainable.  A pull back to 2350, with some sideways action for a few weeks would be a very bullish way to digest this run up.  If you are just now putting money to work in this rally, I think that’s a very big mistake.  The easy money has been made, so it’s time to start thinking about locking in some profits and soon start thinking about hedging with some short positions.

81008_nasdaqdaily

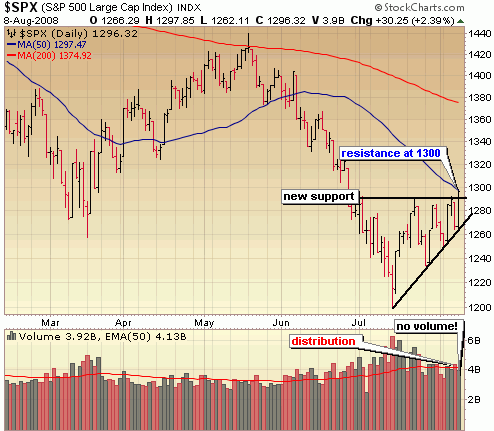
As long as the S&P continues to make higher lows, it’s tough to take on a bearish position but there are some concerns up here.  Yes the S&P cleared a key level of resistance on Friday above the July and Aug highs but still faces that 50 day moving average at 1300.  In addition, take a look at the volume levels in the past two trading days as the S&P negotiates tough resistance.  Thursday was a day of distribution and the rally on Friday was really out of the blue in my opinion.  It came just one day after significant distribution AND there really wasn’t much volume behind it.

If the S&P can follow through next week and clear that level of resistance and then hold there, that would be very bullish for this market. At the very least we need to continue making higher lows.  So continue to play a bit on the bullish side until we stop making higher lows, but the farther up we push get increasingly conservative (that means locking in some of those profits!)

8108_spdaily

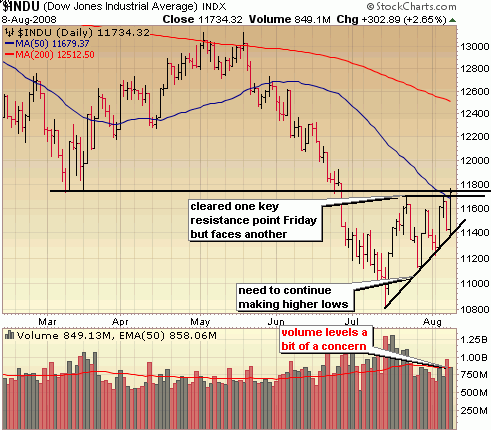
The Dow also cleared the July and Aug highs and took it one step further – it cleared the 50 day moving average to reclaim some important levels of support.  There is still some congestion in the 11800 area though, so I’d like to see it close above this level by the end of the next week to confirm the bullishness of this move.  Again, the volume of the past couple trading days is a concern, so we’ll need to reverse that trend next week with higher volume buying and lower volume selling.

81008_dowdaily

The easy money of this rally has been made, so any further spikes up from here will offer an opportunity to lock in some profit and/or initiate a few short positions.  If you’re not a shorter term trader it’s going to best to just lock in much of your profits and sit tight in cash for a few weeks.

::: Model Portfolio :::

** This section will now appear as a separate report about every other Wednesday.

The Self Investors Model Portolio wrapped up 2006 with a gain of 27.6%, 2007 with a gain of 30.2% and is more than 10% ahead of the S&P in a very difficult 2008.  This is a REAL portfolio with position sizing and features annualized returns of 24%.

Would you like to receive buy and sell alerts in the Model Portfolio within minutes (NEW! now get them via instant messaging in near real time) of each transaction?  You can receive these along with ALL of the tracking tools and video reports with the very popular Gold membership.  Don’t delay, get started today and join me for many more highly profitable months here at SelfInvestors.com.

::: Best/Worst Performers :::

– Top 10 Performing Industries For the Week –

1. Long Term Care Facilities: 22.05%
2. Apparel Clothing:  12.70%
3. Jewelry Stores: 12.65%
4. Department Stores: 12.35%
5. Textile Manufacturing: 12.05%
6. Resorts & Casinos: 11.80%
7. Major Airlines:  11.30%
8. Semis – Memory Chips: 10.50%
9. General Contractors: 10.50%
10. Home Improvement Stores: 10.30%

– Top 10 Worst Performing Industries For the Week –

1. Silver: -15.80%
2. Mortgage Investment: -13.00%
3. Internet Service Providers: -11.85%
4. Agricultural Chemicals: -11.25%
5. Gold: -11.15%
6. Nonmetallic Mineral Mining: -10.20%
7. Oil & Gas Drilling & Exploration: -8.95%
8. Heavy Construction: -8.65%
9. Oil & Gas Equipment & Services: -7.45%
10. Air Services – Other: -7.45%

– Top 5 Best Performing ETFs For the Week –

1. SPDR Homebuilders (XHB) 8.95%
2. HLDRS Semis (SMH) 7.60%
3. SPDR Consumer Discretionary (XLY) 7.55%
4. HLDRS Retail (RTH) 7.35%
5. iShares Semis (IGW) 6.90%

– Worst 5 Performing ETF’s –

1. Market Vectors Gold Miners (GDX) -14.40%
2. Asa Gold (ASA) -13.65%
3. iShares Silver (SLV) -12.10%
4. US Nat Gas (UNG) -11.50%
5. Market Vectors Russia (RSX) -10.60%

::: Upcoming Economic Reports (8/11/2008- 8/15/2008) :::

Monday:        None
Tuesday:       Trade Balance, Treasury Budget
Wednesday:  Export/Import Prices, Retail Sales, Business Inventories Crude Inventories
Thursday:      CPI, Initial Claims
Friday:           Capacity Utilization, Industrial Production

::: Earnings I’m Watching This Week :::

Monday: AirMedia (AMCN), American Oriental Bioengineering (AOB), Fuel Tech (FTEK), Inner Workings (INWK), LDK Solar (LDK), Petrobras (PBR), VAALCO Energy (EGY)

Tuesday: 3SBIO (SSRX), Energy Recovery (ERII), GigaMedia (GIGM), The Hospitalist Company (IPCM), Ituran Location & Control (ITRN), JA Solar (JASO), Watson Wyatt Worldwide (WW)

Wednesday: Canadian Solar (CSIQ), Clean Energy Fuels (CLNE), Ctrip.com (CTRP), Netease.com (NTES), WuxiPharma (WX)

Thursday: Flowers Foods (FLO), Gafisa (GFA), Ricks Cabaret (RICK), Sociedad (SQM), VanceInfo Tech (VIT), Wal Mart (WMT)

Friday: ShengaTech (SDTH)

Oversold Bounce Still In Good Shape, But Lots of Resistance in the Way

It’s been a couple weeks since I’ve taken an in depth look at the market, but not much has happened, so it was a good time for me too take a bit of a break from the blog here and focus on some other projects I’m working on. 

The last time I did a run down of the charts of the indices, we had just catapulted off support of the downward trend as oversold conditions and government/Fed intervention provided a bit of a floor and sent short scrambling.  Now the true test begins.  Now that some of the short covering and bargain hunting is complete, it’s time for the big fellas to step in and do some meaningful buying.

I think the market is set up for  that with the weekly capitulation moves a couple weeks ago, followed by an orderly digestion of those gains.  While some of the price moves over the past several days have been significant, the volume didn’t accompany it which is what you like to see.  There does appear to be an incremental shift from sellers to buyers here, but we need more of a confirmation move over the next week or two. 

Let’s jump right into the indices and have a look at where we’ve been and where we might be headed.  Notice I say "might".  Technical analysis is a powerful tool for gauging probability, not certainty… for you chartist skeptics out there.

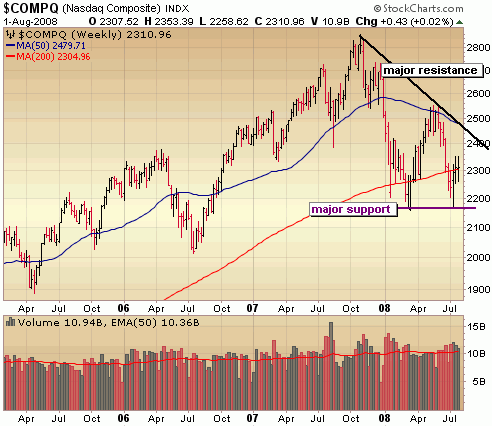
There is very strong support  in the Nasdaq around 2150 – 2170 and it’s critical that we hold that level or we’re looking at a move to the next level of support at 2000.  I personally think the odds are 50/50 of taking out that level and until we break through major resistance of the downward trend line above 2400, I won’t decrease those odds.  We’re in a bear market until proven otherwise.  I was encouraged by the close just a hair above the 200 dma at 2300.  Now lets see if it can hold that level of support and test the downward trend at 2400.  I like  those odds, but the closer we get to the downward trend line the more defensive I’ll get. 

8308_naz

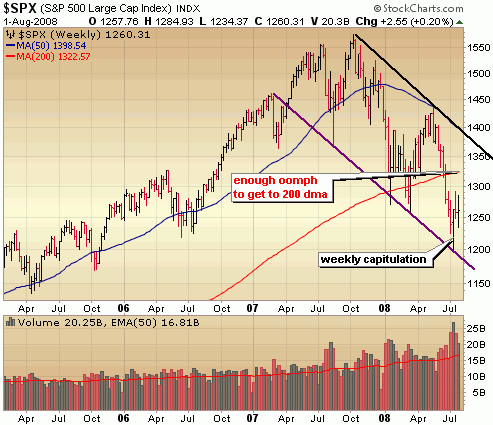
 That really was a massive weekly move off support at the bottom of the downward trend at 1200 and I do think there is enough momentum to test resistance around the 200 day moving average at 1325.  If it can get through that level, look for a test of the top of the downward trend around 1350.  It would still be nothing more than a tradable bear market rally until it convincingly clears the top of that downward trend.  I think we’re really going to have a tough time doing that this year.

8308_sp500weekly

The Dow also capitulated off the bottom of the downward trend (around 10800) with a large price and volume move.  Now we need to see some confirmation and clear the first level of major resistance of the 200 day moving average around 11700.  The longer the Dow stays submerged below that level, the greater the likelihood of another breakdown so we need to get going in the next week or two.  It needs to bust through the ceiling and hold the floor at 11700 – 11750. 

8308_dowweekly

The strategy I’ve employed following that weekly capitulation move is buying high quality, higher priced stocks in leading industries and in smaller quantities than I ordinarily would.  Two examples of recent trades in the Self Investors Model Portfolio include Alcon (ACL) and Accenture (ACN).  The higher we push up, the more likely I am to begin pursuing short positions to hedge.

::: Model Portfolio :::

** This section will now appear as a separate report about every other Wednesday. 

The Self Investors Model Portolio wrapped up 2006 with a gain of 27.6%, 2007 with a gain of 30.2% and is more than 10% ahead of the S&P in a very difficult 2008.  This is a REAL portfolio with position sizing and features annualized returns of 24%.

Would you like to receive buy and sell alerts in the Model Portfolio within minutes (NEW! now get them via instant messaging in near real time) of each transaction?  You can receive these along with ALL of the tracking tools and video reports with the very popular Gold membership.  Don’t delay, get started today and join me for many more highly profitable months here at SelfInvestors.com.

::: Best/Worst Performers :::

– Top 10 Performing Industries For the Week –

1. Surety & Title Insurance: 22.05%
2. Banks – Pacific:  11.20%
3. Savings & Loans: 10.45%
4. Internet Service Providers: 9.45%
5. Paper & Paper Products: 8.35%
6. Auto Parts Wholesale: 6.05%
7. Banks – SE:  6.05%
8. Nonmetallic Mineral & Mining: 6.00%
9. Publishing – Books: 5.75%
10. Consumer Services: 5.45%

– Top 10 Worst Performing Industries For the Week –

1. Drug Delivery: -35.00%
2. Broadcasting – Radio: -8.60%
3. Regional Airlines: -7.45%
4. Auto Manufacturers: -7.10%
5. Computer Peripherals: -6.15%
6. Gold: -5.75%
7. Diversified Investments: -5.65%
8. Cement: -5.50%
9. Multimedia & Graphics Software: -4.80%
10. Internet Info Providers: -4.80%

– Top 5 Best Performing ETFs For the Week –

1. Turkish Invest Fund (TKF) 15.90% 
2. KBW Banking (KRE) 9.25%
3. HLDRS Regional Bank (RKH) 6.65%
4. PowerShares Dynamic Banking (PJB) 5.10%
5. Claymore Global Solar (TAN) 4.70%

– Worst 5 Performing ETF’s –

1. Internet Infrastructure (IIH) -10.10%
2. iShares Australia (EWA) -5.90%
3. iShares Tawain (EWT) -4.90%
4. Asa Gold (ASA)  -4.40%
5. Market Vectors Gold Miners (GDX) -4.20%

::: Upcoming Economic Reports (8/4/2008- 8/8/2008) :::

Monday:        Personal Income/Spending, Factory Orders 
Tuesday:       ISM Services, FOMC Policy Statement
Wednesday:  Consumer Credit, Crude Inventories
Thursday:      Pending Home Sales, Initial Claims
Friday:           Productivity, Wholesale Inventories

::: Earnings I’m Watching This Week :::

Monday: Bankrate (RATE), China Medical (CMED), CommVault (CVLT), China Security (CSR), eResearch (ERES), Genesee & Wyoming (GWR), Intercontinental Exchange (ICE), Life Sciences Research (LSR), Otter Tail Power (OTTR),

Tuesday: Archer Daniels (ADM), Banco Itau (ITU), Central European Distribution (CEDC), Cisco (CSCO), DR Horton (DHI), Marvel Enterprise (MVL), PriceLine.com (PCLN), Skilled Healthcare (SKH), Sun Hydraulics (SNHY), Ultra Petroleum (UPL), WMS Industries (WMS),

Wednesday: Akeena Solar (AKNS), Clayton Williams Energy (CWEI), Clean Harbors (CLHB), Enersys (ENS), Flotek (FTK), FTI Consulting (FCN), GAiam (GAIA), Gerdau (GGB), LMI Aerospace (LMIA), Parexel (PRXL), T3 Energy Services (TTES), Nasdaq Group (NDAQ), Transocean (RIG), Yingli Green Energy (YGE)

Thursday: Aecom (ACM), Ansys (ANSS), Atwood Oceanics (ATW), Deckers (DECK), Divx (DIVX), Exide (XIDE), Hansen Natural (HANS), Natural Gas Services (NGS), SandRidge Energy (SD), Superior Well Services (SWSI), Veolia Environment (VE)

Friday: Beazer Homes (BZH), Darling Intl (DAR)

Avalanche of Earnings, GDP, Employment Numbers on Tap

Sorry, no detailed look at the market this week.. It’s an R&R weekend for me.  I’ll get up an analysis sometime this coming week. 

::: Model Portfolio :::

** This section will now appear as a separate report about every other Wednesday. 

The Self Investors Model Portolio wrapped up 2006 with a gain of 27.6%, 2007 with a gain of 30.2% and is more than 10% ahead of the S&P in a very difficult 2008.  This is a REAL portfolio with position sizing and features annualized returns of 24%.

Would you like to receive buy and sell alerts in the Model Portfolio within minutes (NEW! now get them via instant messaging in near real time) of each transaction?  You can receive these along with ALL of the tracking tools and video reports with the very popular Gold membership.  Don’t delay, get started today and join me for many more highly profitable months here at SelfInvestors.com.

::: Best/Worst Performers :::

– Top 10 Performing Industries For the Week –

1. Manufactured Housing: 20.70%
2. Major Airlines:  17.55%
3. Health Care Plans: 12.20%
4. Medical Practitioners: 11.20%
5. Networking & Comm Devices: 8.25%
6. Computer Based Systems: 7.95%
7. Catalog & Mail Order Houses:  7.55%
8. Resorts & Casinos: 6.85%
9. Biotechnology: 6.40%
10. Auto Dealerships: 5.90%

– Top 10 Worst Performing Industries For the Week –

1. Semis – Memory Chips: -13.15%
2. Gold: -7.95%
3. Savings & Loans: -7.70%
4. Semis – Integrated Circuit: -7.55%
5. Surety & Title Insurance: -6.90%
6. Heavy Construction: -6.30%
7. Oil & Gas Drilling & Exploration: -6.20%
8. Independent Oil & Gas: -6.20%
9. Credit Services: -5.60%
10. Semis Equip & Materials: -5.60%

– Top 5 Best Performing ETFs For the Week –

1. HLDRS Broadband (BDH) 11.15% 
2. HLDRS Biotech (BBH) 10.30%
3. India Fund (IFN) 9.95%
4. iPath India (INP) 9.20%
5. Morgan Stanley India (IIF) 7.90%

– Worst 5 Performing ETF’s –

1. US Nat Gas (UNG) -15.55%
2. Morgan Stanley E. Europe (RNE) -10.95%
3. Market Vectors Russia (RSX) -10.55%
4. SPDR Oil & Gas (XOP)  -8.10%
5. HLDRS Semis (SMH) -7.55%

::: Upcoming Economic Reports (7/28/2008- 8/1/2008) :::

Monday:        None 
Tuesday:       Consumer  Confidence
Wednesday:  ADP Employment, Crude Inventories
Thursday:      GDP (adv), Initial Claims, Chicago PMI
Friday:           Auto/Truck Sales, Nonfarm Payrolls, Construction Spending, ISM Index

::: Earnings I’m Watching This Week :::

Monday: Atheros Communications (ATHR), Authentec (AUTH), CF Industries (CF), HDFC Bank (HDB), Manitowoc (MTW), Plum Creek Timber (PCL), Sohu (SOHU), Mosaic (MOS)

Tuesday: Alpha Natural Resources (ANR), Amedisys (AMED), BEA Aerospace (BEAV), Centex (CTX), Coach (COH), Continental Resources (CLR), Cynosure (CYNO), Double Take (DBTK), Portfolio Recovery Associates (PRAA)

Wednesday: Cleveland Cliffs (CLF), Cameron (CAM), Covad (CVD), Cummins (CMI), Echelon (ELON), First Solar (FSLR), Garmin (GRMN), Hologic (HOLX), Itron (ITRI), Oceaneering (OII), Psychiatric Solutions (PSYS), Rubicon Tech (RBCN), Southwestern Energy (SWN), Starbucks (SBUX), Visa (V)

Thursday: Altria Group (MO), American Ecology (ECOL), Balchem (BCPC), Borg Warner (BWA), Capella Educations (CPLA), Chesapeake Energy (CHK), Chart Industries (GTLS), Cognizant Tech (CTSH), Dolby Laboratories (DLB), Forrester Research (FORR), LKQ Corp (LKQX), Morningstar (MORN), Natus Medical (BABY), Partner Communications (PTNR), Stanley (SXE), United Therapeutics (UTHR), VistaPrint (VPRT)

Friday: None

Weekly Capitulation Off Major Support; Will Drugs & Medical Lead The Way?

In my last weekly report, I mentioned the near vertical drop in the indices as they approached major support areas of a well defined bear market downtrend and to be prepared for a massive snap back rally.  We finally got the long awaited rally this week as better than expected results out of Wells Fargo, JP Morgan and Citigroup and plummeting crude prices helped to ignite the rally.  The question now becomes just how strong a rally was it and does it have legs? Was that Monday low of last week a long term bottom?  I think the chances are good. 

With the indices taking out the previous week’s lows then staging a big rally to close at the highs of the week with record volume, a floor in this market has been created.  We never quite saw panic reach a feverish pitch but the VIX did ramp up above 30 and as you’ll see in the charts below, capitulation in the Dow and S&P on the weekly charts was impressive.  At this point, the only way I see last week’s lows being taken out is if a major bank (Washington Mutual?) or homebuilder goes under which could really ratchet up the panic selling.  I’m not even going to try and put an odds on that happening, but there is some possibility there I suppose. 

As I mentioned to members in an email last week, I’m not chasing the rallies from here, but rather dabbling in long positions on the pull backs.  I’m not willing to get overly aggressive and want to slowly build my long exposure if the pull backs are orderly.  There will be plenty of time to profit and given the fact we are just getting into the bulk of earnings, it makes sense to be patient.  Wait for your price, it will come.  Let’s have a look at the charts of the indices:

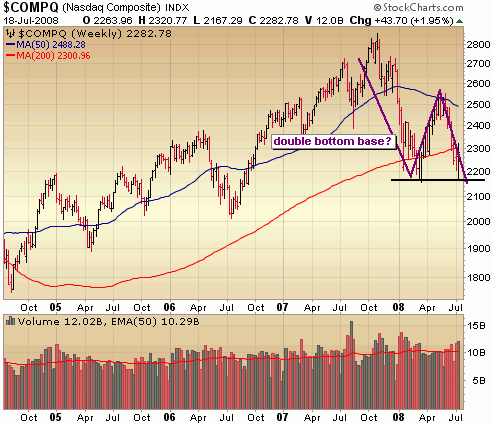
I’ve been discussing the possibility of a big double bottom base in the Nasdaq and that still remains a good possibility.  Notice that the Nasdaq came very close to touching the 2008 lows before reversing sharply mid week.  I would have liked to have seen it take out those lows briefly to shake out a few more weak hands and it still could do that, but that area around 2175 is shaping up to be a very strong level of support.  Not even disappointing results out of Google and Microsoft could put much of a dent in the Nasdaq on Friday, so the market is showing some signs of stabilization and resiliency.

72008_nasdaq

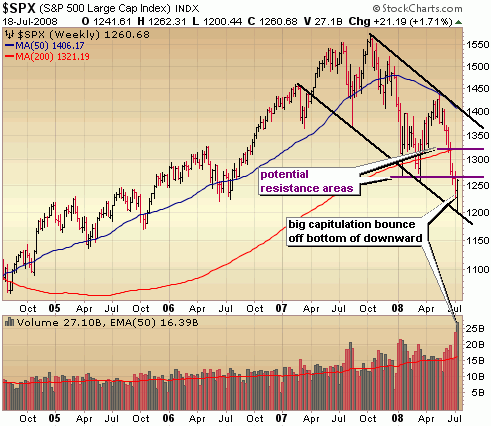
In my last report, I said "I do think we will get a furious rally if and when the S&P touches that channel around 1200.".  The S&P did touch the bottom of this downward channel as you see below and what a furious rally it was.  Note the amount of volume behind the move.  Combine that with the fact that the S&P closed at the highs of the week and you have a recipe for considerable momentum.  That doesn’t mean I’m chasing this rally.  As mentioned above, I’m buying select names on the pull backs with smaller positions.  The S&P cleared the first level of resistance at the March lows but will face some resistance at the Jan lows on Monday.  If it can clear that, there is a good chance of testing the 50 day moving average around 1325, but I do think we’ll rest just a bit before making a serious run at that level. 

72008_sp500

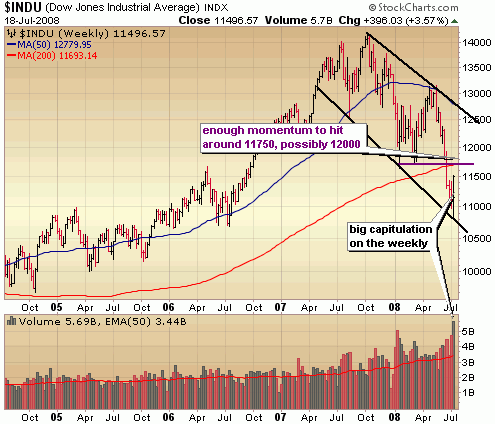
Is it any coincidence the Dow hit right at major support at the bottom of the downtrend and rallied? Not likely!  As with the S&P there was tremendous volume behind this weekly move and with a close at the highs of the week, there is without a doubt enough momentum to carry it up to at least the next level of major resistance around 11750.  We could hit that early next week before taking a breather.

You can clearly see the framework the indices are working within, with major support at the bottom of the downward channel, resistance all the way up to the top.  An end to the bear market can not be declared until this well defined downtrend is broken and I’d be surprised if that happened this year.  Consider last weeks move the setup for a significant tradeable rally within a bear market. 

72008_dow

Commodities continued to unravel last week with much of that money flowing into the beaten down financials and home builders.  The give and take between those two extremes was just a matter of time, but it’s too early to tell if a major correction is underway in commodities AND if this is a bottom in financials.  Although, I think a bottoming out in financials is closer to reality then the beginnings of a major correction in commodities. 

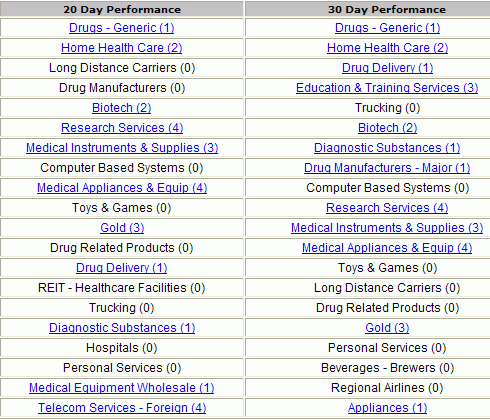
I’m more interested in where new leadership will emerge from and there are some indications that leadership is emerging in medical and drug stocks.  Below are the best performing industries over the past 20 and 30 days (those linked with a number indicate that there are high quality breakout stocks from that industry in the Self Investors Breakout Tracker).  I have found that focusing on trends within the best performers over 20 days allows me to get in on the next area of strength early enough to capture the big moves, but not so early that it ends up being a false alarm.  Over the past 20 trading days, 13 of the top 20 best performing industries are medical/health related.  This strength is confirmed in the 30 day timeframe as well, with half of the best performing industries medical/health related. 

I’m going to provide an Excel download file to all my members tonight or tomorrow afternoon, with about 40 leading companies within the top performing industries over the last several weeks.  If you’d like to download this file it doesn’t cost a thing, just register for the free Bronze membership in the upper right of this page.  If you’re privacy paranoid (although no reason to be, you’re in good hands here at SelfInvestors!) and won’t provide a valid email address here’s a few to chew on (in no way buy recommendations, please do your own research): PRXL, EXAC & SRCL.

72008_topindustries1 

I::: Model Portfolio :::

** This section will now appear as a separate report about every other Wednesday. 

The Self Investors Model Portolio wrapped up 2006 with a gain of 27.6%, 2007 with a gain of 30.2% and is more than 10% ahead of the S&P in a very difficult 2008.  This is a REAL portfolio with position sizing and features annualized returns of 24%.

Would you like to receive buy and sell alerts in the Model Portfolio within minutes (NEW! now get them via instant messaging in near real time) of each transaction?  You can receive these along with ALL of the tracking tools and video reports with the very popular Gold membership.  Don’t delay, get started today and join me for many more highly profitable months here at SelfInvestors.com.

::: Best/Worst Performers :::

– Top 10 Performing Industries For the Week –

1. Major Airlines: 30.81%
2. Banks – SE:  22.15%
3. General Entertainment: 19.00%
4. Mortgage Investment: 18.00%
5. Drugs – Generic: 17.60%
6. Regional Airlines: 16.85%
7. Surety & Title Insurance:  15.65%
8. Investment Brokerages: 14.85%
9. Residential Construction: 14.65%
10. Investment Brokerages – Regional: 14.00%

– Top 10 Worst Performing Industries For the Week –

1. Nonmetallic Mineral Mining: -11.50%
2. Manufactured Housing: -9.50%
3. Industrial Metals & Minerals: -8.90%
4. Independent Oil & Gas: -8.20%
5. Steel & Iron: -8.15%
6. Oil & Gas Drilling & Exploration: -7.15%
7. Agricultural – Chemicals: -6.85%
8. Oil & Gas Refining & Marketing: -5.45%
9. Copper: -5.20%
10. Heavy Construction: -4.95%

– Top 5 Best Performing ETFs For the Week –

1. SPDR Home Builders (XHB) 16.10% 
2. HLDRS Regional Banks (RKH) 15.95%
3. iShares Home Construction (ITB) 15.15%
4. KBW Bank (KBE) 14.50%
5. Turkish Fund (TKF)  13.35%

– Worst 5 Performing ETF’s –

1. Market Vectors Coal (KOL) -12.75%
2. US Oil (USO) -11.05%
3. PowerShares Dynamic Energy (PXE) -10.75%
4. iShares Commodities (GSG)  -9.90%
5. US Natural Gas (UNG) -9.80%

::: Upcoming Economic Reports (7/21/2008- 7/25/2008) :::

Monday:        Leading Indicators 
Tuesday:       None
Wednesday:  Fed Beige Book, Crude Inventories
Thursday:      Existing Home Sales, Initial Claims
Friday:           New Home Sales, Durable Orders

::: Earnings I’m Watching This Week :::

Monday: American Express (AXP), Apple (AAPL),  Bank of America (BAC), Homex (HXM)

Tuesday: AmSurg (AMSG), Axsys Tech (AXYS), CH Robinson (CHRW), Chicago Mercantile (CME), Icon (ICLR), Intuitive Surgical (ISRG), Jacobs Engineering (JEC), Methanex (MEOH), NVR Inc (NVR), Options Express (OXPS), VMware (VMW), Yahoo (YHOO)

Wednesday: Air Products & Chemicals (APD), Airgas (ARG), Alcon (ACL), Baidu (BIDU), Chipotle Mexican Grill (CMG), EMC (EMC), Genzyme (GENZ), Hudson City Bancorp (HCBK), NVE Corp (NVEC), Omniture (OMTR), OSI Pharma (OSIP), Peabody Energy (BTU), Pulte Homes (PHM), Ryland (RYL)

Thursday: 3M (MMM), AsiaInfo (ASIA), Bucyrus Intl (BUCY), Celgene (CELG), Companhia Rio (RIO), Diamond Offshore (DO), Eastman Chemical (EMN), EZcorp (EZPW), Flir Systems (FLIR), Integral Systems (ISYS), Interactive Brokers (IBKR), Life Time Fitness (LTM), Perdigao (PDA), Potash (POT), Stericycle (SRCL), Strayer Education (STRA),  Terra Industries (TRA), Terra Nitrogen (TNH), Dow Chemical (DOW), VCA Antech (WOOF), Vision China Media (VISN), ZOLL Medical (ZOLL)

Friday: Arch Coal (ACI), Honda (HMC), T Rowe Price (TROW)

Shorts Sent Scrambling, But Need More Signs of Bottom

Holy moly, the long awaited oversold snap back rally has arrived! Time to locate those cash bundles under the spare bedroom mattress and buy, buy, buy!  Eh, well not exactly but after 6 consecutive weeks of market declines, it was good to see the green return in a big way.  While I don’t consider myself a bull or a bear, but a momentum trader, I do prefer a market that rises.  It’s quite a bit easier to make money in a rising market. 

Getting the market off on the right foot this morning was the report out of Wells Fargo which beat estimates and increased its dividend.  No it wasn’t a great quarter and profits decreased 21% from the year ago period, but quite extraordinary news under the circumstances and the market is going to reward companies that come out with any kind of positives.  I would imagine that is the largest single day percentage gain in its history (or darn near).  I think we’re really going to start seeing the market separate the wheat from the chaff in the financials, with those responsible financial institutions that largely avoided the sub prime mess seeing exceptional gains over the next few years.  You could put Wells Fargo (WFC) in that category. 

Also aiding equities today was another sharp drop in crude which has fallen about $10 a barrel in the last 2 days.  I’m still riding my DUG for nice profits and looking to lock in around resistance of the 200 day moving average, but it may get a little pull back before it tests that area. 

So what about today’s move on the technical side?  At this point I don’t see this as being a bottoming out move.  There is a ton of money on the sidelines trying to predict a bottom and shorts have to have an itchy trigger finger looking to lock in some great profits in the last few weeks.  There is no doubt that much of today’s rally was due to short covering.  Volume came in lighter than yesterday, so no indication of accumulation by institutions today. 

Much has been made of the VIX in the past few weeks as a bottoming indicator and I’ve certainly had a few emails about whether it’s really all that important.   To that I say yes it’s an important indicator and the fact that more people are watching it makes it even more important, but it is just ONE indicator and a big spike in volatility isn’t required for a bottom, but you do often see a major spike when panic selling kicks in, so it’s something look for.  It did spike a bit on Monday and touched 30 which is getting into an area where fear is escalated, but keep in mind that at major bottoms of the past it has surged as high as 35 – 40 and the volatility trend is still up.  In addition, I just haven’t seen all out panic selling yet, so the potential for one last dramatic move lower is still there.

I’m going to play the market now the exact same way I did off the March bottom.  Begin dabbling on the pull backs with smaller positions than usual.  I will not get more aggressive until a trend of accumulation (high volume buying) and diminished selling emerges.  Considering the major indices kicked off major support levels on Monday I think we are very very close to that, but it is absolutely not the time to add a bunch of long positions.  Patience, patience, patience… there will always be plenty of time to profit and profit big.

Capitulation Averted BUT Prepare For Massive Short Term Rally

What a week, what a Friday.. but we’ve been down this road before.  The constant parade of CEOs and government officials denying there are problems.  The rumors, the manipulation the itchy trigger fingers of traders.  We saw it around the March bottom and one can only hope that we are near the end here at the developing July bottom.  I for one am sick of the irresponsibility of the media in disseminating false information and/or rumors in financial news, but hey anything for a headline right?   It started with the morning headlines that Freddie and Fannie may be bailed out by the government which provided the catalyst for a sustained sell off, but buyers stepped in big after a report from Reuters that Bernanke had provided Freddie and Fannie with access to the discount window (which they later backed down from after the Fed denied such discussions).  As the news drifted to unsubstantiated rumor, much of the gain evaporated, dashing hopes for capitulation.  

Fed spokeswoman Michelle Smith said U.S. central bank officials were following the situation with struggling Fannie Mae and Freddie Mac closely but disputed that access to the discount window had been offered.  "Federal Reserve officials are following the situation closely. However, there has been no discussion with the GSEs about access to the discount window," Smith said in a statement issued on Friday afternoon.

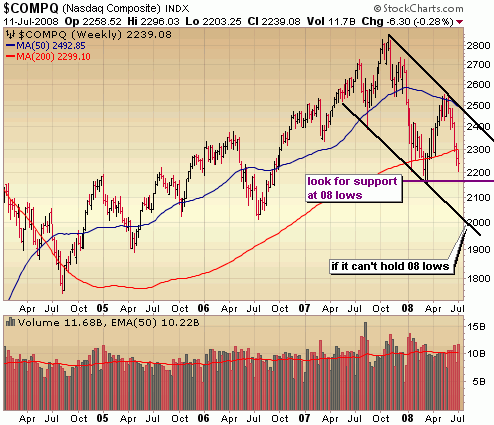
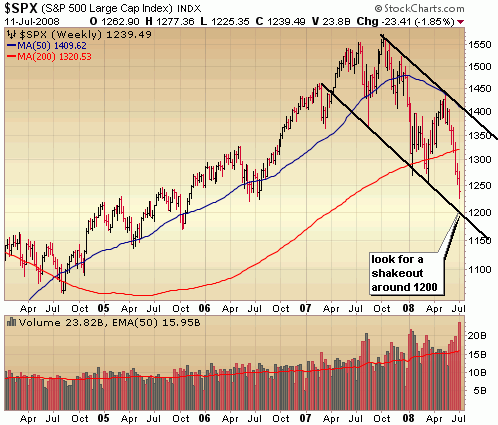
Friday was so darn close to what you could call an important capitulation day, but panic never quite kicked in.  The VIX did come quite close to hitting 30, but the selling was quite orderly throughout.  I really wanted to see a 400 – 500 point move down in the Dow to really flush it out, followed by the kind of buying we saw after the Fed rumor from Reuters.  Friday was a case of both panic selling and institutional buying fizzling out, leaving the market vulnerable to more losses in the short term (perhaps another few percentage points).  However, I do think we are quite close to an intermediate bottom as both the Dow and S&P approach the bottom of their downtrends while the Nasdaq is within shouting distance of the March lows as you’ll see in the charts below.

In the weekly charts of the indices below, the well defined downtrends stand out.. as does the precipitous drop over the past several weeks which is in line with what happened in January.  In the Nasdaq, there is quite a bit of room to run before hitting the bottom of the downtrend, but it does have big support at the March lows just below 2200, so it could certainly hold there and never touch the bottom of the channel again.  So keep an eye out for capitulation in the Nasdaq in the 2175 to 2200 range.

71308_nasdaq

Both the S&P and Dow have taken out the 2008 lows back in March and that really set them up to test the bottom of their downward  trends.  I do think we will get a furious rally if and when the S&P touches that channel around 1200.  So, we’re not quite out of the woods and there is quite a bit of risk of more deterioration, but we’re close.  Hang in there.

71308_sp500

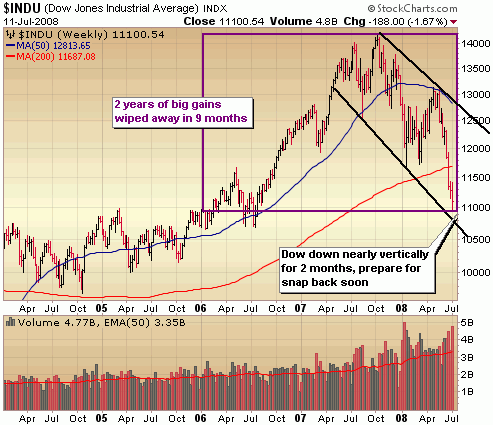
A similar situation in the Dow as it too approaches the bottom of the downtrend with a nearly vertical drop over the past several weeks.  This dramatic move down will not be sustainable for too much longer and it’s just a matter of time before a short covering fueled snap back rally occurs.  It could happen very soon.  If the Dow takes out 11,000 again, keep an eye on the area around 10700.

71308_dow

I want to leave you this week with market summary from Don Worden of Telechart.  The man has a way with words and I particularly liked how he summed up Friday’s action (reprinted with permission):

The market opened in a mood that Alan Greenspan might have described as "irrational despondency." At the outset there seemed to be a widespread preoccupation with the delusion that FANNIE MAE and FREDDIE MAC were heading straight for the bankruptcy pits. You don’t need to be an expert to realize that this is an unthinkable scenario (that could create a calamity greater than the great depression) and that the government would take over those two enormous businesses before they would entertain any idea of letting them go under–should it ever become necessary.

It didn’t help a bit when Treasury Secretary Paulson stated that "no bailout of FANNIE MAE and FREDDIE MAC is on the horizon."  Things got worse when somebody spread a rumor that Israel was setting up an air base in Iraq, in preparation for attacking Iran. This was denied promptly and vehemently by American officials, but nobody seemed to believe them. Not for several hours anyway.  Oil responded predictably to this chaotic scene, but it was the stock market that was bombarded most cruelly in this fusillade of frivolous nonsense. 

It seemed there would be no end to it. The world would simply end in one final conflagration. But then suddenly in the afternoon a Reuters source indicated that FANNIE and FREDDIE would have access to the Fed’s discount window. Stocks responded as if rising from the dead. The Dow rose from down 200 to an actual gain. The assurance that capital would be available to the two lenders if they were in dire need softened concern. The stocks rose.

However, wouldn’t you know that a mob scene doesn’t evaporate that easily. The Fed refused to confirm it would lend to Fannie or Freddie. Stocks simply turned around and went back down.  But in contrast to the scuttlebutt that followed, they didn’t go all the way back down. At the close both the Dow and SP-500 had regained close to half of their earlier losses. The Nasdaq Composite had actually regained 76% of it losses. 

The day was not a bust. Two of the Eight Important Averages ended in the black. Only three of the eight closed down over one percent despite the earlier havoc. Nothing closed down two or more percent. Despite the seemingly irreparable devastation earlier, three Breadth Groupings held positive scores.

::: Model Portfolio :::

** This section will now appear as a separate report about every other Wednesday. 

The Self Investors Model Portolio wrapped up 2006 with a gain of 27.6%, 2007 with a gain of 30.2% and is more than 10% ahead of the S&P in a very difficult 2008.  This is a REAL portfolio with position sizing and features annualized returns of 24%.

Would you like to receive buy and sell alerts in the Model Portfolio within minutes (NEW! now get them via instant messaging in near real time) of each transaction?  You can receive these along with ALL of the tracking tools and video reports with the very popular Gold membership.  Don’t delay, get started today and join me for many more highly profitable months here at SelfInvestors.com.

::: Best/Worst Performers :::

– Top 10 Performing Industries For the Week –

1. Diagnostic Substances: 6.70%
2. Aluminum:  6.30%
3. Drug Related Products: 5.70%
4. Silver: 5.05%
5. Home Health Care: 4.50%
6. Chemicals – Major Diversified: 4.50%
7. Cigarettes:  4.15%
8. Agricultural Chemicals: 4.00%
9. Food Wholesale: 3.70%
10. Metal Fabrication: 3.65%

– Top 10 Worst Performing Industries For the Week –

1. Mortgage Investment: -31.50%
2. Toy & Hobby Stores: -12.00%
3. Specialty Retail: -11.75%
4. Resorts & Casinos: -10.80%
5. Lodging: -10.30%
6. Apparel Clothing: -10.15%
7. Banks – SE: -10.05%
8. Office Supplies: -9.70%
9. Investment Brokerage – National: -9.40%
10. REIT – Hotel/Motel: -8.30%

– Top 5 Best Performing ETFs For the Week –

1. Market Vectors Coal (KOL) 7.95% 
2. Claymore China Real Estate (TAO) 7.50%
3. Morgan Stanley China (CAF) 6.53%
4. iShares China (FXI) 5.90%
5. SPDR China (GXC) 5.20%

– Worst 5 Performing ETF’s –

1. US Natural Gas (UNG) -12.20%
2. iShares Broker Dealers -8.35%
3. Dow Jones Home Construction -8.05%
4. SPDR Homebuilders (XHB)  -7.90%
5. SPDR Financials (XLF) -6.50%

::: Upcoming Economic Reports (7/14/2008- 7/18/2008) :::

Monday:        None
Tuesday:       PPI, Retail Sales, Business Inventories
Wednesday:  CPI, Capacity Utilization, Industrial Production, FOMC Minutes, Crude Inventories
Thursday:      Housing/Building Permits, Initial Claims
Friday:           None

::: Earnings I’m Watching This Week :::

Monday: Genentech (DNA)

Tuesday: CoStar Group (CSGP), Intel (INTC), Johnson & Johnson (JNJ)

Wednesday: Ebay (EBAY), Wells Fargo (WFC), Yum Brands (YUM)

Thursday: Danaher (DHR), Evergreen Solar (ESLR), Gilead Sciences (GILD), Google (GOOG), Merrill Lynch (MER), Microsoft (MSFT), SunPower (SPWR), Coca Cola (KO), JP Morgan (JPM)

Friday: Citigroup (C), Schlumberger (SLB)