Category Archives: Weekly/After Stock Market Review Archives

Every Sunday evening a full market review is sent to members of SelfInvestors.com which provides commentary on the technical and economic picture, a review of the SelfInvestors Model Portfolio, the best/worst performing industries and ETF’s for the week, IPOs to watch, upcoming economic reports as well as notable earnings reports. In addition, on days when the market makes a significant move I’ll highlight the technical action discussing price/volume movements and support/resistance levels, industries/sectors leading and lagging the market as well as a Stock of the Day. In the past these were sent in the middle of the trading day but I’ve since begun publishing them and sending them to members after the market closes. These reports will be archived here as well.

Triple Bottom, Key Reversal Point to Potential Rally

I’ll start out the report this week with a member question because I think it’s a good lead in to what I want to focus on – the technicals.  The question was basically what I thought about Jim Cramer’s prediction that the Dow would drop another 2000 points if GM wasn’t bailed out and his recommendation to sit on the sidelines and/or sell ahead of the news. 

First of all Cramers prediction is just that.. a prediction with a bit of doomsday fear thrown in.  Hey, it makes for a nice headline and gets people talking.  The bottom line is that nobody knows what will happen with GM.   Democrats are in favor of some kind of a bailout as many agree they’re “too big too fail”, with a GM bankruptcy leading to a major domino effect of unemployment.  On the other hand, there are those that would like to see the capitalist system take care of it, rather than prolonging inevitable pain.  As far as an investment strategy goes, it’s tough to disagree with an approach that recommends sitting on the sidelines until the dust clears and for many people that may be the smart way to play.  Continue reading Triple Bottom, Key Reversal Point to Potential Rally

With Obama In, Traders Sell The News; Friday’s Relief Rally Weak

With Barack Obama in as the next President and the uncertainty of the election now over, a new uncertainty has developed in the market with the Dow plunging nearly 1000 points in the two days following the election, setting us up for a possible retest of the lows of the correction in the coming days.

In my last report I warned that the market had come too far too fast with diminishing buy volume and to wait for opportunities on a pull back.  The night of the election, I told my premium members:

“The moment of truth will soon arrive and by tomorrow morning I would imagine we’ll find out who the next Pres is.  I expected a big market rally, but I never believed the market would rally as it has ahead of this election.  Heck, the Nasdaq is now up 6 straight trading days.  The S&P is up 18% in the same time and the Dow is up nearly 1500 points.  Yes, there is some room to run and I suppose the market could be up again tomorrow for the 7th straight day in a row for the Nasdaq, but consider that buy volume continues to diminish across the board with big overhead resistance all the way up.  As I mentioned over IM today, the VIX is also hitting some big support at the 50 dma around 45 indicating traders getting a bit too complacent.  We could also be in for a “sell on the news” situation, particularly if Democrats get the 60 seat majority in the Senate, the threshold needed to overcome filibusters that the minority can use to block legislation. ” Continue reading With Obama In, Traders Sell The News; Friday’s Relief Rally Weak

Indices Hold in Trading Range, Prepare For Post Election Relief Rally

I’ve been mentioning over the past several days that the technical action in the indices has improved enough to where I have begun dabbling on the long side, but we are not out of the woods just yet as indicated by Friday morning’s limit down move ahead of the bell.  Considering Thursday’s minor capitulation move it was a complete surprise to me to see that big gap down at the open with the Nasdaq taking out the October lows.  More of a surprise was the way the day played out.. buyers stepped in right at the open and the rest of the day remained relatively quiet as volume came in fairly light.  A day that should have resulted in a very meaningful move didn’t give us any clues as to what institutions were doing but it was encouraging to see all of the indices hold up above the October intraday lows (the Nasdaq just barely)

Let’s take a quick look at the indices.

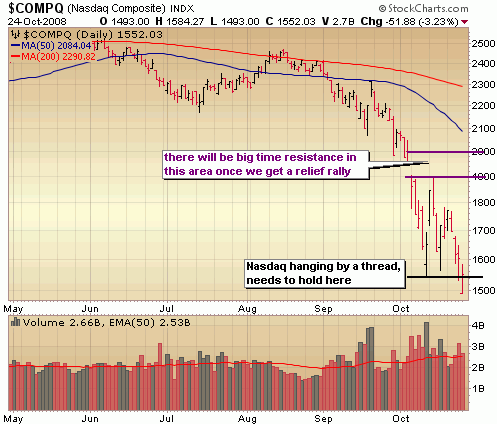
The Nasdaq looked dead in the water early on Friday as it took out the Oct 10 low.  It managed to recover quickly though and closed just barely above that low keeping key support intact by just a thread. It really needs to continue to close above this important threshold so Monday will be very very important. 

102608_nasdaq

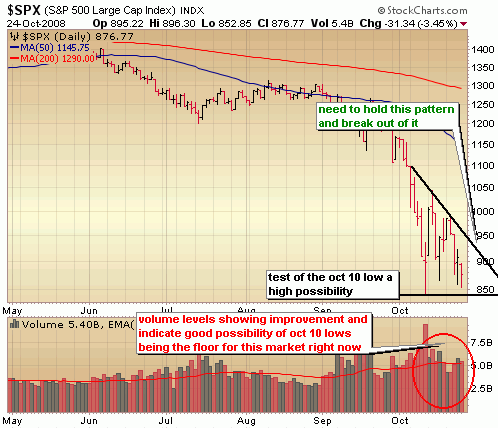
The S&P continues to hold up above the Oct low and volume levels do indicate that buyers are beginning to show some interest down here, but until we break out of the wedge formation with big volume there is always the possibility of one more washout move, particularly considering we haven’t yet had that dramatic day of capitulation.  A big, dramatic day of capitulation isn’t necessary to reach a tradeable bottom but it’s something that occurs quite often after major sell offs, so we have to mindful and prepared for that. 

102608_sp500

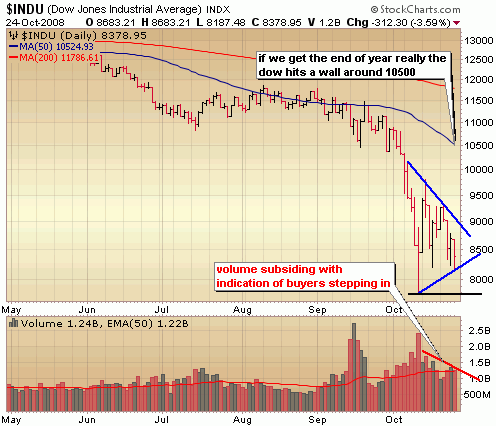
The Dow is carving out a wedge of its own as volume levels improve, but taking out Friday’s lows likely means a test of the October 10 low.  Taking out the October 10 likely means the market is gearing up for one last big push lower which would create a tsunami of buying shortly thereafter.  I am looking for a breakout of the wedge formation as a signal to get more aggressive on the long side.  If that should happen and the Dow runs up into the 10500 range, you better believe I’m locking in profits!

102608_dow

The next week of trading is going to be absolutely critical as the election nears.  The market hates uncertainty and it’s hard to say how much a likely Obama victory is priced in at this point.  A scenario that I see potentially playing out is tighter trading ranges and lower volume as the wedge formation in the Dow and S&P continue to develop.  Once a new President is elected, the market makes a defining move within a day or two.  Given the extreme oversold levels and improving volume levels, I’m still hanging my hat on a healthy relief rally from here to the end of the year.

 ::: Model Portfolio :::

** This section will now appear as a separate report about every other Wednesday. 

The Self Investors Model Portfolio wrapped up 2006 with a gain of 27.6%, 2007 with a gain of 30.2% and is more than 30% ahead of the S&P in a very difficult 2008.  This is a REAL portfolio with position sizing and features annualized returns of 24%.

Would you like to receive buy and sell alerts in the Model Portfolio within minutes (NEW! now get them via instant messaging in near real time) of each transaction?  You can receive these along with ALL of the tracking tools and video reports with the very popular Gold membership.  Don’t delay, get started today and join me for many more highly profitable months here at SelfInvestors.com.

::: Best/Worst Performers :::

– Top 10 Performing Industries For the Week –

1.Gold: 4.85%
2. Data Storage Devices: 3.80%
3. Printed Circuit Boards: 2.75%
4. Banks – Mid Atlantic: 2.20%
5. Accident & Health Insurance: 2.00%
6. Broadcasting – Radio: 1.95%
7. Banks – Pacific:  1.70%
8. Computers Wholesale: .65%
9. Surety & Title Insurance: .50%
10. Silver: .35%

– Top 10 Worst Performing Industries For the Week –

1. Machine Tools & Accessories: -11.00%
2. Semis – Memory Chips: -10.30%
3. REIT – Diversified/Industrial: -9.40%
4. Resorts & Casinos: -9.20%
5. Foreign Regional Banks: -9.15%
6. REIT – Hotel/Motel: -8.85%
7. Gaming Activities: -8.70%
8. Major Airlines: -8.30%
9. Cement: -8.00%
10. Multimedia & Graphics Software: -8.00%

– Top 5 Best Performing ETFs For the Week –

1. Central Fund of Canada (CEF) 6.60% 
2. HLDRS Internet Infrastructure (IIH) 5.35%
3. SPDR Insurance (KIE) 2.75% 
4. Market Vectors Gold Miners (GDX) 2.25%
5. SPDR Gold (GLD) 2.20%

– Worst 5 Performing ETF’s –

1. Central Europe & Russia (CEE) -16.40%
2. Market Vectors Russia (RSX) -12.35%
3. iShares South Korea (EWY) -11.30%
4. iShares Emerging Markets (EEM) -10.30%
5. iShares China (FXI) -10.00%

::: Upcoming Economic Reports (10/27/2008- 10/31/2008) :::

Monday:        New Home Sales
Tuesday:       Consumer Confidence 
Wednesday:  Crude Inventories, Durable Orders, FOMC Rate Decision
Thursday:      GDP (adv), Initial Claims
Friday:           Personal Income, Personal Spending, Chicago PMI

::: Earnings I’m Watching This Week :::

Monday: Atheros Communications (ATHR), Banco Bradesco (BBD), BE Aerospace (BEAV), Buffalo Wild Wings (BWLD), Paraxel (PRXL), Sohu.com (SOHU),

Tuesday: Amedisys (AMED), China Security & Surveillance (CSR), Kansas City Southern (KSU), Vistaprint (VPRT)

Wednesday: Alpha Natural Resources (ANR), Cliffs Natural Resources (CLF), First Solar (FSLR), Forrester Research (FORR), Kirby (KEX), Praxair (PX), Sociedad Quimica (SQM), Visa (V),

Thursday: Balchem (BCPC), Chesapeake Energy (CHK), Digital Ally (DGLY), eResearch (ERES), Intercontinental Exchange (ICE), LKQ Corp (LKQX), Massey Energy (MEE), Morningstar (MORN), Natus Medical (BABY), Psychiatric Solutions (PSYS), Southwest Energy (SWN), Strayer Education (STRA), Sun Healthcare (SUNH), United Therapeutics (UTHR), VisionChina Media (VISN)

Friday: AsiaInfo Holdings (ASIA)

Is Market Prepping For An End Of Year Rally?

Now is the time to begin looking at getting long this market and if we get a big confirmation move within the next week, it may even be time to get a bit aggressive.  About one week ago on October 10th we got a major capitulation move but I was a bit wary of the move due to the late day fizzle and a close in the red for the Dow and S&P.  However, it was enough to propel the Dow nearly 1500 points in just two trading days and close to major resistance levels.  I urged my members to avoid chasing the initial rally if they weren’t already in position. 

"If you did not begin dabbling in positions late last week, it’s critical that you be careful up here.  Do not chase this rally!
We’re up 1500 points already off Friday’s low and while there is room to run in the Dow between 400 – 800 points, it’s best to buy on the significant pull backs."

We got the significant pull back off the initial surge last week and successfully tested the lows on Thursday, reversing with good volume.   I sent the following, in part, to members Thursday night:

"If today’s low wasn’t the bottom, I’m willing to say its darn close.  Today’s move is the kind of move that could help propel the market into a 15 – 20% rally from here to the end of the year, but we’ll need a few more days of light volume on the sell side and another day of accumulation to confirm .  I’ve been less than enthusiastic about previous capitulation attempts of this market, but today’s move was much better as buyers stepped up big all the way to the final bell.  That’s something that had been missing particularly last Friday when we had a similar move, but fizzled at the end of the day.  The only thing wrong with today’s move was the lack of massive volume but it may be enough."

I like this market here and have begun adding more long exposure in recent days, but before I get more aggressive on the long side, we need confirmation of Thursday’s move with a big up day with volume within the next week or two. 

I’ll take another look at the charts in a few days.   Good trading out there this week! 

If you’d like to receive my detailed market reports a few times a week as well some ETF trade ideas, you may sign up in the upper left.  It doesn’t cost a dime!

::: Model Portfolio :::

** This section will now appear as a separate report about every other Wednesday. 

The Self Investors Model Portfolio wrapped up 2006 with a gain of 27.6%, 2007 with a gain of 30.2% and is more than 30% ahead of the S&P in a very difficult 2008.  This is a REAL portfolio with position sizing and features annualized returns of 24%.

Would you like to receive buy and sell alerts in the Model Portfolio within minutes (NEW! now get them via instant messaging in near real time) of each transaction?  You can receive these along with ALL of the tracking tools and video reports with the very popular Gold membership.  Don’t delay, get started today and join me for many more highly profitable months here at SelfInvestors.com.

::: Best/Worst Performers :::

– Top 10 Performing Industries For the Week –

1.Major Airlines: 38.80%
2. Diversified Investments:  26.60%
3. Oil & Gas Pipelines: 22.25%
4. Banks – SE: 20.80%
5. Health Care Plans: 19.40%
6. Air Services – Other: 16.50%
7. Surety & Title Insurance:  14.25%
8. Dairy Products: 14.10%
9. Banks – Midwest: 12.95%
10. Foreign Utilities: 12.85%

– Top 10 Worst Performing Industries For the Week –

1. Silver: -16.65%
2. Long Term Care Facilities: -15.85%
3. REIT – Diversified/Industrial: -14.30%
4. Recreational Vehicles: -13.75%
5. REIT – Retail: -13.45%
6. Gold: -13.05%
7. REIT – Residential: -12.25%
8. Auto Parts: -11.10%
9. Jewelry Stores: -11.00%
10. Auto Dealerships: -10.05%

– Top 5 Best Performing ETFs For the Week –

1. Chile Fund (CH) 31.15% 
2. Morgan Stanley Frontier Markets (FFD) 22.85%
3. Latin America Discovery Fund (LDF) 22.05% 
4. Turkish Invest Fund (TKF) 18.50%
5. Herzfeld Cuba (CUBA) 17.60%

– Worst 5 Performing ETF’s –

1. Market Vectors Gold Miners (GDX) -17.65%
2. Asa Gold (ASA) -16.85%
3. Central Fund of Canada (CEF) -15.75%
4. US Oil Fund (USO) -10.75%
5. iShares South Africa (EZA) -10.10%

::: Upcoming Economic Reports (10/20/2008- 10/24/2008) :::

Monday:        Leading Indicators
Tuesday:       None
Wednesday:  Crude Inventories
Thursday:      Initial Claims
Friday:           Existing Home Sales

::: Earnings I’m Watching This Week :::

Monday: American Express (AXP), Nabors Industries (NBR), New Oriental Education (EDU), Petmed Express (PETS)

Tuesday: 3M (MMM), Ametek (AME), Apple (AAPL), Coach (COH), Icon (ICLR), Illumina (ILMN), Yahoo (YHOO)

Wednesday: Alcon (ACL), Amazon (AMZN), Baidu.com (BIDU), Axsys Technologies (AXYS), Covance (CVD), Covanta (CVA), EMC (EMC), Genzyme (GENZ), Omniture (OMTR), Pulte Homes (PHM), Ryland (RYL)

Thursday: Airgas (ARG), Bucyrus (BUCY), Cash America (CSH), Celgene (CELG), Cybersource (CYBS), Deckers Outdoor (DECK), Diamond Offshore (DO), EMCOR (EME), Flir Systems (FLIR), MEMC Electronics (WFR), Microsoft (MSFT), Monolithic Power (MPWR), Terra Industries (TRA), Terra Nitrogen (TNH), Trimble Navigation (TRMB)
More Suspect Capitulation, But Getting Closer To Major Rally

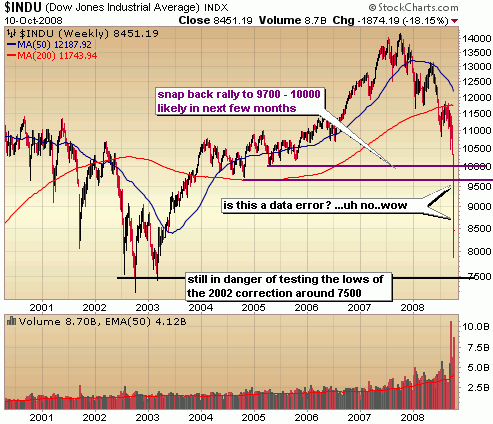
Words can’t really describe the action of the past week, but pictures certainly can.  You just have to take a look at the big picture charts of the major indices to get a sense of the historic meltdown in the markets that was last week.  In terms of a sustained move down with no breather along the way, I’d imagine we aren’t likely to see a move like that again over the course of a week EVER again.. at least I hope so.  It really does look like a data error.   Here are the nearly 10 year weekly charts of the major indices for a comparison to the tech crash.  As you can see the Down Jones move is much more vertical and severe this time around.  Mind boggling really.

While we did see some positive action on Friday with a fairly massive capitulation attempt (more on this in a bit), my concern is that we closed in the lower half of the weekly range and in my opinion are still in danger of testing the lows of the previous correction around 7500.  However,  I do believe we are mighty close to a major bottom and massive snap back rally. 

101108_dowweekly

Same goes for the S&P.  It’s such a tough market to play right now because we really are in no man’s land a bit with the weekly close in the lower half of the range and in between the next level of support around the 2002 lows and the nearest level of resistance around 1050.

101108_spweekly

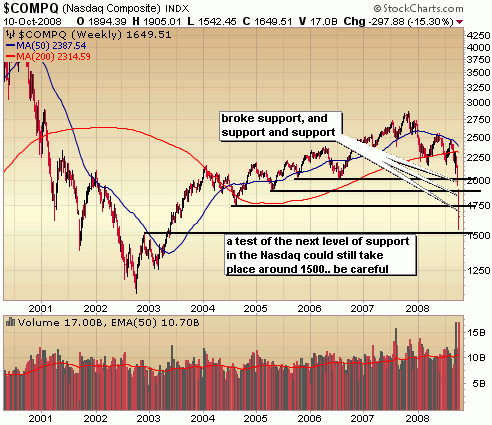
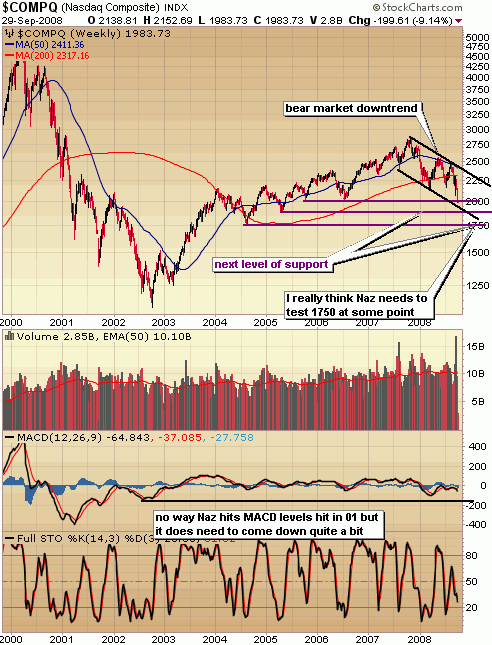
The Nasdaq still has a major support level (around 1500)  in its path before a test of the 02 lows come into play.  We could very well test 1500 before a major rally ensues so it’s best to remain cautious here.

101108_nazweekly

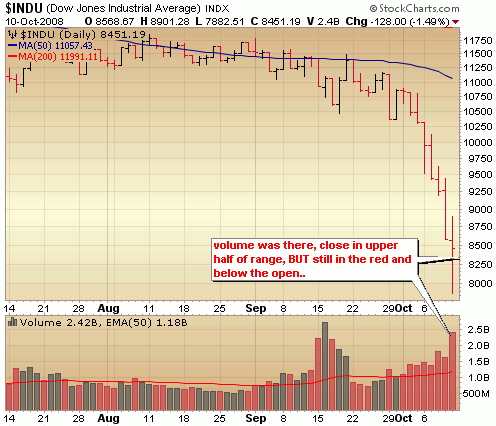
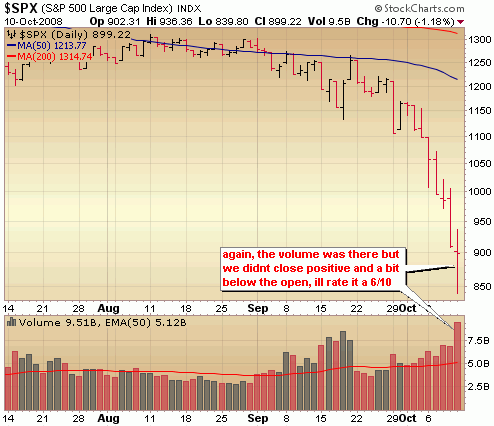
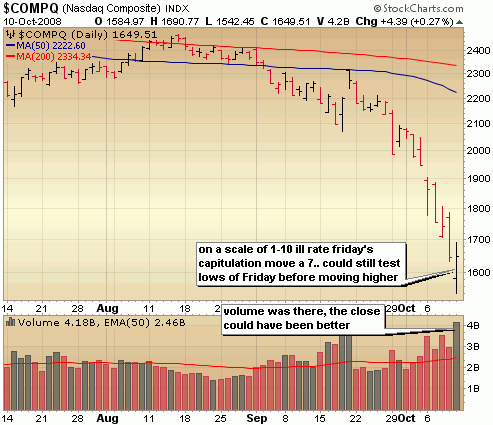
So why am I a bit skeptical that Friday’s low was "THE" bottom of this correction?  As I discussed above we still closed in the lower half of the weekly range, but in addition to that, the capitulation move on Friday was a bit lackluster.  As you’ll see in the charts below, the volume was certainly  there, the spike in fear as measured by the VIX was historic and the close did occur in the upper half of the intraday trading range,  but the end of day buying fizzled in the last 30 minutes as the Dow and S&P closed in the red.  I really wanted to see the indices close up big near the highs of the day.  I believe we’ll probably get some kind of follow through to the upside over the next few days but pay attention to volume on the buy side and be mindful of the fact the indices are still in danger of testing the lows of the tech bubble crash.

I personally have been nibbling on some commodity plays while doing my best to stay hedged with ultra short ETFs and may nibble some more on small long positions on any light volume pull backs from here.  An major moves up with light volume and I’ll be adding hedge positions.  The bottom line right now is that it’s very difficult to play either side and for most people you’re going to want to wait for this market to stabilize a bit and show more signs of strength. 

101108_dowdaily

101108_spdaily

101108_nazdaily

::: Model Portfolio :::

** This section will now appear as a separate report about every other Wednesday. 

The Self Investors Model Portfolio wrapped up 2006 with a gain of 27.6%, 2007 with a gain of 30.2% and is nearly 30% ahead of the S&P in a very difficult 2008.  This is a REAL portfolio with position sizing and features annualized returns of 24%.

Would you like to receive buy and sell alerts in the Model Portfolio within minutes (NEW! now get them via instant messaging in near real time) of each transaction?  You can receive these along with ALL of the tracking tools and video reports with the very popular Gold membership.  Don’t delay, get started today and join me for many more highly profitable months here at SelfInvestors.com.

::: Best/Worst Performers :::

– Top 10 Performing Industries For the Week –

1. Trucking: 1.05%
2. Sporting Goods Stores:  .85%
3. Personal Computers: -1.05%
4. Agricultural Chemicals: -3.00%
5. Rubbers & Plastics: -4.85%
6. REIT – Office: -5.10%
7. Consumer Services:  -5.75%
8. Tobacco Products: -5.80%
9. Education & Training Services: -5.80%
10. Auto Parts Wholesale: -5.85%

– Top 10 Worst Performing Industries For the Week –

1. Long Term Care Facilities: -33.60%
2. Aluminum: -30.50%
3. Nonmetallic Mineral Mining: -27.90%
4. Life Insurance: -27.40%
5. Diversified Investments: -26.70%
6. Oil & Gas Independent: -26.45%
7. Oil & Gas Equipment & Services: -25.75%
8. Auto Manufacturers Major: -25.70%
9. Oil & Gas Drilling & Exploration: -25.70%
10. Surety & Title Insurance: -25.00%

– Top 5 Best Performing ETFs For the Week –

1. Central Fund of Canada (CEF) 6.15% 
2. Gold Trust (GLD) .75%
3. Ishares Gold (IAU) .65% 
.. rest are bond funds

– Worst 5 Performing ETF’s –

1. Latin America (LDF) -39.05%
2. India Fund (IFN) -38.10%
3. Mexico Fund (MXF) -36.40%
4. Chile Fund (CH) -36.15%
5. Turkish Invest Fund (TKF) -35.65%

::: Upcoming Economic Reports (10/13/2008- 10/17/2008) :::

Monday:        Treasury Budget
Tuesday:       None
Wednesday:  PPI, Retail Sales, Business Inventories, Crude Inventories, Fed Beige Book
Thursday:      CPI, Initial Claims, Capacity Utilization, Industrial Production, Philly Fed
Friday:           Building Permits, Housing Starts

::: Earnings I’m Watching This Week :::

Monday: Fastenal (FAST)

Tuesday: Genentech (DNA), Intel (INTC), Johnson & Johnson (JNJ)

Wednesday: Abbott Labs (ABT), Badger Meter (BMI), Ebay (EBAY), JP Morgan (JPM), Lufkin Industries (LUFK), St Jude Medical (STJ), Coca Cola (KOL), Wells Fargo (WFC)

Thursday: Citigroup (C), Danaher (DHR), Gilead Sciences (GILD), Google (GOOG), Hdfc Bank (HDB), Informatica (INFA), Intuitive Surgical (ISRG), Merrill Lynch (MER), Nokia (NOK), Stryker (SYK), Sunpower (SPWRA)

Friday: Honeywell (HON), Satyam Computer (SAY), Schlumberger (SLB)

Capitulation? Not Quite

There has been quite a bit of discussion on whether yesterday’s move was "the" day of capitulation we have all been waiting for.  Here are some my thoughts I sent out to members last night:

I last left you one week ago following the initial attempt at getting the rescue plan passed and expressed my uneasiness over the state of  the current market.  In that email I mentioned to you:

"No, I don’t think we are done going lower.  Anytime you get a drop of this magnitude with a close at the lows it takes significant time to repair that damage.  I have a more detailed report at the blog with a look at the charts, but the potential support levels I’m watching are Dow 10,000 (psychological support), then Dow 9700, Nasdaq 1900 and roughly S&P 1000.  The VIX soared today, hitting levels just above 48 but I think now we need to hit those highs seen around the 01 and 02 bottoms in the 55 – 60 range which could very well mean another drop in line with what we saw today."

Today was the kind of day I had been waiting patiently for.. a final flush with climactic panic selling.  Admittedly, I was growing impatient as the market continued to grind lower with little sign of abating.  On Friday though, the ominous signal came as the 2nd attempt at getting the rescue plan passed with ease, but the market sold the news hard and the indices finished near the lows of the day.  It mentioned to my Gold members over IM that it was an ominous move and really set us up for a flush of selling today. .. here are some of my thoughts at the end of the day Friday. 

(10/03/08 11:39:55 AM): All, the Q’s took out that key level and this "could" turn ugly.. Now facing strong resistance around 37 and if it can’t clear that real quick and hold its possible we’ll face a late day sell off.

(10/03/08 12:44:05 PM): ..and thar she goes.. monday will be might interesting.. Perhaps the flush out awaits..

So was today the final flush?  Was it the bottom marker we have all been waiting for?  Yes and no.  Yes, the VIX spiked to levels not seen since the 02 crash but there are some problems with today’s move being called "the" day of capitulation that marks a true bottom.  For one, trading volume was relatively quiet and orderly AND the indices still closed significantly in the red, just getting above the middle line of the intraday trading range.  In my opinion, we were close today but not close enough.  It may stabilize the market for a few days but we’re still in danger of testing the lows of today at some point.

If you put some money to work today down near the lows, you have a good low risk entry point for a tradeable rally.  I personally added a bit of the QLD, the XLF and shorted a bit of SMN but since today’s reversal was a bit muted I may take those positions off if we rally a bit in the next few days with light volume.  There is still a tremendous amount of technical damage to work through and there will be plenty of time to get into positions once this market shows more signs of stabilizing.  So if you didn’t get into something today, sit tight.  We probably need to come back and test today’s lows at some point before heading significantly higher again.  Today’s end of day rally was encouraging but it still pays to be cautious.

Does Selling The News Clear the Way For the Final Flush?

The worst case scenario played out on Friday, with market selling off on the news that the rescue plan passed with ease.  Clearly, traders don’t believe the rescue plan is going to provide much relief and almost immediately following the House vote, the market initiated a late day sell off that resulted in the indices reaching their lowest levels of the year as sell volume increased.  Their is a silver lining to the action though.. it sets the market up for a final flush of selling, potentially paving the way for a climactic spike in fear followed by dramatic capitulation.  It’s important to wait for that kind of action to take place and avoid guessing the bottom. 

As I mentioned in my report last week, a new signal to begin dabbling on the long side won’t occur until we see capitulation followed by an orderly pullback.  It’s downright ugly out there, but I think we’re very close to a tradeable bottom.  I won’t have a look at the charts this week, but please have a look at the weekly charts I posted in my report last week.  I still believe that the indices need to test the following levels before capitulation becomes a possibility:  Dow 10,000, Nasdaq 1900 and roughly S&P 1020.  Watch those levels, watch the VIX in the 50 – 60 range and keep an eye on intraday volume levels in the DIA, SPY and QQQQ.  Soon, there will be a tremendous trading opportunity on the long side for some swing trades and my preferred weapon of choice are those ultra ETF’s which provide a great diversified way to play sectors with the advantage of having some leverage behind you.  I’ll have a post soon taking a look at the most liquid of these ETFs.  Times are tough, but stay positive and aware of opportunities.  I’ll have another detailed look at the major indices in my report next week.

::: Model Portfolio :::

** This section will now appear as a separate report about every other Wednesday. 

The Self Investors Model Portfolio wrapped up 2006 with a gain of 27.6%, 2007 with a gain of 30.2% and is nearly 20% ahead of the S&P in a very difficult 2008.  This is a REAL portfolio with position sizing and features annualized returns of 24%.

Would you like to receive buy and sell alerts in the Model Portfolio within minutes (NEW! now get them via instant messaging in near real time) of each transaction?  You can receive these along with ALL of the tracking tools and video reports with the very popular Gold membership.  Don’t delay, get started today and join me for many more highly profitable months here at SelfInvestors.com.

::: Best/Worst Performers :::

– Top 10 Performing Industries For the Week –

1. Banks – SW: 1.62%
2. Savings & Loans:  .74%
3. Banks – Pacific: -.10%
4. Banks – SE: -.75%
5. Food – Major Diversified: -.92%
6. Personal Products: -1.20%
7. Tobacco Products:  -2.15%
8. Processed & Packaged Goods: -2.20%
9. Banks – Midwest: -2.60%
10. Drug Manufacturers: -3.50%

– Top 10 Worst Performing Industries For the Week –

1. Ag Chemicals: -31.20%
2. Resorts & Casinos: -28.20%
3. Silver: -26.10%
4. Copper: -26.10%
5. Steel & Iron: -23.95%
6. Farm & Construction Machinery: -21.75%
7. Industrial Metals & Minerals: -21.50%
8. General Contractors: -21.20%
9. Oil & Gas Equip & Services: -21.20%
10. Farm Products: -21.10%

– Top 5 Best Performing ETFs For the Week –

1. iShares 20 Yr Bonds (TLT) 3.05% 
2. Malaysia (MAY) 1.65%
.. the rest are all bond funds

– Worst 5 Performing ETF’s –

1. SPDR Metals & Mining (XME) -26.30%
2. Market Vectors Russia (RSX) -26.10%
3. Market Vectors Agribusiness (MOO) -25.00%
4. Market Vectors Steel (SLX) -24.25%
5. Market Vectors Coal (KOL) -23.65%

::: Upcoming Economic Reports (10/6/2008- 10/10/2008) :::

Monday:        None
Tuesday:       FOMC Minutes, Consumer Credit
Wednesday:  Pending Home Sales, Crude Inventories
Thursday:      Initial Claims, Wholesale Inventories
Friday:           Export/Import Prices, Trade Balance

::: Earnings I’m Watching This Week :::

Tuesday: Yum Brands (YUM), Team (TISI)

Wednesday: Costco (COST), Lindsay (LNN), Monsanto (MON)

Thursday: Chevron (CVX)

Friday: General Electric (GE), Infosys (INFY)

Stock Market Crash & Great Depression Rule the Headlines As Fear Surges

What a day.  I’d like to ramble and rant for 6 pages about the politics played during the formation and vote of the rescue plan but I won’t waste my time or yours.  The whole process..  the he said  she said, the blame game and the ultimate failed result is a complete embarrassment ..  as the entire world watches.  I really thought that the plan would be approved today, even if by a slim margin.  It was a complete shock …  When the market doesn’t get what’s already priced in to some degree, particularly when dealing with something of such magnitude, you get the result of today. 

In my last report to members last Thursday and in my Sunday report here at the blog I expressed my uneasiness about the market due to the rescue plan fiasco and urged you to move more to cash (if you weren’t already there) until the events played out.  The capitulation day of the previous week and lighter volume pull back created a place to initiate a few positions in a "normal" market, but this market is anything but normal and as we saw today, news  trumps technicals.  The indices blew through the lows of the previous capitulation with heavy volume and finished the day with  the largest single day point loss in history. 

No, I don’t think we are done going lower.  Anytime you get a drop of this magnitude with a close at the lows it takes significant time to repair that damage.  Potential support levels I’m watching are Dow 10,000 (psychological support), then Dow 9700, Nasdaq 1900 and roughly S&P 1000 (more on this in the charts below).  The VIX soared today, hitting levels just above 48 but I think now we need to hit those highs seen around the 01 and 02 bottoms in the 55 – 60 range which could very well mean another drop in line with what we saw today.  With the Jewish holiday tomorrow, the earliest a new plan could be voted on is late Thursday, so I can’t imagine this market is going anywhere anytime soon unless the FDIC insurance limit is raised and/or the SEC suspends the mark to market accounting rule.  The rollercoaster ride continues…

If you are still in the market it’s important not to panic though.  There will be a better time to ease up on positions.  Fear is at historic levels and Jim Cramer does have a Dow price target of 8300 (not to mentioned uttered the words Great Depression once again) now so there are some signs that we are at least close to another tradeable bottom.. but would like to see one more big move down. 

I’ve had a few emails from people wondering whether it would be good time to put money to work.  The short answer is NO!  It’s too early yet.  The indices indicate stabilization when they capitulation and retrace in an orderly manner.  The previous capitulation of a few days ago was broken with today’s move, so now we need to wait for another capitulation move and orderly retrace to begin dabbling on the long side. 

Hang in there.  During this time, while you’re waiting for the market to sort itself out and stabilize, consider reading that investing book you’ve been wanting to read, review a few of your trades that didn’t go well and come up with a plan to improve your performance for next year.  If you’re new to the stock market I always recommend starting with William O’neils "How to Make Money in Stocks".  It really hammers home why reading the charts is so important and why a buy and hold approach is a failed strategy.

Let’s take a look at the charts:

The Nasdaq took out two levels of key support today, one being the low of the capitulation that we saw on September 18th at 2070, then again late in the day below the 2006 lows at 2012.  I believe that a test of the next level of support at the 2005 lows around 1890 (which is also close to the bottom of the downward channel) is probable before the next major capitulation point can occur.  If we can’t hold there, then the next likely test for the Nasdaq becomes 1750.  

92908_nasdaq

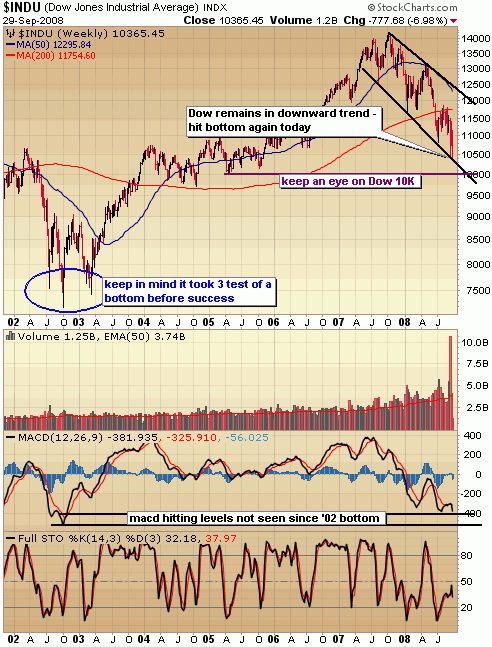
The Dow closed right at the bottom of the downward trend today and also took out the lows of the previous capitulation.  A test of Dow 10,000 appears to be a certainty in the coming days.  If it can’t hold there, look for a test of the 2004 lows around 9700.

92908_dow

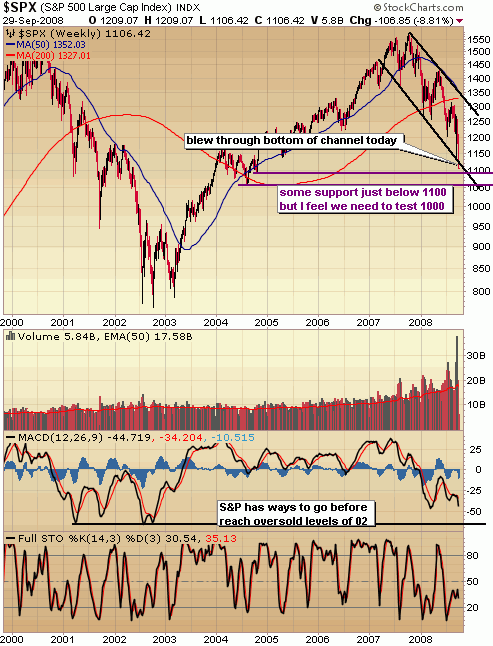
The S&P took out the 2005 lows and the lows of the previous capitulation, not to mention the bottom of the downward channel.  Banning short selling didn’t seem to slow down the financial heavy S&P today did it?  There is some support just below 1100, but I really believe that the S&P will need to test 1000 before all this is said and done. 

92908_sp500

Patience Pays, Cash Still King

In my last report I talked quite a bit about the spike in fear as measured by the VIX, the meaningful capitulation and the orderly retracement of that capitulation. .. the technical action provided a place to begin dabbling in only the highest quality of companies.  That was last week.. Despite the improving technicals, admittedly I have become more cautious as a result of the events of the past week and the uncertainty of  the effectiveness of the announced rescue plan. 

My feeling right now is this – if you are in the market with money you absolutely can’t afford to lose or need the cash within a couple years, moving to 100% cash is your best best.  If you don’t mind taking on some risk and have longer time horizons then I do believe it’s not a bad time to dabble in high quality names. 

Nobody knows what will happen over the next few weeks.. my concern is that the improving technical picture of the market may be trumped by reports that the rescue plan is rather ineffective.  On the other hand, there is so much fear out there right now.  I was reading one headline today about the fear of the market crashing 30% in a few days.. I’ve been getting a few panicked emails from members, not to mention a sharp increase in companies trying to capitalize on the fear by highlighting the doom and gloom of the financial markets in order to sell a product.  It’s everywhere and that’s one ingredient for finding a bottom.

What I’m personally doing is holding onto a few core long positions but will be watching closely how the market reacts to the rescue plan in the coming days.  Remember that the implementation of a rescue plan has been priced in to some degree, so we have to be careful of a sell on the news situation.  One thing is for sure – if big sell volume comes into the market, once the rescue euphoria wears off, I will be unloading more of my long positions and increasing short exposure. 

I would imagine for most of you, it’s going to be best to just sit tight for a couple weeks, sleeping well knowing you’re sitting on cash.  If the market rallies 1000 points in the coming days, no sweat.. Opportunities are made up easier that losses.

I’ll have a look at the technicals of the market again next week. 

::: Model Portfolio :::

** This section will now appear as a separate report about every other Wednesday. 

The Self Investors Model Portolio wrapped up 2006 with a gain of 27.6%, 2007 with a gain of 30.2% and is more than 10% ahead of the S&P in a very difficult 2008.  This is a REAL portfolio with position sizing and features annualized returns of 24%.

Would you like to receive buy and sell alerts in the Model Portfolio within minutes (NEW! now get them via instant messaging in near real time) of each transaction?  You can receive these along with ALL of the tracking tools and video reports with the very popular Gold membership.  Don’t delay, get started today and join me for many more highly profitable months here at SelfInvestors.com.

::: Best/Worst Performers :::

– Top 10 Performing Industries For the Week –

1. Mortgage Investment: 49.30%
2. Dairy Products:  9.00%
3. Cigarettes: 2.35%
4. Application Software: 1.10%
5. Long Distance Carriers: .85%
6. Manufactured Housing: .75%
7. Integrated Oil & Gas:  .70%
8. Drug Manufacturers Major: .65%
9. Drug Manufacturers Other: .55%
10. Specialized Health Services: .50%

– Top 10 Worst Performing Industries For the Week –

1. Savings & Loans: -31.80%
2. Banks – SE: -19.20%
3. Agricultural Chemicals: -16.10%
4. Heavy Construction: -14.80%
5. Banks – SW: -14.60%
6. Meat Products: -13.95%
7. Major Airlines: -13.45%
8. Broadcasting Radio: -12.70%
9. Steel & Iron: -12.25%
10. Aluminum: -12.25%

– Top 5 Best Performing ETFs For the Week –

1. iShares Silver (SLV) 5.55% 
2. Asa Gold (ASA) 4.50%
3. US Oil Fund (USO) 4.35%
4. Herzfeld Caribbean (CUBA) 2.35%
5. iShares Commodities (GSG) 2.30%

– Worst 5 Performing ETF’s –

1. Market Vectors Coal (KOL) -14.90%
2. SPDR Metals & Mining (XME) -14.00%
3. Market Vectors Steel (SLX) -13.70%
4. Market Vectors Agribusiness (MOO) -12.50%
5. iShares Basic Materials (IYM) -11.65%

::: Upcoming Economic Reports (9/29/2008- 10/3/2008) :::

Monday:        Personal Income/Spending 
Tuesday:       Chicago PMI, Consumer Confidence
Wednesday:  Auto/Truck Sales, Construction Spending, ISM Index
Thursday:      Initial Claims, Factory Orders 
Friday:           Nonfarm Payrolls, Unemployment Rate

::: Earnings I’m Watching This Week :::

Monday: Cal Maine Foods (CALM)

Wednesday: Mosaic (MOS)