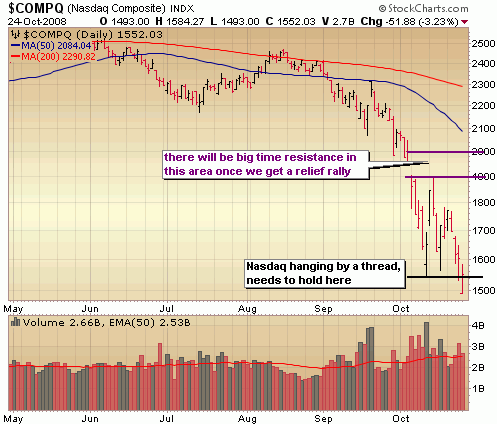
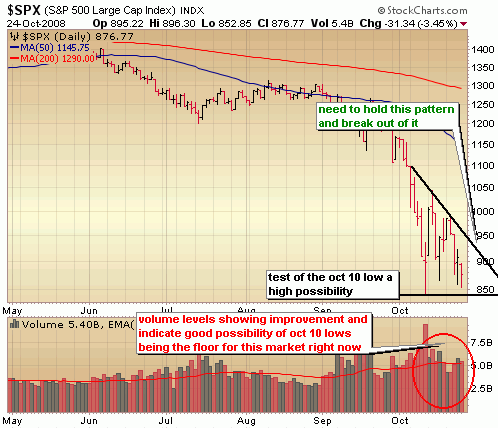
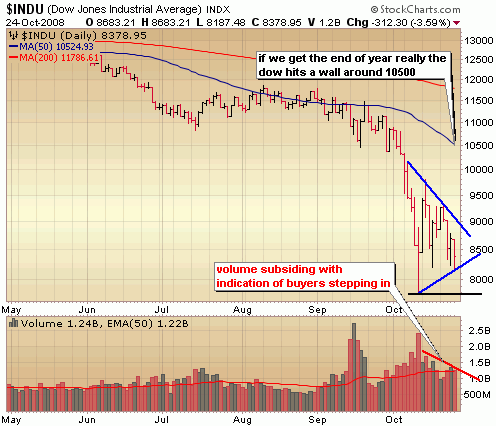
I’ve been mentioning over the past several days that the technical action in the indices has improved enough to where I have begun dabbling on the long side, but we are not out of the woods just yet as indicated by Friday morning’s limit down move ahead of the bell. Considering Thursday’s minor capitulation move it was a complete surprise to me to see that big gap down at the open with the Nasdaq taking out the October lows. More of a surprise was the way the day played out.. buyers stepped in right at the open and the rest of the day remained relatively quiet as volume came in fairly light. A day that should have resulted in a very meaningful move didn’t give us any clues as to what institutions were doing but it was encouraging to see all of the indices hold up above the October intraday lows (the Nasdaq just barely)
Let’s take a quick look at the indices.
The Nasdaq looked dead in the water early on Friday as it took out the Oct 10 low. It managed to recover quickly though and closed just barely above that low keeping key support intact by just a thread. It really needs to continue to close above this important threshold so Monday will be very very important.
The S&P continues to hold up above the Oct low and volume levels do indicate that buyers are beginning to show some interest down here, but until we break out of the wedge formation with big volume there is always the possibility of one more washout move, particularly considering we haven’t yet had that dramatic day of capitulation. A big, dramatic day of capitulation isn’t necessary to reach a tradeable bottom but it’s something that occurs quite often after major sell offs, so we have to mindful and prepared for that.
The Dow is carving out a wedge of its own as volume levels improve, but taking out Friday’s lows likely means a test of the October 10 low. Taking out the October 10 likely means the market is gearing up for one last big push lower which would create a tsunami of buying shortly thereafter. I am looking for a breakout of the wedge formation as a signal to get more aggressive on the long side. If that should happen and the Dow runs up into the 10500 range, you better believe I’m locking in profits!
The next week of trading is going to be absolutely critical as the election nears. The market hates uncertainty and it’s hard to say how much a likely Obama victory is priced in at this point. A scenario that I see potentially playing out is tighter trading ranges and lower volume as the wedge formation in the Dow and S&P continue to develop. Once a new President is elected, the market makes a defining move within a day or two. Given the extreme oversold levels and improving volume levels, I’m still hanging my hat on a healthy relief rally from here to the end of the year.
::: Model Portfolio :::
** This section will now appear as a separate report about every other Wednesday.
The Self Investors Model Portfolio wrapped up 2006 with a gain of 27.6%, 2007 with a gain of 30.2% and is more than 30% ahead of the S&P in a very difficult 2008. This is a REAL portfolio with position sizing and features annualized returns of 24%.
Would you like to receive buy and sell alerts in the Model Portfolio within minutes (NEW! now get them via instant messaging in near real time) of each transaction? You can receive these along with ALL of the tracking tools and video reports with the very popular Gold membership. Don’t delay, get started today and join me for many more highly profitable months here at SelfInvestors.com.
::: Best/Worst Performers :::
– Top 10 Performing Industries For the Week –
1.Gold: 4.85%
2. Data Storage Devices: 3.80%
3. Printed Circuit Boards: 2.75%
4. Banks – Mid Atlantic: 2.20%
5. Accident & Health Insurance: 2.00%
6. Broadcasting – Radio: 1.95%
7. Banks – Pacific: 1.70%
8. Computers Wholesale: .65%
9. Surety & Title Insurance: .50%
10. Silver: .35%
– Top 10 Worst Performing Industries For the Week –
1. Machine Tools & Accessories: -11.00%
2. Semis – Memory Chips: -10.30%
3. REIT – Diversified/Industrial: -9.40%
4. Resorts & Casinos: -9.20%
5. Foreign Regional Banks: -9.15%
6. REIT – Hotel/Motel: -8.85%
7. Gaming Activities: -8.70%
8. Major Airlines: -8.30%
9. Cement: -8.00%
10. Multimedia & Graphics Software: -8.00%
– Top 5 Best Performing ETFs For the Week –
1. Central Fund of Canada (CEF) 6.60%
2. HLDRS Internet Infrastructure (IIH) 5.35%
3. SPDR Insurance (KIE) 2.75%
4. Market Vectors Gold Miners (GDX) 2.25%
5. SPDR Gold (GLD) 2.20%
– Worst 5 Performing ETF’s –
1. Central Europe & Russia (CEE) -16.40%
2. Market Vectors Russia (RSX) -12.35%
3. iShares South Korea (EWY) -11.30%
4. iShares Emerging Markets (EEM) -10.30%
5. iShares China (FXI) -10.00%
::: Upcoming Economic Reports (10/27/2008- 10/31/2008) :::
Monday: New Home Sales
Tuesday: Consumer Confidence
Wednesday: Crude Inventories, Durable Orders, FOMC Rate Decision
Thursday: GDP (adv), Initial Claims
Friday: Personal Income, Personal Spending, Chicago PMI
::: Earnings I’m Watching This Week :::
Monday: Atheros Communications (ATHR), Banco Bradesco (BBD), BE Aerospace (BEAV), Buffalo Wild Wings (BWLD), Paraxel (PRXL), Sohu.com (SOHU),
Tuesday: Amedisys (AMED), China Security & Surveillance (CSR), Kansas City Southern (KSU), Vistaprint (VPRT)
Wednesday: Alpha Natural Resources (ANR), Cliffs Natural Resources (CLF), First Solar (FSLR), Forrester Research (FORR), Kirby (KEX), Praxair (PX), Sociedad Quimica (SQM), Visa (V),
Thursday: Balchem (BCPC), Chesapeake Energy (CHK), Digital Ally (DGLY), eResearch (ERES), Intercontinental Exchange (ICE), LKQ Corp (LKQX), Massey Energy (MEE), Morningstar (MORN), Natus Medical (BABY), Psychiatric Solutions (PSYS), Southwest Energy (SWN), Strayer Education (STRA), Sun Healthcare (SUNH), United Therapeutics (UTHR), VisionChina Media (VISN)
Friday: AsiaInfo Holdings (ASIA)


