It’s been a couple weeks since I’ve taken an in depth look at the market, but not much has happened, so it was a good time for me too take a bit of a break from the blog here and focus on some other projects I’m working on.
The last time I did a run down of the charts of the indices, we had just catapulted off support of the downward trend as oversold conditions and government/Fed intervention provided a bit of a floor and sent short scrambling. Now the true test begins. Now that some of the short covering and bargain hunting is complete, it’s time for the big fellas to step in and do some meaningful buying.
I think the market is set up for that with the weekly capitulation moves a couple weeks ago, followed by an orderly digestion of those gains. While some of the price moves over the past several days have been significant, the volume didn’t accompany it which is what you like to see. There does appear to be an incremental shift from sellers to buyers here, but we need more of a confirmation move over the next week or two.
Let’s jump right into the indices and have a look at where we’ve been and where we might be headed. Notice I say "might". Technical analysis is a powerful tool for gauging probability, not certainty… for you chartist skeptics out there.
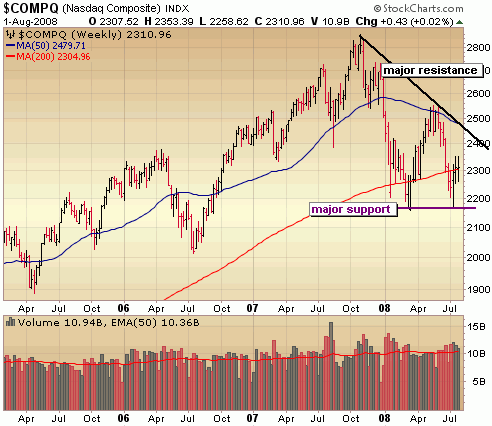
There is very strong support in the Nasdaq around 2150 – 2170 and it’s critical that we hold that level or we’re looking at a move to the next level of support at 2000. I personally think the odds are 50/50 of taking out that level and until we break through major resistance of the downward trend line above 2400, I won’t decrease those odds. We’re in a bear market until proven otherwise. I was encouraged by the close just a hair above the 200 dma at 2300. Now lets see if it can hold that level of support and test the downward trend at 2400. I like those odds, but the closer we get to the downward trend line the more defensive I’ll get.
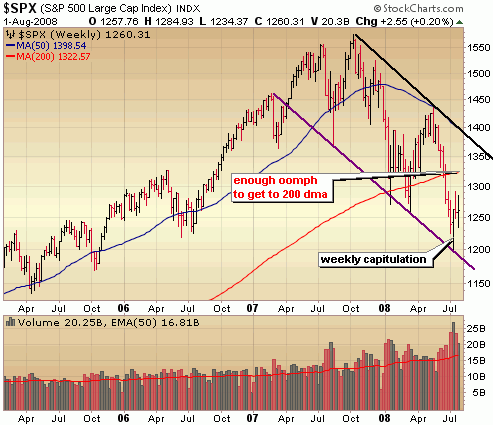
That really was a massive weekly move off support at the bottom of the downward trend at 1200 and I do think there is enough momentum to test resistance around the 200 day moving average at 1325. If it can get through that level, look for a test of the top of the downward trend around 1350. It would still be nothing more than a tradable bear market rally until it convincingly clears the top of that downward trend. I think we’re really going to have a tough time doing that this year.
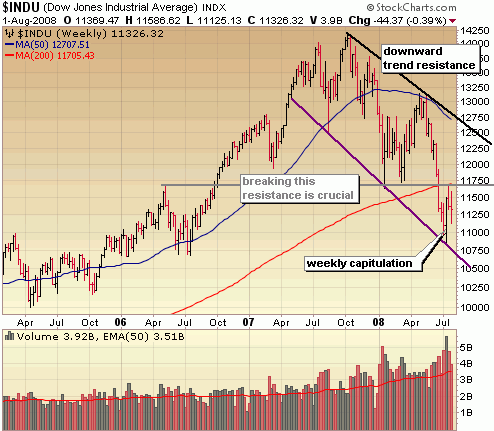
The Dow also capitulated off the bottom of the downward trend (around 10800) with a large price and volume move. Now we need to see some confirmation and clear the first level of major resistance of the 200 day moving average around 11700. The longer the Dow stays submerged below that level, the greater the likelihood of another breakdown so we need to get going in the next week or two. It needs to bust through the ceiling and hold the floor at 11700 – 11750.
The strategy I’ve employed following that weekly capitulation move is buying high quality, higher priced stocks in leading industries and in smaller quantities than I ordinarily would. Two examples of recent trades in the Self Investors Model Portfolio include Alcon (ACL) and Accenture (ACN). The higher we push up, the more likely I am to begin pursuing short positions to hedge.
::: Model Portfolio :::
** This section will now appear as a separate report about every other Wednesday.
The Self Investors Model Portolio wrapped up 2006 with a gain of 27.6%, 2007 with a gain of 30.2% and is more than 10% ahead of the S&P in a very difficult 2008. This is a REAL portfolio with position sizing and features annualized returns of 24%.
Would you like to receive buy and sell alerts in the Model Portfolio within minutes (NEW! now get them via instant messaging in near real time) of each transaction? You can receive these along with ALL of the tracking tools and video reports with the very popular Gold membership. Don’t delay, get started today and join me for many more highly profitable months here at SelfInvestors.com.
::: Best/Worst Performers :::
– Top 10 Performing Industries For the Week –
1. Surety & Title Insurance: 22.05%
2. Banks – Pacific: 11.20%
3. Savings & Loans: 10.45%
4. Internet Service Providers: 9.45%
5. Paper & Paper Products: 8.35%
6. Auto Parts Wholesale: 6.05%
7. Banks – SE: 6.05%
8. Nonmetallic Mineral & Mining: 6.00%
9. Publishing – Books: 5.75%
10. Consumer Services: 5.45%
– Top 10 Worst Performing Industries For the Week –
1. Drug Delivery: -35.00%
2. Broadcasting – Radio: -8.60%
3. Regional Airlines: -7.45%
4. Auto Manufacturers: -7.10%
5. Computer Peripherals: -6.15%
6. Gold: -5.75%
7. Diversified Investments: -5.65%
8. Cement: -5.50%
9. Multimedia & Graphics Software: -4.80%
10. Internet Info Providers: -4.80%
– Top 5 Best Performing ETFs For the Week –
1. Turkish Invest Fund (TKF) 15.90%
2. KBW Banking (KRE) 9.25%
3. HLDRS Regional Bank (RKH) 6.65%
4. PowerShares Dynamic Banking (PJB) 5.10%
5. Claymore Global Solar (TAN) 4.70%
– Worst 5 Performing ETF’s –
1. Internet Infrastructure (IIH) -10.10%
2. iShares Australia (EWA) -5.90%
3. iShares Tawain (EWT) -4.90%
4. Asa Gold (ASA) -4.40%
5. Market Vectors Gold Miners (GDX) -4.20%
::: Upcoming Economic Reports (8/4/2008- 8/8/2008) :::
Monday: Personal Income/Spending, Factory Orders
Tuesday: ISM Services, FOMC Policy Statement
Wednesday: Consumer Credit, Crude Inventories
Thursday: Pending Home Sales, Initial Claims
Friday: Productivity, Wholesale Inventories
::: Earnings I’m Watching This Week :::
Monday: Bankrate (RATE), China Medical (CMED), CommVault (CVLT), China Security (CSR), eResearch (ERES), Genesee & Wyoming (GWR), Intercontinental Exchange (ICE), Life Sciences Research (LSR), Otter Tail Power (OTTR),
Tuesday: Archer Daniels (ADM), Banco Itau (ITU), Central European Distribution (CEDC), Cisco (CSCO), DR Horton (DHI), Marvel Enterprise (MVL), PriceLine.com (PCLN), Skilled Healthcare (SKH), Sun Hydraulics (SNHY), Ultra Petroleum (UPL), WMS Industries (WMS),
Wednesday: Akeena Solar (AKNS), Clayton Williams Energy (CWEI), Clean Harbors (CLHB), Enersys (ENS), Flotek (FTK), FTI Consulting (FCN), GAiam (GAIA), Gerdau (GGB), LMI Aerospace (LMIA), Parexel (PRXL), T3 Energy Services (TTES), Nasdaq Group (NDAQ), Transocean (RIG), Yingli Green Energy (YGE)
Thursday: Aecom (ACM), Ansys (ANSS), Atwood Oceanics (ATW), Deckers (DECK), Divx (DIVX), Exide (XIDE), Hansen Natural (HANS), Natural Gas Services (NGS), SandRidge Energy (SD), Superior Well Services (SWSI), Veolia Environment (VE)
Friday: Beazer Homes (BZH), Darling Intl (DAR)