Category Archives: Weekly/After Stock Market Review Archives

Every Sunday evening a full market review is sent to members of SelfInvestors.com which provides commentary on the technical and economic picture, a review of the SelfInvestors Model Portfolio, the best/worst performing industries and ETF’s for the week, IPOs to watch, upcoming economic reports as well as notable earnings reports. In addition, on days when the market makes a significant move I’ll highlight the technical action discussing price/volume movements and support/resistance levels, industries/sectors leading and lagging the market as well as a Stock of the Day. In the past these were sent in the middle of the trading day but I’ve since begun publishing them and sending them to members after the market closes. These reports will be archived here as well.

S&P Joins Breakout Party, Volume Recedes; Hot IPO: Compellent Technologies (CML)

At the top of the page in IBD it says "Friday’s stronger than expected jobs report show a recession is likely off the table, propelling stocks to record highs."  Maybe it’s just me but how can any assumptions be made about a jobs report?  Wasn’t it just one month ago after a horrible jobs report that recession talk was swirling in the air?  Oh, right, that was a mistake.  Actually, there was significant job growth in August.  A revision upward and all is good… and that September report just confirms that the August jobs report was inaccurate.  Rigghhhhtt.  Don’t even get me started on inflation.  Can’t we all just finally admit that the economic numbers released by the government are a bit of a joke at this point?  To me there are really only two things that matter – company sales growth (not as easily manipulated as earnings) and supply and demand in the stock market.  Since company sales growth is a LAGGING indicator (hey, sales growth is typically best at the TOP of the market and worst at the bottom), I’ll base my trading decisions on simple supply and demand of the stock market.  For that I turn to the charts.

On Friday the S&P joined the Dow up in record high territory while the Nasdaq continues to push higher without pause.   That big August capitulation day has proved to be a much stronger springboard than I ever imagined.  If you told me a month ago that the market would shoot nearly straight up to record highs with little pause I wouldn’t have believed it.  The fact that the market has busted through to new highs is in and of itself very bullish action and makes for headlines.  This can bring in more retail money off the sidelines and push us higher.  However, until the institutional money starts pouring in, this market rise remains a house of cards. 

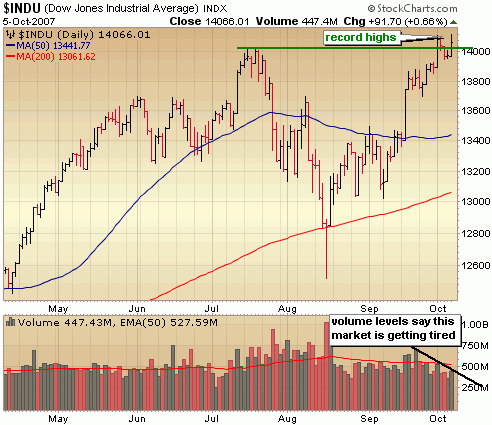
Notice how as the Dow pushes to record highs, but volume behind the move recedes.  The market looks tired up here and at the very least needs to take a breather and spend some time sideways.  At worst, this is the end of the road and marks a double top.  I don’t think that will happen, but it’s something to keep in mind.
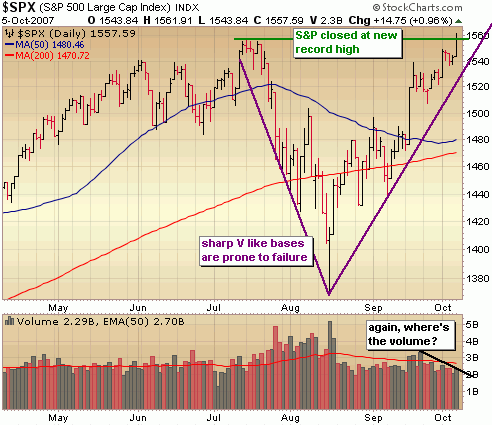
The S&P  closed at a record high on Friday with volume higher than the day before.  Yes, technically it was a day of accumulation.  But again, look at the lack of institutional buying up here.  Volume levels were well below average and have been for a few weeks.  Throw in the steep rise over the past several weeks and I think you have a recipe for a significant pull back from here.  This market needs a rest so that it can coil the spring for another leg up.
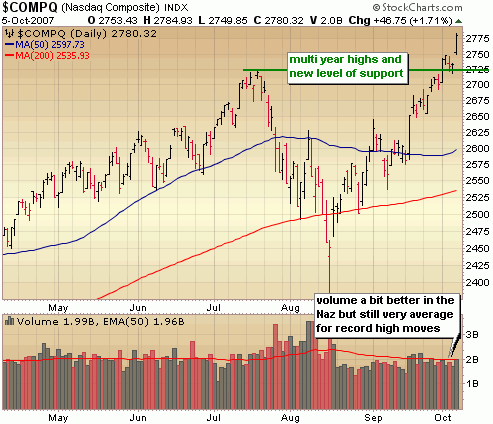
The volume levels in the Nasdaq are a bit better and the move on Friday was impressive but expect the Nasdaq to come back and test the new level of support at those July highs at some point before heading higher.
The bottom line right now is that this market has risen fast and furious off that capitulation day, but is looking increasingly tired up here.  The market needs to rest and recoil the spring so that it can sustain another leg up.  Until then, I’ll continue to sit on a sizable cash position and look to trade shorter time frames. 

::: Model Portfolio Update :::

For a few months I hadn’t been playing too many of what I call QSP (quick strike profit) trades which are basically swing trades where I’m looking for big profits in momentum stocks in a very short time frame.  However, while the market has gained strength over the past several weeks I’ve begun to play these quite a bit more and this week the strategy paid off in a big way.  My strategy with them is to cut them loose at the first sign of stalling and/or weakness even if I have a gain in the stock.  Case in point – my trades in SCON and KONG.  Both stalled out after a breakout attempt so I dumped them for small gains of 3%.  Another great example is a trade in Cardica (CRDC) which I’ll highlight in a case study in another post soon.  CRDC is a stock I initiated a position in last Friday when it looked as if it was going to emerge from a very bullish looking triangle formation.  When it stalled on Monday and Tuesday, I dumped it for a small 1% loss.  If at first it doesn’t succeed.. TRY, TRY again.  I tried again on Thursday when the stock began to show new signs of life late in the trading day.  I initiated an entry at 10.17 and rode it up for much of the day on Friday and locked in a very quick 45% gain.  My only regret is initiating such a small position 🙁 The KEY: cut your losses quickly in these volatile plays and eventually that one big run will wipe out a few small losses and really accelerate your returns.  In addition to some nice gains in QSP trades recently, the portfolio continues to be led by Google (GOOG) a long term holding as well as IPO plays LULU and WX.  For the week, the portfolio surged to a 4.3% gain bringing the YTD gain to 15.6%.  Now that certainly isn’t world beating performance, but as I’ve said before, the market has been unusually difficult to read this year and I missed much of the move in the first half of the year.  I feel like now I’m catching up and in great position to at least double the return of the S&P by the end of the year just as I did last year.  I’m still carrying a decent cash position at 32% and probably won’t move too much more to the long side until we get some kind of pullback/consolidation. 

::: Best/Worst Performers :::

– Top 10 Performing Industries For the Week –

1. Manufactured Housing: 12.55%
2. Residential Construction: 11.85%
3. Toy & Hobby Stores: 10.00%
4. Long Distance Carriers: 9.80%
5. REIT – Office: 9.20%
6. Recreational Vehicles: 8.90%
7. Marketing Services:  8.40%
8. Department Stores: 8.30%
9. Major Airlines: 8.15%
10. Water Utilities: 7.65%

– Top 10 Worst Performing Industries For the Week –

1. Drug Stores: -5.55%
2. Consumer Services: -5.40%
3. Information Technology: -4.70%
4. Semiconductor – Memory: -1.50%
5. Semiconductor – Broadline: -1.25%
6. Aerospace/Defense: -1.25%
7. Cigarettes: -1.15%
8. Printed Circuit Boards: -1.00%
9. Nonmetallic Mineral & Mining: -.85%
10. Paper & Paper Products: -.75%

– Top 5 Best Performing ETFs For the Week –
 
1. Ishares Home Construction (ITB)  14.65%
2. SPDR Homebuilders (XHB) 9.20%
3. Indonesia Fund (IF) 8.25%
4. Ishares South Africa (EZA) 7.60%
5. Ishares Cohen & Steers Realty (ICF) 6.75%

– Worst 5 Performing ETF’s –

1. PowerShares Agriculture  (DBA)  -3.65%
2. Thai Fund (TTF) -2.70%
3. Ishares Silver (SLV)  -2.65%
4. Ishares Commodity (KRE) -1.45%
5. PowerShares Commodity (DBC)  -1.30%

:::  IPO’s Worth Watching for This Week :::

The highest profile company to go public this week is Virgin Mobile (VM), but this company has started bleeding red.. no gushing red is more like it.   Just one compelling IPO this week.  Compellent is fast growing but not yet profitable.

1. Compellant Technologies (CML): a leading provider of enterprise-class network storage solutions that are highly scalable, feature rich and designed to be easy to use and cost effective. Compellent’s Storage Center is a Storage Area Network (SAN) that is designed to significantly lower storage and infrastructure capital expenditures, reduce the skill level and number of personnel required to manage information and enable continuous data availability and storage virtualization.  Trading set to begin on Thursday.

::: Upcoming Economic Reports (10/8/07 – 10/12/07) :::

Monday:         None
Tuesday:       FOMC Minutes
Wednesday: Wholesale Inventories, Crude Inventories
Thursday:      Export/Import Prices, Initial Claims, Trade Balance
Friday:            Retail Sales, PPI, Business Inventories

::: Upcoming Notable Earnings Reports :::

Wednesday: Lam Research (LRCX), Premier Exhibitions (PRXI)

Thursday: Fastenal (FAST)

Friday: HDFC Bank (HDB)

::: In Case You Missed It – SelfInvestors Blog Entries of the Past Week :::

1. IPO Stocks Portal and IPO Tracking Service!

2. 2 Shippers, 2 Record Breakouts: Diana Shipping (DSX), Quintana Maritime (QMAR)

3. Breakout Stocks Review: Top Pick IPO Shoretel (SHOR)

4. IDow to Record Highs, But Reasons For Skepticism; Stock of Day – First Solar (FSLR)

Dow to Record Highs, But Reasons For Skepticism; Stock of Day – First Solar (FSLR)
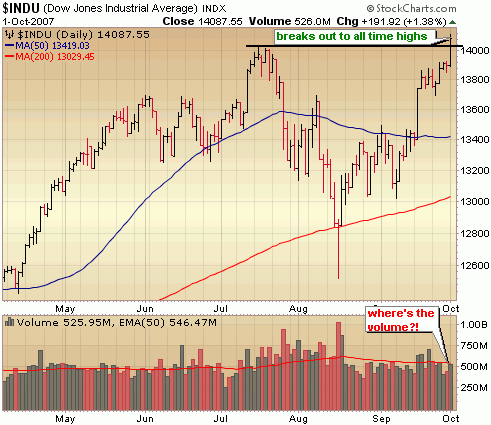
In my weekly report yesterday I mentioned I was waiting for a low volume move down to key support levels OR a big breakout to new highs to get more aggressive on the long side.   I was not expecting a breakout move to happen so soon especially with the news out of Citigroup in the morning but today we got the big breakout.. or did we?  Apparently traders feel the credit crunch will be a fairly isolated event (even Citigroup said earnings would be back to normal in the 4th quarter after a 3rd quarter hit) and with the Fed there to brace the fall every step of the way.. why not bid up up the market!  The price was there and the Dow and Nasdaq broke out from key resistance levels to new record highs.  BUT WHERE WAS THE VOLUME??  Since volume levels were higher than Friday, today’s move was technically a day of accumulation.  However, considering volume levels were below average across the board it’s clear that institutions didn’t do a whole of participating in today’s rally.  It seemed to be more of a case of the retail side fearing missing the next move up and some short covering.  Considering that the market is being led by commodities (no, Gold shouldn’t lead the way in a bull market) along with overbought conditions quite frankly I’m becoming skeptical of this rally.  I’m continuing to play it with small long positions and added a couple more today but I’ll be vigilant about looking for more warning signs and even more vigilant about protecting my profits.

 
::: Major Indices Performance – The Numbers :::

(Note: volume averages are based on the average over the past 50 days)
Data as of 4:00EST – End of Day October 1st 2007

Nasdaq: UP 1.46% today with volume 5% BELOW  average
Nasdaq ETF (QQQQ) UP 1.15%, volume 32% BELOW average
Dow: UP 1.38%, with volume 4% BELOW the average
Dow ETF (DIA): UP 1.22%, volume 47% BELOW the average
S&P ETF (SPY): UP 1.13%, volume 36% BELOW the average
Russell Small Cap ETF (IWM): UP 2.49%, volume 20% BELOW the average

::: SelflInvestors Leading Stocks :::

The Self Investors Leading Stocks Index is comprised of stocks in the Breakout Tracker, which is a database of the fastest growing companies near a breakout or having already broken out of a base.  Small to mid cap leading stocks led the way today as the Russell 2000 and the Self Investors Leading Stocks index greatly outperformed the major indices.

Summary:

* Advancers led Decliners 284 to 50
* Advancers were up an average of 2.71% today, with volume 2% ABOVE average
* Decliners were down an average of 2.05% with volume 59% ABOVE average
* The total SI Leading Stocks Index was UP 1.99% today with volume 10% ABOVE average

::: Where’s the Money Flowing :::

Many investing websites provide leading industries based on price performance alone. However, without accompanying volume levels, this can sometimes be misleading.  The only way that I know of to gauge industry/sector strength WITH volume levels is through the analysis of ETF’s.  A couple years ago this was not possible, but as more traders/investors use ETF’s they become a much better tool for gauging the health of the market and seeing where the money is flowing (or not flowing).  Using the proprietary SelfInvestors Demand Indicator score which measures price and volume movements, I’m able to quickly see which sectors/industries are seeing the greatest inflows of cash.  For a detailed look at how I go about gauging sector/industry strength please see the following post: http://selfinvestors.com/si/industry_tracking/

* Current Leading Sectors/Industries (over last 30 trading days):  
Gold, Gold Miners, Agriculture, Software, Technology
                                          
* Current Lagging Sectors/Industries (over last 30 trading days): 
Retail, Homebuilders

* Today’s Market Moving Industries/Sectors (UP):
Home Construction, Semis, REIT, Nanotech, Transports, Pharma

* Today’s Market Moving Industries/Sectors (DOWN):
Commodities

::: Stocks :::

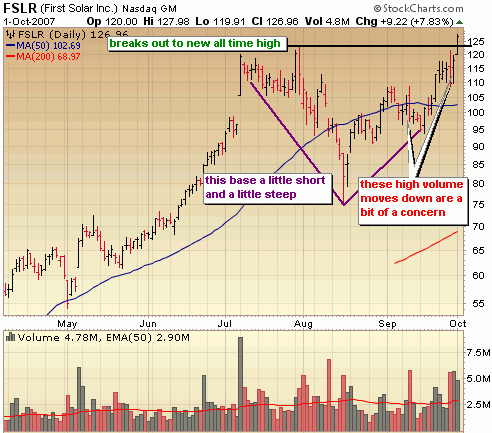
The stocks section will be an area where I highlight one stock selected from a group of stocks moving up with volume well above average and most likely breaking out of a base or consolidation.  Today’s stock is First Solar (FSLR), a top solar play which broke out of its first significant base since going public.  Yeah, it’s hard to believe a stock could run more than 500% without carving out a significant base along the way, but that’s been the case with many solar stocks.  For this reason I DO NOT adhere to the rule that says you should wait to initiate a position in an IPO until it carves out its first base.  The best IPO’s often don’t carve out a decent base until AFTER they have run up 50-100..-500%!

ABOUT: 

First Solar, Inc. (First Solar) designs and manufactures solar modules using a thin film semiconductor technology. The Company manufactures its solar modules on high-throughput production lines. Its solar modules employ a thin layer of cadmium telluride semiconductor material to convert sunlight into electricity. In August 2006, First Solar completed its Ohio expansion, adding two 25 megawatt production lines to its existing 25 megawatt base plant. The Company describes its production capacity with a nameplate rating, which means minimum expected annual production. It assigns each production line a 25 megawatt nameplate rating. With the completion of its Ohio expansion, First Solar has an annual manufacturing capacity of 75 megawatt. The Company is also building a four line 100 megawatt plant in Germany. During the fiscal year ended December 30, 2006, First Solar entered into long-term solar module supply contracts with six European project developers and system integrators.

FUNDAMENTALS: 

Like all solar companies, First Solar (FSLR) has been posting extraordinary sales and profits over the past several quarters and posted its first full year profit last year.  This year profit growth is expected to explode nearly 1000% over 2006.  No wonder the stock has soared over 500% since going public just over a year ago.  Net margins are excellent at around 26% but Return on Equity is disappointing at around 2%.  Not what you want to see in a leading company.  While First Solar (FSLR) isn’t currently the strongest solar company fundamentally, it’s often touted as the one with the greatest potential.  First Solar (FSLR) should certainly be near the top of any breakout watch list right now.
TECHNICAL:  

Following a huge run like FSLR has had I like to see a much larger, smoother base form than the one that FSLR has formed over the past few months.  However, given the industry it’s in (solar is still hot) and the growth, today’s breakout should not be ignored.  What I would do to decrease the risk of an entry is avoid initiating a position on the breakout and see how the stock performs over the next several days.  Does it continue spiking higher with heavy volume, then pull back to near the breakout point (at 123.31 with light selling volume)?  This is an indication that the breakout is strong and will undoubtedly hold up.  You can bet I’ll be initiating a position of my own in this case. 

SELFINVESTORS RATING: With a total score of 50/60 (26/30 for fundamentals, 24/30 for technical), First Solar (FSLR) is a very good SelfInvestors breakout candidate.

Full Disclosure/Disclaimer: The stock of the day is by no means a buy recommendation.  Please do your own research and make a personal decision based on your own tolerance for risk.  I currently do not own a position in FSLR.

Awaiting Earnings & Breakout Confirmation; Hot IPO: China Digital TV (STV)

 It was a fairly ho hum week with light trading volume as the market awaits the kick off of earnings season in a couple weeks but market reactions to news events suggest the bulls still remain in control as key technical resistance levels at the July highs come into play.  Retail warnings from Target and Lowe’s, weaker than expected housing numbers, a big drop in consumer confidence and record high oil was tempered by tame inflation (at least according to the government) and strong manufacturing data.  Clearly, the market focused on the good news last week and that is characteristic of any bull market.  However, I think most traders are waiting for some kind of big confirmation move after the Fed induced surge nearly two weeks ago before getting aggressive on the long side.  My own strategy hasn’t changed from last week.  I want to see a confirmation breakout move above the July highs OR some significant light volume selling to support levels before moving more cash to the long side.

 ::: Model Portfolio Update :::
While I did add a couple more small long positions and one short position I continue to remain fairly tentative as the market meanders with little volume ahead of earnings season.  As I said last week, I want to see either a few percentage points to the downside with light selling volume OR a confirmation breakout with volume before I’m willing to get more aggressive on the long side.  If we continue to push higher with light volume I may even be tempted to add another short position or two.  For the week, the Model Portfolio edged up a bit by .4% to a YTD gain of 11.3%.   I continue to hold a significant 45% cash position with 50% on the long side and 5% of the portfolio short.

::: Best/Worst Performers :::

– Top 10 Performing Industries For the Week –

1. Data Storage Devices: 5.10%
2. Industrial Metals & Minerals: 4.75%
3. Diversified Investments: 4.55%
4. Steel & Iron: 4.10%
5. Telecom Services – Foreign: 4.10%
6. Aluminum: 4.00%
7. Computer Peripherals:  3.90%
8. Life Insurance: 3.75%
9. Beverages – Soft Drinks: 3.75%
10. Farm & Construction Machinery: 3.60%

– Top 10 Worst Performing Industries For the Week –

1. Building Materials Wholesale: -9.45%
2. Residential Construction: -8.35%
3. Home Improvement Stores: -7.40%
4. Sporting Goods Stores: -5.10%
5. Banks – SE: -4.80%
6. Medical Practitioners: -4.10%
7. Water Utilities: -4.00%
8. Staffing & Outsourcing: -3.80%
9. Printed Circuit Boards: -3.55%
10. Hospitals: -3.20%

– Top 5 Best Performing ETFs For the Week –
 
1. Thai Fund (TTF)  12.30%
2. Claymore BRIC (EEB) 7.65%
3. Ishares China (FXI) 6.85%
4. India Fund (IFN) 6.75%
5. Powershares Golden Dragon (PGJ) 6.55%

– Worst 5 Performing ETF’s –

1. Herzfeld Caribbean Basin  (CUBA)  -12.50%
2. Dow Jones Home Construction (ITB) -11.30%
3. SPDR Homebuilders (XHB)  -8.05%
4. KBW Banking (KRE) -2.70%
5. PowerShares Dynamic Enegy Exploration (PXE)  -2.40%

:::  IPO’s Worth Watching for This Week :::

1. China Digital TV (STV): provides digital TV network operators with products and services that allow them control access to their content. The company’s subsidiary, Super TV, sells the set-top boxes and smart cards that allow subscribers to access channels or programs on a digital TV network. Super TV also provides the software on the network end that controls the content distribution, offers systems intergration services for network operators, and licenses it’s set top box design to manufacturers. Smart cards account for more than 85% the company’s sales.  Trading set to begin on Friday.

::: Upcoming Economic Reports (10/1/07 – 10/5/07) :::

Monday:         ISM Index, Auto/Truck Sales
Tuesday:       Pending Home Sales
Wednesday: ISM Services, Crude Inventories
Thursday:      Initial Claims, Factory Orders
Friday:            Average Workweek, Hourly Earnings, Nonfarm Payrolls, Unemployment Rate, Consumer Credit

::: Upcoming Notable Earnings Reports :::

Wednesday: Immucor (BLUD)

Thursday: Research In Motion (RIMM)

::: In Case You Missed It – SelfInvestors Blog Entries of the Past Week :::

1. Swing Trade Case Study – China Precision Steel (CPSL)

2. Halo 3 Launches Amid Rave Reviews

3. Stock Trade of Day – FalconStor Software (FALC) Cup With Handle Breakout

4. IPO Tracker ..Video Style

5. Trade of the Day – Cogent Systems (COGT) Breaks Out

Market Needs Rest Before Tackling Double Top

Phew, what a week!  After all that .. the inflation data, the Fed decision, OJ Simpson and some  triple witching the bulls have emerged as the victor of the battle, but have they won the war?  Not yet.  As the major indices approach those July highs the threat of the dreaded double top looms.  Before I can be convinced that another major rally is in the cards, the indices will need to take out those highs convincingly.  I think before that can become a reality, there needs to be some kind of consolidation of the recent rally in order to coil  the spring for a valiant go at a big breakout.  I want to see some kind of retracement of the move off the bottom in August with declining volume which would offer an opportunity to get a bit more aggressive on the long side.  With the euphoria of the Fed move wearing off and the initial surge of short covering largely depleted, the market may just get a good rest over the next week or two before we get into the bulk of earnings.

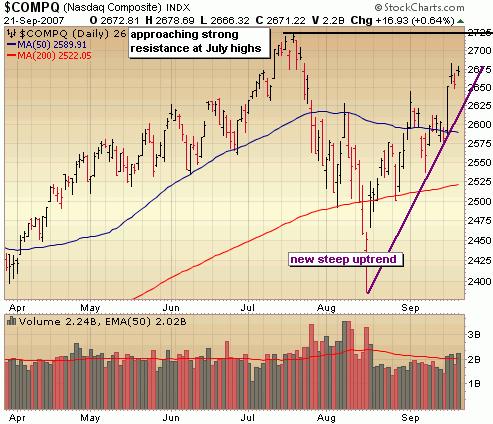
The chart of the Nasdaq below shows there is a bit of breathing room before it smacks into major resistance at those July highs.  We’ll have to keep a close eye on those levels and see how the market reacts as it could be long term failure point.  Given the action of this Fed, I don’t think that will happen but it’s something to keep an eye one.  Note the steep upward trend over the past month which will provide an initial source of support.

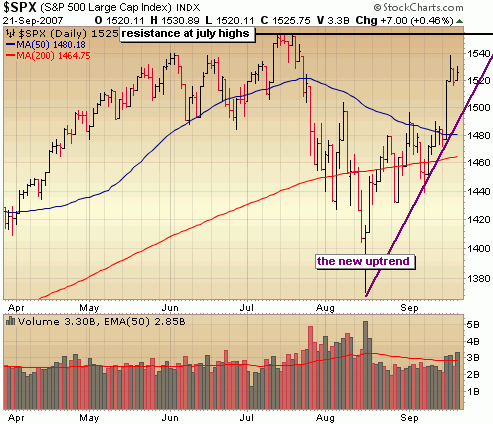
The S&P is nearing that big resistance point as well but has a bit of room to run.  Again, that is a steep upward trend over the past month and I think we need to at the very least retrest that trend line before heading higher so getting aggressive on the long side up at these levels is a bit too risky in my opinion.

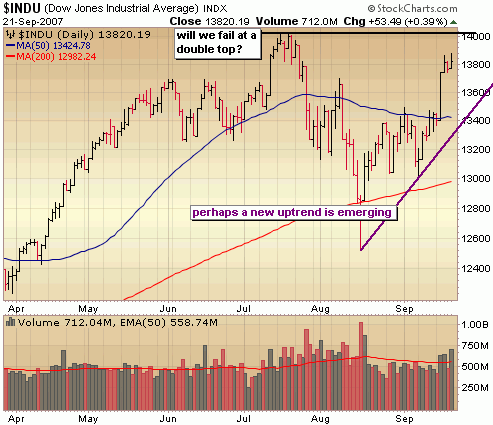
The Dow is much closer to those July highs (which are all time highs) and we may just hit those sometime this week.  The upward trend isn’t as steep in the Dow, but I believe also needs to at least retest that trend line before having a serious go at taking out those all time highs.

 ::: Model Portfolio Update :::

Every couple of months or so, there is what I would call a major shift in the portfolio from short to long or long to short.  Considering I was treading lightly with just a few long AND short positions and evenly balanced on either side, I wouldn’t call last Tuesday a dramatic shift in the portfolio, but I certainly acted quickly and decisively by closing out my four small short positions immediately following the Fed decision.  I don’t regret holding a few short positions ahead of the Fed and still believe that if they had cut by 25 basis points like everyone expected, the market would have ultimately sold off.  I was caught leaning the wrong way, but that’s OK.  The damage was minimized and the portfolio was still able to score a good 2% gain during the week, led by the almighty Google surging to new all time highs (a core holding in the portfolio) and helped by 3 new long positions in top IPO’s.  After closing my 4 short positions in United Online (UNTD) for a 7% gain, Praxair (PX) for a 3% loss, Tenaris (TS) for a 5% loss and Ashland (ASH) for a 5% loss I’m left with 5 long positions and won’t get more aggressive on the long side until one of two things happens.  This market digests recent gains quietly, pulling back a few percentage points OR the market breaks out above those July highs.  The Self Investors Model Portfolio year to date performance increased to 10.9% and the allocation stands at 37% long, 0% short and a large 63% cash position.

::: Best/Worst Performers :::

– Top 10 Performing Industries For the Week –

1. Metal Fabrication: 9.85%
2. Silver: 9.60%
3. Nonmetallic Mineral Mining: 9.40%
4. Copper: 9.35%
5. Housewares & Accessories: 9.20%
6. Steel & Iron: 8.75%
7. Gold:  8.65%
8. General Entertainment: 8.00%
9. Industrials Metals & Minerals: 7.95%
10. Agriculutural Chemicals: 7.60%

– Top 10 Worst Performing Industries For the Week –

1. Sporting Goods: -5.00%
2. Long Distance Carriers: -4.80%
3. Toy & Hobby Stores: -4.25%
4. Manufactured Housing: -2.85%
5. Processing Systems & Products: -2.60%
6. Broadcasting – Radio: -2.45%
7. Trucking: -2.30%
8. Auto Dealerships: -2.05%
9. Medical Practitioners: -2.00%
10. Insurance Brokers: -1.80%

– Top 5 Best Performing ETFs For the Week –
 
1. Morgan Stanley China (CAF)  11.00%
2. PowerShares Golden Dragon (PGJ) 9.70%
3. Market Vectors Steel (SLX) 9.50%
4. Ishares Brazil (EWZ) 8.15%
5. Indonesia Fund (IF) 8.00%

– Worst 5 Performing ETF’s –

1. US Natural Gas (UNG)  -1.80%
2. SPDR Homebuilders (XHB) -1.30%
3. SPDR Consumer Discretionary (XLY) .60%
4. Ishares Transports (IYT) .70%
5. Ishares Health Care (IHF)  1.00%

:::  IPO’s Worth Watching for This Week :::

1. Duff & Phelps (DUF): provides financial advisory services to public and private corporations, investment firms, law firms, and public accounting firms. The company specializes in offering fairness opinions regarding financial reporting, tax valuations, real estate and other asset valuations, and dispute resolution. It also offers investment banking services to companies undergoing mergers and acquisitions, financial restructurings, private placements of shares, or other transactions.  Trading set to begin on Friday.

::: Upcoming Economic Reports (9/24/07 – 9/28/07) :::

Monday:         None
Tuesday:       Existing Home Sales, Consumer Confidence
Wednesday: Durable Orders, Crude Inventories
Thursday:      Initial Claims, GDP (final), New Home Sales
Friday:            Personal Income/Spending, Core PCE Inflation, Chicago PMI, Construction Spending

::: Upcoming Notable Earnings Reports :::

Wednesday: Paychex (PAYX)

::: In Case You Missed It – SelfInvestors Blog Entries of the Past Week :::

1. Breakout Stocks Review: Top Pick Simulations Plus (SLP)

2. Be Zen, Be Like Ben; Stock of Day: Yingli Green Energy (YGE)

3. Trade of Day – Amtech Systems (ASYS) Breaks Out of Cup With Handle

4. Secondary Offerings & Valuation Downgrades May Offer Opportunity

Be Zen, Be Like Ben; Stock of Day: Yingli Green Energy (YGE)

The Fed has spoken, the pressure valve of uncertainty has been lifted and shorts were sent scrambling.  Now it’s time to play the hand we’re dealt and the hand we’re dealt changes the game over the next several months from one of a bearish standpoint to one where looking for long opportunities will be most profitable.  We’re ultimately headed higher from here.

I was certainly in the majority and flat out wrong about what the Fed would do.  I was in the camp that the Fed would cut 25 points and use the discount window for a more aggressive 50 point cut, resulting in a sizable knee jerk move up, followed by selling.  As it turns out, to the shock of many, the Fed cut the rate 50 points on both the fed funds and at the discount window and the market soared to its largest gains in a few years. 

Now this preemptive, bold move by the Fed can be debated until we’re all blue in the face but the fact of the matter is that this injects significant liquidity into the market and releases the pressure valve in the credit markets which should keep the market rising at least over the next several months.  Although I tend to consider this move a bit of an overreaction, what do I know?  The Fed has access to more data points then we can imagine and clearly the Fed has seen enough erosion to think that the economy may be in serious trouble.  They didn’t make a decision based on the "potential" for increasing inflation but rather acted decisively to curb the problems that we can see here and now.  Ben and team acted in the here and now rather than on what could be (the inflation monster).  I’ll call it the Zen of Ben.  Yes, the piper may still need to be paid following the easy money cycle and all the greed and speculation it brought with it.  This move may just delay the inevitable.  But for now we should not concern ourselves with what may or may not occur down the road.  This could be a brilliant move or a disaster and only time will tell.  For now be like Ben, be Zen.  Focus on the here and now and profit from the long side while the good times roll.  That means living, thinking, trading in the moment and not fighting this Fed.

From a technical perspective, volume levels weren’t great today but considering that the market was basically flat lined for several hours I don’t see it as a huge concern.  What is more of a concern is the sharp V like move off those mid August lows (up 10% in just a month).  This market really needs to repair that technical damage a bit more by retracing some of the move or spending some time sideways for a few weeks.  Unless the market continues the habit of shrugging off corrections and soaring to new heights without looking back, the likely action is up to near the July highs then a month or two of sideways action before bolting higher for the rest of the year.  That’s how a "technically rational" market might play out but as we’ve seen over the past several months, the market has been anything but technically rational.  At any rate,  any decent pull backs from here offers opportunity on the long side.

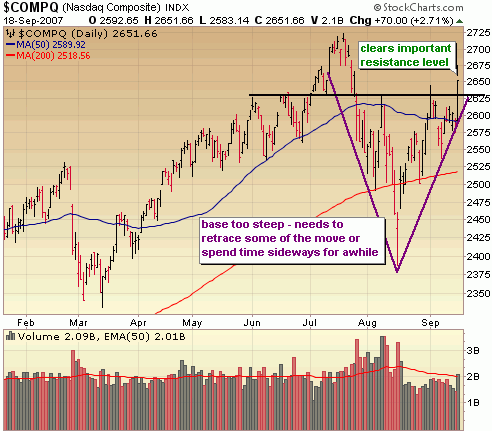
A look at the Nasdaq reveals that no significant resistance levels stand in its way between here and multi year highs around 2725.  Note the steep V like base which is prone to failure.  I think a move to test the highs is all but assured, but a successful breakout to multi year highs and a hold above those levels is not.

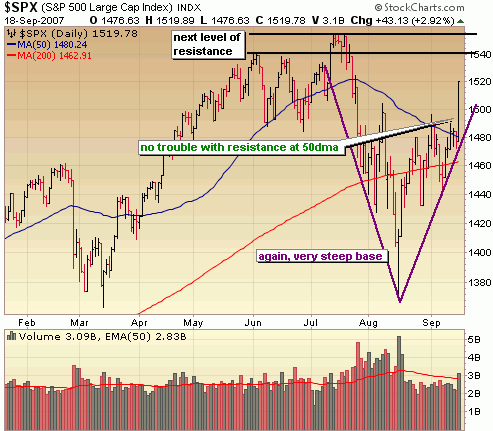
The S&P convincingly took out resistance of the 50 day moving average today and is headed to the next level of resistance at 1540.  I’m hesitant to initiate many long positions at this level and want to see some kind of retracement of today’s move before getting aggressive on the long side.

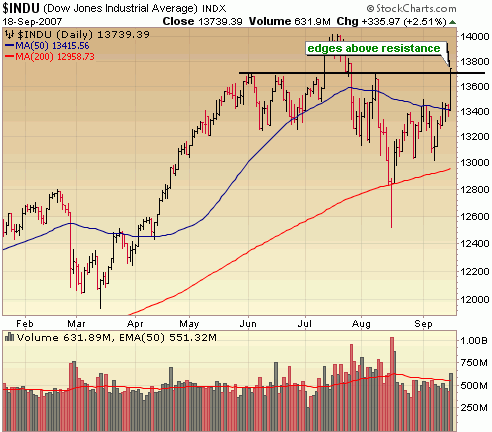
The DOW just edged up above key resistance around 13700 today.  It looks likely that it will soon go on to test its all time highs around 14000.

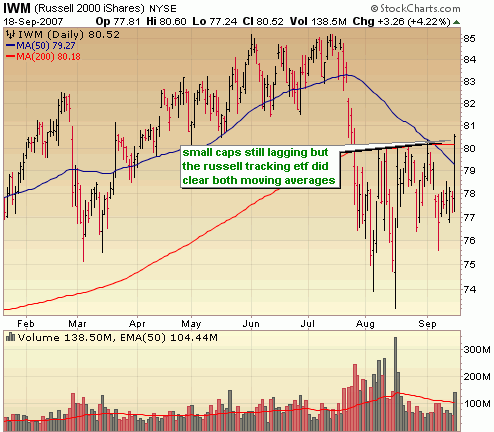
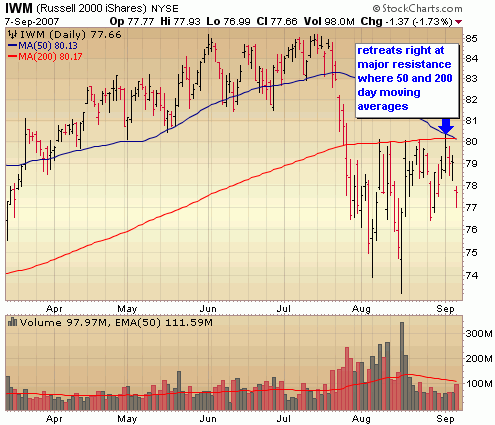
Finally, the Russell Tracking ETF (IWM), cleared two key resistance levels of the 50 and 200 day moving averages.  Small caps remain the laggards.

 
::: Major Indices Performance – The Numbers :::

(Note: volume averages are based on the average over the past 50 days)
Data as of 4:00EST – End of Day September 18th 2007

Nasdaq: UP 2.71% today with volume 5% ABOVE  average
Nasdaq ETF (QQQQ) UP 2.52%, volume 2% ABOVE average
Dow: UP 2.51%, with volume 15% ABOVE the average
Dow ETF (DIA): UP 2.45%, volume 6% BELOW the average
S&P ETF (SPY): UP 2.94%, volume 15% ABOVE the average
Russell Small Cap ETF (IWM): UP 4.22%, volume 15% ABOVE the average

::: SelflInvestors Leading Stocks :::

The Self Investors Leading Stocks Index is comprised of stocks in the Breakout Tracker, which is a database of the fastest growing companies near a breakout or having already broken out of a base.  Leading stocks did very well today and about in line with what the Russell did.  The small ones clearly led the way today, but as with the overall market, volume could have been a bit stronger.

Summary:

* Advancers led Decliners 284 to 15
* Advancers were up an average of 3.84% today, with volume 8% ABOVE average
* Decliners were down an average of 1.67% with volume 7% BELOW average
* The total SI Leading Stocks Index was UP 3.57% today with volume 8% ABOVE average

::: Where’s the Money Flowing :::

Many investing websites provide leading industries based on price performance alone. However, without accompanying volume levels, this can sometimes be misleading.  The only way that I know of to gauge industry/sector strength WITH volume levels is through the analysis of ETF’s.  A couple years ago this was not possible, but as more traders/investors use ETF’s they become a much better tool for gauging the health of the market and seeing where the money is flowing (or not flowing).  Using the proprietary SelfInvestors Demand Indicator score which measures price and volume movements, I’m able to quickly see which sectors/industries are seeing the greatest inflows of cash.  For a detailed look at how I go about gauging sector/industry strength please see the following post: http://selfinvestors.com/si/industry_tracking/

* Current Leading Sectors/Industries (over last 30 trading days):  
Gold, Consumer Goods, Consumer Staples, Networking, Telecom, Energy
                                          
* Current Lagging Sectors/Industries (over last 30 trading days): 
Home Builders, Transports, Real Estate, Nanotech, Broadband

* Today’s Market Moving Industries/Sectors (UP):
Home Construction, Regional Banks, Retail, Materials

* Today’s Market Moving Industries/Sectors (DOWN):
NO big down movers today.

::: Stocks :::

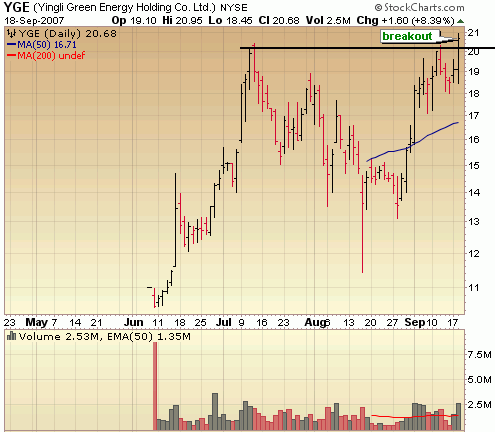
The stocks section will be an area where I highlight one stock selected from a group of stocks moving up with volume well above average and most likely breaking out of a base or consolidation.  Today’s stock is Yingli Green Energy (YGE), which broke out of a short cup with handle base today with strong volume.

ABOUT: 

Yingli Green Energy Holding Company Limited (Yingli Green Energy) is a vertically integrated photovoltaic (PV) product manufacturer in China. Through Baoding Tianwei Yingli New Energy Resources Co., Ltd. (Tianwei Yingli), the Company’s principal operating subsidiary based in China, it designs, manufactures and sells PV modules, and designs, assembles, sells and installs PV systems that are connected to an electricity transmission grid. As of June 7, 2007, the Company’s annual production capacity was 95 megawatts of polysilicon ingots and wafers, 90 megawatts of PV cells and 100 megawatts of PV modules. Yingli Green EnergyGÇÖs end-products include PV modules and PV systems in different sizes and power outputs. It sells PV modules under its own brand name, Yingli, to PV system integrators and distributors located in various markets around the world, including Germany, Spain, China and the United States.

FUNDAMENTALS: 

Yingli has been no exception to the exceptional growth seen in the solar industry over the past two years with earnings growth nearly quadrupling in 2006.  The company hit a bit of a snag with its earnings in the past two quarters but that is expected to be an abberation and the company is seen posting overall growth in 2007 of 82%, then another 90% growth in 2008.  Profit margins are good and return on equity is off the charts after a big spike over the past year.  Overall, despite the hiccup in the last two quarters, this is a company with great fundamentals and a ton of momentum.

TECHNICAL:  

I’m a big fan of highly rated IPO’s like Yingli which tend to do extremely well in strong markets because they are off the radar of many and it isn’t until they have run up significantly that people start paying attention (be sure to see a recently posted IPO watch list of the highest rated IPO’s).  Getting in on a breakout from the first base formation is an ideal entry point and that is exactly what the stock did today.  It broke out from a short cup with handle base formation at 20.40 with strong volume to a new all time high.  All indications point to further gains from here.

SELFINVESTORS RATING: With a total score of 51/60 (26/30 for fundamentals, 25/30 for technical), Yingli (YGE) is near the top of the SelfInvestors.com Breakout Watch list.

Full Disclosure/Disclaimer: The stock of the day is by no means a buy recommendation.  Please do your own research and make a personal decision based on your own tolerance for risk.  I currently do own a position in YGE.

Awaiting Retail / Fed, Market Rises On Anemic Volume; Stock of Day – Baidu.com (BIDU)

The big run today seemed to come out of left field considering on Friday we had some distribution and a breach of some key support levels.  In the absence of any major credit/housing/subprime concerns, the market chose to focus on a few positives today in the narrowing of the deficit and some good sales numbers out of McDonalds.  On the surface it looked to be a big bullish day, but considering volume was anemic once again, we can’t take too much from today’s action.  The major indices have basically just pushed back up to near their resistance levels.  We can probably expect more light volume trading in the coming days as the market holds its breath for Friday’s retail numbers, all that overseas commercial paper coming up for renewal and then the big Fed rate decision next Tuesday.  It’s absolutely anyone’s guess as to which way this market will swing over the next week or so.  Combine the high emotions and the Fed uncertainty and it really remains a difficult environment to make money on EITHER side.  I still recommend that most people stay the heck out of this market until several days after the Fed decision, possibly longer.

::: Major Indices Performance – The Numbers :::

(Note: volume averages are based on the average over the past 50 days)
Data as of 4:00EST – End of Day September 11th 2007

Nasdaq: UP 1.5% today with volume 10% BELOW  average
Nasdaq ETF (QQQQ) UP 1.51%, volume 30% BELOW average
Dow: UP 1.38%, with volume 15% BELOW the average
Dow ETF (DIA): UP 1.26%, volume 41% BELOW the average
S&P ETF (SPY): UP 1.17%, volume 28% BELOW the average
Russell Small Cap ETF (IWM): UP 1.59%, volume 29% BELOW the average

::: SelflInvestors Leading Stocks :::

The Self Investors Leading Stocks Index is comprised of stocks in the Breakout Tracker, which is a database of the fastest growing companies near a breakout or having already broken out of a base.  Leading stocks did about as well as could be expected today – about in line with what the Russell 2000 did.  Again, no volume behind the rise in leading stocks today.

Summary:

* Advancers led Decliners 253 to 45
* Advancers were up an average of 2.19% today, with volume 21% BELOW average
* Decliners were down an average of 1.59% with volume 8% ABOVE average
* The total SI Leading Stocks Index was UP 1.61% today with volume 17% BELOW average

::: Where’s the Money Flowing :::

Many investing websites provide leading industries based on price performance alone. However, without accompanying volume levels, this can sometimes be misleading.  The only way that I know of to gauge industry/sector strength WITH volume levels is through the analysis of ETF’s.  A couple years ago this was not possible, but as more traders/investors use ETF’s they become a much better tool for gauging the health of the market and seeing where the money is flowing (or not flowing).  Using the proprietary SelfInvestors Demand Indicator score which measures price and volume movements, I’m able to quickly see which sectors/industries are seeing the greatest inflows of cash.  For a detailed look at how I go about gauging sector/industry strength please see the following post: http://selfinvestors.com/si/industry_tracking/

* Current Leading Sectors/Industries (over last 30 trading days):  
Gold, Biotech, Networking, Technology, Aerospace/Defense
                                          
* Current Lagging Sectors/Industries (over last 30 trading days): 
Retail, Consumer Discretionary, Transports

* Today’s Market Moving Industries/Sectors (UP):
Gold Miners, Retail, Telecom, Real Estate, Energy

* Today’s Market Moving Industries/Sectors (DOWN):
NO big down movers today.

::: Stocks :::

The stocks section will be an area where I highlight one stock selected from a group of stocks moving up with volume well above average and most likely breaking out of a base or consolidation.  Today’s stock is Baidu.com (BIDU) which just continues to defy gravity.

ABOUT: 

Baidu.com, Inc. (Baidu) is a Chinese-language Internet search provider. The Company conducts its operations principally through Baidu Online, its wholly owned subsidiary in Beijing, the People’s Republic of China. In addition, it conducts part of its operations through Baidu Netcom, a limited liability company in Beijing, the People’s Republic of China, which holds the licenses and approvals necessary to operate Baidu’s Websites and provide online advertising services. Baidu offers a Chinese-language search platform, which consists of its Websites and certain online application software, as well as Baidu Union, which is its network of third-party Websites and software applications. It primarily provides Chinese language Internet search services to enable users to find information online, including Web pages, news, images and multimedia files, through links provided on its Websites. In April 2006, the Company established Baidu Times, a wholly owned subsidiary in Beijing.

FUNDAMENTALS: 

Since posting its first profitable year in 2004, Baidu has been a company on an extraordinary growth path, with a near tripling of profits in 2005 and then quadrupling profits in 2006.  It’s not possible to sustain that kind of growth and it has moderated some but the company is still expected to post earnings growth of 75% this year and then again in 2008.  Both net margins (37%) and return on equity (32%) have spiked considerably higher in the last year.  One key characteristic that I look for in big winners are accelerating margins and ROE and Baidu certainly fits the bill.  This all adds up to a near perfect 29/30 fundamental ranking in the SelfInvestors.com database.

TECHNICAL:  

BIDU broke out of a base today with decent volume to a new all time high.  This in and of itself is very bullish action, but the base itself is a bit poorly formed.  Considering the run it’s had since first breaking out in May, I’d like to see a longer consolidation.  The current base is not quite 8 weeks old and the formation is a fairly sharp V like pattern.  These patterns can work and if any stock can continue vaulting from a less than perfect base it’s BIDU, but I’m taking a cautious approach considering the shaky base and the uncertain overall market.  I’m adding a very small position on the breakout and will look to add more on a successful test and bounce off the 50 day moving average.

SELFINVESTORS RATING: With a total score of 52/60 (29/30 for fundamentals, 23/30 for technical), Baidu.com (BIDU) has been and continues to be a top breakout stock.

Full Disclosure/Disclaimer: The stock of the day is by no means a buy recommendation.  Please do your own research and make a personal decision based on your own tolerance for risk.  I currently own a small position in BIDU and will be looking to add a little more when this pullback is complete.

The Best Place to Be Remains on the Sidelines; Gold Shines

Last week played out just about how it could have been expected as the market pushed a bit higher before exhausting its lengthy run right around key resistance levels following the big capitulation day on August 16th.  This against a back drop of contrasting economic data last week as the typically poor housing start numbers were tempered by decent retail and manufacturing results.  Doubts about whether the Fed would cut rates at all were beginning to creep in the minds of traders.. that is until the big miss in the jobs number on Friday which many think tips the scales to a certain Fed rate cut during its next meeting.  Fed funds futures are even pricing in a 40% chance of a 50 basis rate cut.

The Fed has been saying that the impact of the credit/subprime issues on the overall economy has been relatively contained and that they won’t make any moves to help prop up the market or bail anyone out so I have to say I’m surprised that there is so much certainty out there that a rate cut will happen.  While I definitely think the odds are in favor of a .25% rate cut on September 18th, we certainly can’t rule out that the Fed will continue to use other means (providing liquidity, cutting at the discount window) until it sees more definitive evidence that the broader economy is at risk.  Can we really make any assumptions about one jobs report which has always been extremely volatile?  From a trading standpoint it’s important to remember that the expectation of a fed rate cut has been the backbone of the rally off the lows with a 25 basis point cut priced into the market.  I think the ONLY way this market doesn’t eventually test the August lows is if the Fed cuts by 50 basis points at the September meeting.  In the scenario of a 25 basis point cut, we probably get a knee jerk run up reaction following the announcement before the market turns tail and continues lower, repairing the technical damage inflicted in mid August.  If no rate cut takes place this September, look out below. 

Running through these scenarios is a good reminder of just how tricky this current market is to make money in.  The bears have the upper hand right now, but the almighty Fed can strike at any moment with news of a rate cut killing short positions.  It all adds up to what I’ve been saying for several weeks now.  The best place for most people to be right now is on the sidelines.  That will probably remain so through this month and possibly into October.

Let’s have a look at the charts.  The Nasdaq pushed to the last level of resistance before resistance of multi year highs and it looked like for a moment it might hold at that 50 day moving average, but the jobs report sent the markets reeling a bit and the Nasdaq below this support level.  Notice the selling volume wasn’t particularly intense on Friday but enough to call it a day of distribution.  The Nasdaq will probably go on to test its 200 day moving average in the coming days.

The Dow tested resistance of the 50 day moving average but never broke through like the Nasdaq did.  On Friday it broke through support of the downward trend line and is also likely headed to that 200 day moving average.

The S&P was also turned away at its 50 day moving average, but unlike the Dow and Naz has already taken out its 200 day moving average.  There really isn’t much support in place until it gets back to near those August lows.. around 1400.

The tracking ETF of the Russell 2000 below is very telling.  This is a classic breakdown, where the stock takes out key support levels, tests new resistance and then resumes the trend down.  In this case, at the strong resistance level where the 50 and 200 day moving averages converge.  In all likelihood the Russell will retest the August lows.

 ::: Model Portfolio Update :::

I continue to trade lighly in this environment with a large cash position.  I did underestimate the potential for the oversold bounce after the big day of capitulation on Aug 16th and admittedly rushed into a few additional short positions a little early.  Small short positions in First Solar (FSLR) and Iconix Brands (ICON) were closed for losses of 12% and 8% respectively, but considering they were small positions the portfolio performance didn’t take much of a hit.  While the market remains a bit stronger than I thought it would be at this point, the bears still have the upper hand and my bias continues to be on the short side.  I replaced the two closed short positions with two new positions on the short side while maintaining long term "long" positions in both Cisco and Google.  A few more days like Friday and I may begin putting a bit more cash into the long side, but in all likelihood I won’t do much of anything for at least the next few weeks.  There is absolutely nothing wrong with continuing to sit on a pile of cash right now.  For the week, the portfolio dipped a bit by .4% bringing the year to date performance to 8.8%, more than 3x the performance of the S&P.  My results this year certainly haven’t been extraordinary, but I’m not all unhappy with the gains in what has been a very difficult market to read.  Current allocation of the portfolio is 53% cash, 24% long and 23% short.

::: Best/Worst Performers :::

– Top 10 Performing Industries For the Week –

1. Silver: 10.65%
2. Gold: 9.55%
3. Drug Related Products: 7.60%
4. Dairy Products: 5.00%
5. Oil & Gas Drilling & Exploration: 4.85%
6. Broadcasting – Radio: 4.55%
7. Catalog & Mail Order Houses:  4.20%
8. Oil & Gas Equip & Services: 4.00%
9. Independent Oil & Gas: 4.00%
10. Music & Video Stores: 3.85%

– Top 10 Worst Performing Industries For the Week –

1. Recreaional Vehicles: -7.10%
2. Toy & Hobby Stores: -5.20%
3. Home Improvement Stores: -5.20%
4. Rubber & Plastics: -4.75%
5. Office Supplies: -4.70%
6. Specialty Retail: -4.60%
7. Staffing & Outsourcing: -4.40%
8. Residential Construction: -4.40%
9. Department Stores: -3.80%
10. Manufactured Housing: -3.60%

– Top 5 Best Performing ETFs For the Week –
 
1. Morgan Stanley China (CAF)  13.85%
2. Market Vectors Gold Miners (GDX) 12.75%
3. ASA Gold (ASA) 9.70%
4. Ishares Silver (SLV) 6.35%
5. SPDR Gold (GLD) 5.45%

– Worst 5 Performing ETF’s –

1. Thai Fund (TTF)  -5.60%
2. Home Construction (ITB) -4.65%
3. Japan Small Cap (JOF) -4.40%
4. SPDR Homebuilders (XHB) -4.30%
5. Powershares Retail (PMR)  -3.95%

:::  IPO’s Worth Watching for This Week :::

No IPO’s scheduled for the next couple weeks. 

::: Upcoming Economic Reports (9/10/07 – 9/14/07) :::

Monday:         Consumer Credit
Tuesday:       Trade Balance
Wednesday: Crude Inventories
Thursday:      Initial Claims, Treasury Budget
Friday:            Retail Sales, Capacity Utilization, Import/Export Prices, Business Inventories

::: Upcoming Notable Earnings Reports :::

None this week

::: In Case You Missed It – SelfInvestors Blog Entries of the Past Week :::

1. Credit Card Rental Car Insurance

2. Trades of the Day – Short Opportunities in Chordiant Software (CHRD) & United Online (UNTD)

3. Trade of the Day – Bullish Triangle Breakout in HMS Holdings (HMSY)

4. CANSLIM Inquiry; Model Portfolio Performance & Buy/Sell Alerts

Remain Cautious in No Man’s Land

 
 The market typically does well the week before a major holiday and Labor Day is no exception.  It certainly was an odd week of trading with jeckyl and hyde moves on Tuesday and Wednesday ultimately resulting in another "preholiday" positive gain, pushing the major indices further above their downward trendlines.  The technical action over the past couple weeks has improved but not to the point where I’m comfortable sounding the all clear alarm.  We can’t take much away from a volatile, light volume  trading week and keep in mind that the major indices are fast approaching big overhead resistance areas.  Until we begin testing key support and resistance levels with normal trading volumes, it’s best to remain largely in cash.  The market has come too far, too fast to initiate new long positions and the technical action is a bit too strong to pursue short positions aggressively.  I’ll call it no man’s land.

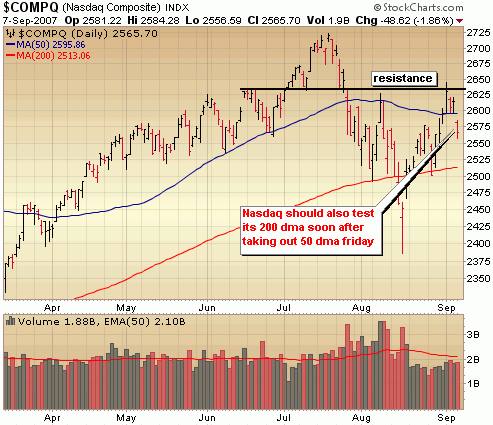
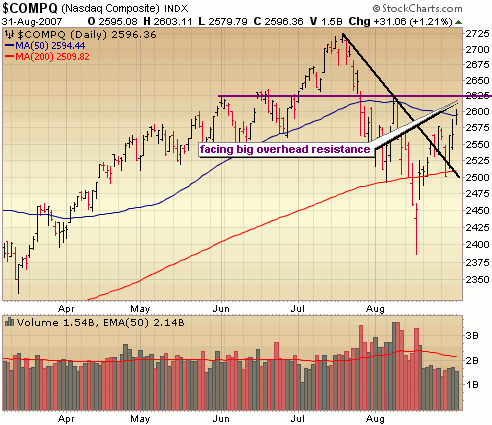
Let’s have a look at the Nasdaq.  When I say that the major indices have improved technically I’m specifically referring to the breach of their downward trend lines.  There has been no trouble with this area of resistance as you can see in the Nasdaq in the chart below.  However, big overhead resistance looms around the 50 day moving average and previous highs around 2625.  There is some room for the Nasdaq to push higher, but I think this bounce will be exhausted soon.

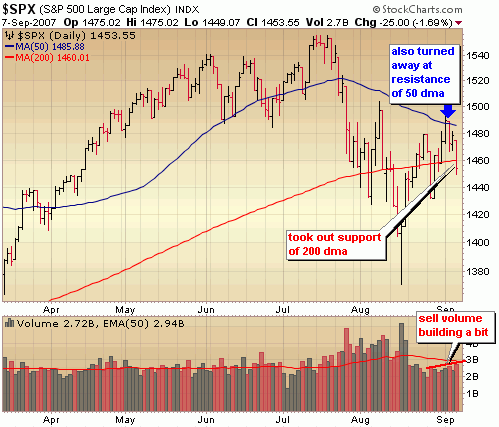
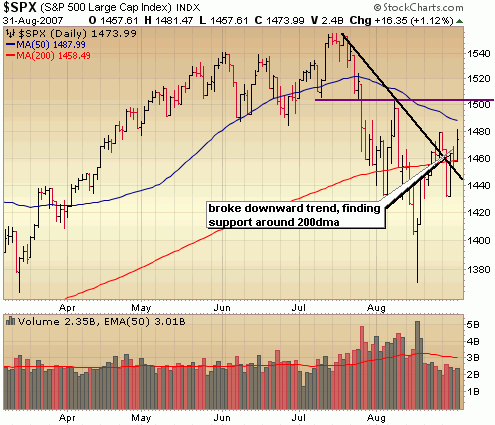
The S&P has shown some strength too by clearing the downward trend line (in black) but key resistance areas are on the horizon at the 50 day moving average and then around the August highs of 1500.  The downward  trend line may prove to be a new area of support so look for the S&P holding above this line as an indication of underlying strength. 


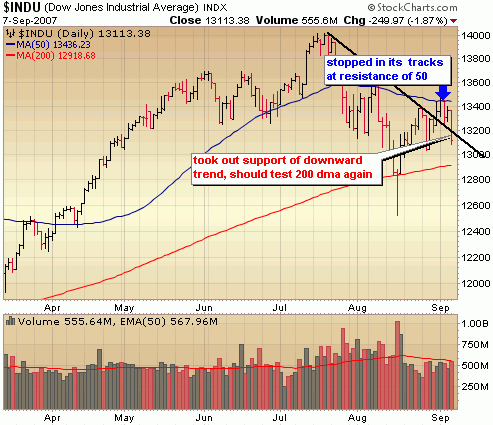
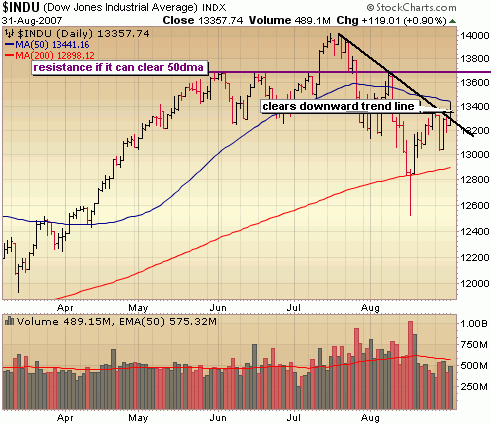
The Dow just cleared its downward trend line on Friday, so it’s lagging a bit.  Notice it hit resistance right at the 50 day moving average on Friday and retreated.. a sign that the push higher may be running out of gas.  If the Dow can clear Friday’s high we could very well see another couple hundred points higher to the next level of resistance around 13700.  I would be might tempted to short the heck out of the market if it gets anywhere close to this level next week.


 ::: Model Portfolio Update :::

The Model Portfolio sits largely in cash (70%) and will likely remain so probably through September while this correction plays out.  It remains a somewhat irrational market and difficult to read from both a fundamental and technical perspective making it tough to profit from either side of the market.  I’m continue to hold a couple long term core positions in Google and Cisco and am playing a few small short positions.  The year to date performance has edged up in the past couple weeks to 9.2%, still more than double the S&P500.

::: Best/Worst Performers :::

– Top 10 Performing Industries For the Week –

1. Home Improvement Stores: 6.35%
2. Aluminum: 4.50%
3. Major Airlines: 3.75%
4. Beverages – Brewers: 3.70%
5. Diversified Computer Systems: 3.60%
6. Personal Computers: 3.60%
7. Jewelry Stores:  3.50%
8. Broadcasting – Radio: 3.40%
9. Heavy Construction: 3.30%
10. Printed Circuit Boards: 3.00%

– Top 10 Worst Performing Industries For the Week –

1. Toy & Hobby Stores: -7.10%
2. Residential Construction: -5.75%
3. Surety & Title Insurance: -4.90%
4. Mortgage Investment: -3.75%
5. Banks – Pacific: -3.40%
6. Banks – Southeast: -3.00%
7. Investment Brokerage: -3.00%
8. Banks – Northeast: -2.70%
9. Banks – Mid Atlantic: -2.70%
10. Banks – Midwest: -2.65%

– Top 5 Best Performing ETFs For the Week –
 
1. Greater China Fund (GCH)  11.55%
2. Powershares China  (PGJ) 5.30%
3. Ishares China  (FXI) 4.65%
4. Claymore Bric (EEB) 4.05%
5. US Oil (USO) 4.00%

– Worst 5 Performing ETF’s –

1. Thai Fund (TTF)  -4.60%
2. US Natural Gas  (UNG) -4.35%
3. Ishares Home Construction (ITB) -3.50%
4. KBW Bank (KBE) -3.05%
5. Malaysia Fund (MAY)  -2.85%

:::  IPO’s Worth Watching for This Week :::

No IPO’s scheduled for the next couple weeks. 

::: Upcoming Economic Reports (9/3/07 – 9/7/07) :::

Monday:         Holiday
Tuesday:       Construction Spending, ISM Index, Auto/Truck Sales
Wednesday:  Pending Home Sales, Fed Beige Book, Crude Inventories
Thursday:      Initial Claims, Productivity (revis), ISM Services
Friday:            Nonfarm Payrolls, Unemployment Rate, Wholesale Inventories

::: Upcoming Notable Earnings Reports :::


Tuesday:

Guess (GES), Mobile TeleSystems (MBT)

Wednesday: 

J Crew (JCG)

Thursday:

Smith & Wesson (SWHC), Verifone Holdings (PAY), Focus Media (FMCN)

Market Capitulates On Fed Discount Rate Cut, Offers Another Opportunity to Minimize Risk

The wild ride continued this week, culminating in a dramatic nearly 600 point swing following the Fed move to cut the rate 50 basis points at the little used discount rate window.  The fact that the Fed is now acknowledging the concerns, wiling to take action and leaving open the possiblility of a cut of the fed funds rate probably had more to do with the jubilee than the rate cut itself but the oversold market was looking for Fed action and it got it.  It proved to be enough of a springboard to catapult both the Dow and Nasdaq past key resistance to reclaim key support levels. 

So can we forget about the issues plaguing this market now?  NO! Let’s keep in mind that the only sector really moving last week was financials.  Have a look at the broad market across semis, transportation and even gold and what you see is big losses again. Once the euphoria of the Fed move on Friday wears off, I fully expect the market to focus once again on the daily dose of subprime related meltdowns.  Also, let’s not forget that the Fed did acknowledge that it is quite concerned about what the credit concerns could do to do the economy which might have been lost in all the euphoria Friday.

From a technical standpoint, the massive capitulation we saw on Thursday likely marks a bottom at least in the short term.  However, with the market carving out the largest correction in 4 years in just a few weeks, it will take time to repair this kind of technical damage.  We will need time to carve out a base, which means that we’ll probably need to test those lows at some point before having a chance to take out all time highs.    What this bounce does is create opportunity.  Opportunity for those of you who have remained fully invested to lighten the load a bit and for the more aggressive, shorter term trader to begin initiating some new short positions.  Remember that bull markets die hard and offer multiple chances to get out.  We can’t possibly know how far this market will correct, so continuing to play cautiously until more signs of a bottom are in place is the smart thing to do.  There are still some major concerns out there across the board and we have only begun to scratch the surface.  Keep on eye on how the market reacts to this news because near the bottom the market will begin shrugging off the concerns and focusing on the positive.  We’re not there yet.

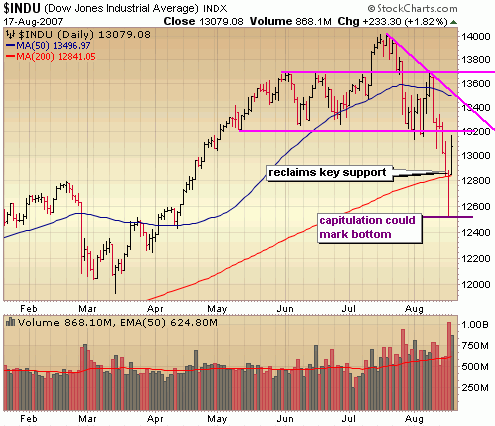
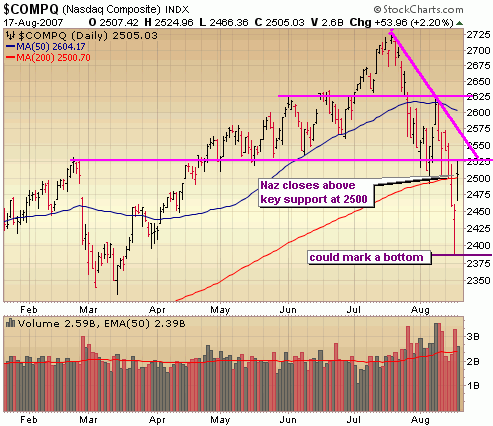
Two big positives in the Dow last week – capitulation on Thursday and reclaiming of key support of the 200 day moving average on Friday.  However, I think that any further moves up create greater risk for holding long positions and increasing profit potential for shorts.  The pink lines outline resistance levels.  If the Dow can bust through 13200, I think there is a very good chance of testing this new downward trend line around 13400.  Look for decreasing buy volume on any rally attempts as an indication that the bounce is nearing an end.

Same thing for the Nasdaq – capitulation ultimately led to a reclaiming of key support above 2500 but big resistance areas loom.  If it can muster enough strength to get above Friday’s highs then we will probably see a test of the short term downward trend around 2550.

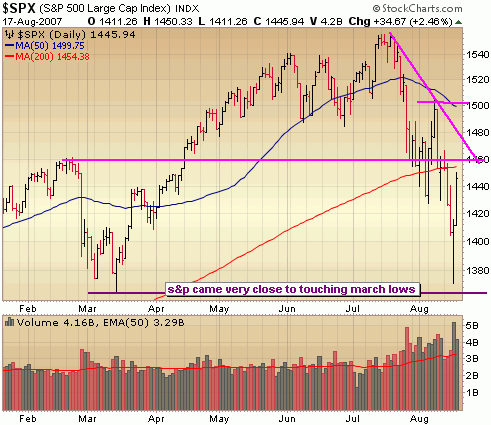
 Notice that the S&P nearly touched the March lows.  I think this area will prove to be a critical area of support that the S&P will ultimately retest before the correction is said and done.  It should be noted that unlike the Dow and Nasdaq, the S&P has NOT reclaimed key support levels.  It will be much more difficult for it to test its downward trendline around 1470.. it first needs to push through big resistance around 1455.

 ::: Model Portfolio Update :::

Yet another busy week for the portfolio as I closed out several long positions, captured some more gains on the short side and initiated a few more longs to capture some of the big bounce that began late Thursday.  I certainly haven’t been making large bets either way, but I have been fairly aggressive in the playing both sides of the market.  I was fortunate to sustain very little damage during the plunge in the first half of the week by closing small long positions quickly and then quickly locking in gains on the short side when it appeared the market was way overdue for a big bounce.  For the week, the portfolio took a minor hit, dropping 1.2% and remains well ahead of the S&P year to date performance with an 8.5% gain.  I’m not currently carrying any short positions, but will begin loading up again early this week especially if the market continues to rise with ligher volume like I think that it will.  The current allocation of the portfolio remains significantly in cash with 53%.

::: Best/Worst Performers :::

– Top 10 Performing Industries For the Week –

1. Regional – Southwest Banks: 8.40%
2. Savings & Loans: 5.60%
3. Regional – Pacific Banks: 4.90%
4. Regional – Southeast Banks: 4.60%
5. Regional – Midatlantic Banks: 4.35%
6. Regional – Midwest Banks: 4.25%
7. Office Supplies:  3.45%
8. Property & Casualty Insurance: 2.85%
9. Recreational Goods: 2.70%
10. Data Storage Devices: 2.45%

– Top 10 Worst Performing Industries For the Week –

1. Silver: -17.80%
2. Residential Construction: -10.55%
3. Nonmetallic Mineral & Mining: -9.60%
4. Gold: -8.65%
5. Wholesale Other: -8.30%
6. Air Services – Other: -8.20%
7. Copper: -8.10%
8. Regional Airlines: -7.90%
9. Major Airlines: -7.75%
10. Industrial Metals & Minerals: -7.65%

– Top 5 Best Performing ETFs For the Week –
 
1. KBW Regional Banking (KBW)  6.35%
2. KBW Bank (KBE) 4.60%
3. HLDRS Regional Bank (RKH) 4.50%
4. SPDR Financials (XLF) 3.45%
5. KBW Insurance (KIE) 2.60%

– Worst 5 Performing ETF’s –

1. Asa Gold (ASA)  -11.90%
2. Latin America Discovery Fund (LDF) -11.75%
3. Market Vectors Gold Miners (GDX) -11.60%
4. Turkish Investment Fund (TKF) -10.95%
5. Ishares Brazil (EWZ) -10.80%

:::  IPO’s Worth Watching for This Week :::

No IPO’s scheduled for the next couple weeks. 

::: Upcoming Economic Reports (8/20/07 – 8/24/07) :::

Monday:         Leading Indicators
Tuesday:       None
Wednesday:  Crude Inventories
Thursday:      Initial Claims, Leading Indicators
Friday:            Durable Orders, New Home Sales

::: Upcoming Notable Earnings Reports :::


Tuesday:

Dicks Sporting Goods (DKS)

Wednesday: 

Zumiez (ZUMZ), Gymboree (GYMB), BHP Billiton (BHP)

Thursday:

GameStop (GME)

                 
::: In Case You Missed It – SelfInvestors Blog Entries of the Past Week :::

1. Massive Capitulation; Stock of Day – Morningstar (MORN) Revisited

2. Dow Hits Key Support, Market Due for Bounce; Stock of Day – LKQ Corp (LKQX)

3. A History of Analyst Upgrades/Downgrades – Countrywide Financial (CFC), American Home Mortgage (AHM), Thornburg (TMA)

4. Sell Volume Light But Dow and S&P Take Out 4 Month Lows

5. Trade of the Day – Bounce to Resistance Offers Short Trade in Centurytel (CTL)