The Fed has spoken, the pressure valve of uncertainty has been lifted and shorts were sent scrambling. Now it’s time to play the hand we’re dealt and the hand we’re dealt changes the game over the next several months from one of a bearish standpoint to one where looking for long opportunities will be most profitable. We’re ultimately headed higher from here.
I was certainly in the majority and flat out wrong about what the Fed would do. I was in the camp that the Fed would cut 25 points and use the discount window for a more aggressive 50 point cut, resulting in a sizable knee jerk move up, followed by selling. As it turns out, to the shock of many, the Fed cut the rate 50 points on both the fed funds and at the discount window and the market soared to its largest gains in a few years.
Now this preemptive, bold move by the Fed can be debated until we’re all blue in the face but the fact of the matter is that this injects significant liquidity into the market and releases the pressure valve in the credit markets which should keep the market rising at least over the next several months. Although I tend to consider this move a bit of an overreaction, what do I know? The Fed has access to more data points then we can imagine and clearly the Fed has seen enough erosion to think that the economy may be in serious trouble. They didn’t make a decision based on the "potential" for increasing inflation but rather acted decisively to curb the problems that we can see here and now. Ben and team acted in the here and now rather than on what could be (the inflation monster). I’ll call it the Zen of Ben. Yes, the piper may still need to be paid following the easy money cycle and all the greed and speculation it brought with it. This move may just delay the inevitable. But for now we should not concern ourselves with what may or may not occur down the road. This could be a brilliant move or a disaster and only time will tell. For now be like Ben, be Zen. Focus on the here and now and profit from the long side while the good times roll. That means living, thinking, trading in the moment and not fighting this Fed.
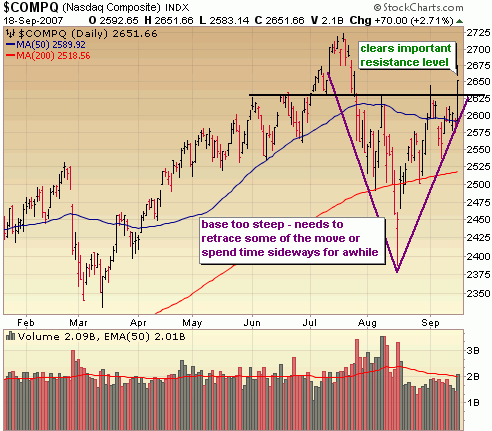
From a technical perspective, volume levels weren’t great today but considering that the market was basically flat lined for several hours I don’t see it as a huge concern. What is more of a concern is the sharp V like move off those mid August lows (up 10% in just a month). This market really needs to repair that technical damage a bit more by retracing some of the move or spending some time sideways for a few weeks. Unless the market continues the habit of shrugging off corrections and soaring to new heights without looking back, the likely action is up to near the July highs then a month or two of sideways action before bolting higher for the rest of the year. That’s how a "technically rational" market might play out but as we’ve seen over the past several months, the market has been anything but technically rational. At any rate, any decent pull backs from here offers opportunity on the long side.
A look at the Nasdaq reveals that no significant resistance levels stand in its way between here and multi year highs around 2725. Note the steep V like base which is prone to failure. I think a move to test the highs is all but assured, but a successful breakout to multi year highs and a hold above those levels is not.
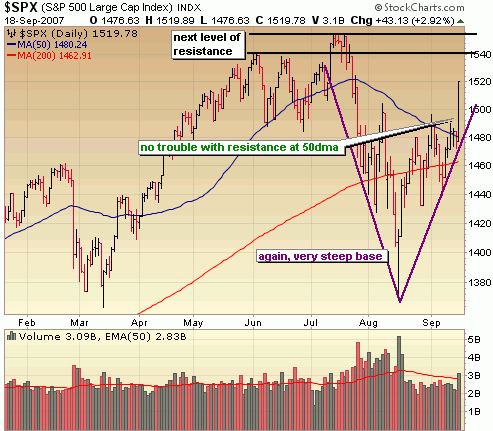
The S&P convincingly took out resistance of the 50 day moving average today and is headed to the next level of resistance at 1540. I’m hesitant to initiate many long positions at this level and want to see some kind of retracement of today’s move before getting aggressive on the long side.
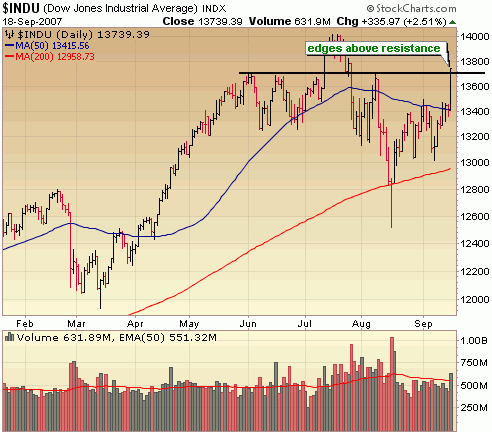
The DOW just edged up above key resistance around 13700 today. It looks likely that it will soon go on to test its all time highs around 14000.
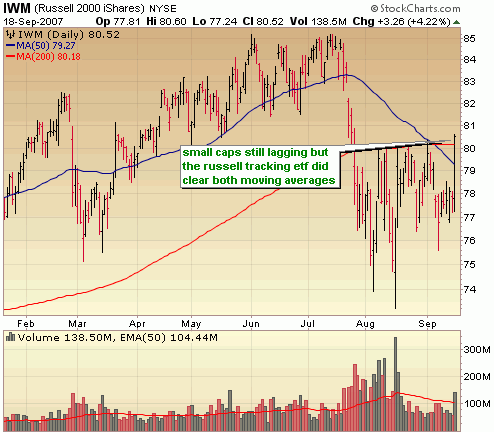
Finally, the Russell Tracking ETF (IWM), cleared two key resistance levels of the 50 and 200 day moving averages. Small caps remain the laggards.
::: Major Indices Performance – The Numbers :::
(Note: volume averages are based on the average over the past 50 days)
Data as of 4:00EST – End of Day September 18th 2007
Nasdaq: UP 2.71% today with volume 5% ABOVE average
Nasdaq ETF (QQQQ) UP 2.52%, volume 2% ABOVE average
Dow: UP 2.51%, with volume 15% ABOVE the average
Dow ETF (DIA): UP 2.45%, volume 6% BELOW the average
S&P ETF (SPY): UP 2.94%, volume 15% ABOVE the average
Russell Small Cap ETF (IWM): UP 4.22%, volume 15% ABOVE the average
::: SelflInvestors Leading Stocks :::
The Self Investors Leading Stocks Index is comprised of stocks in the Breakout Tracker, which is a database of the fastest growing companies near a breakout or having already broken out of a base. Leading stocks did very well today and about in line with what the Russell did. The small ones clearly led the way today, but as with the overall market, volume could have been a bit stronger.
Summary:
* Advancers led Decliners 284 to 15
* Advancers were up an average of 3.84% today, with volume 8% ABOVE average
* Decliners were down an average of 1.67% with volume 7% BELOW average
* The total SI Leading Stocks Index was UP 3.57% today with volume 8% ABOVE average
::: Where’s the Money Flowing :::
Many investing websites provide leading industries based on price performance alone. However, without accompanying volume levels, this can sometimes be misleading. The only way that I know of to gauge industry/sector strength WITH volume levels is through the analysis of ETF’s. A couple years ago this was not possible, but as more traders/investors use ETF’s they become a much better tool for gauging the health of the market and seeing where the money is flowing (or not flowing). Using the proprietary SelfInvestors Demand Indicator score which measures price and volume movements, I’m able to quickly see which sectors/industries are seeing the greatest inflows of cash. For a detailed look at how I go about gauging sector/industry strength please see the following post: http://selfinvestors.com/si/industry_tracking/
* Current Leading Sectors/Industries (over last 30 trading days):
Gold, Consumer Goods, Consumer Staples, Networking, Telecom, Energy
* Current Lagging Sectors/Industries (over last 30 trading days):
Home Builders, Transports, Real Estate, Nanotech, Broadband
* Today’s Market Moving Industries/Sectors (UP):
Home Construction, Regional Banks, Retail, Materials
* Today’s Market Moving Industries/Sectors (DOWN):
NO big down movers today.
::: Stocks :::
The stocks section will be an area where I highlight one stock selected from a group of stocks moving up with volume well above average and most likely breaking out of a base or consolidation. Today’s stock is Yingli Green Energy (YGE), which broke out of a short cup with handle base today with strong volume.
ABOUT:
Yingli Green Energy Holding Company Limited (Yingli Green Energy) is a vertically integrated photovoltaic (PV) product manufacturer in China. Through Baoding Tianwei Yingli New Energy Resources Co., Ltd. (Tianwei Yingli), the Company’s principal operating subsidiary based in China, it designs, manufactures and sells PV modules, and designs, assembles, sells and installs PV systems that are connected to an electricity transmission grid. As of June 7, 2007, the Company’s annual production capacity was 95 megawatts of polysilicon ingots and wafers, 90 megawatts of PV cells and 100 megawatts of PV modules. Yingli Green EnergyGÇÖs end-products include PV modules and PV systems in different sizes and power outputs. It sells PV modules under its own brand name, Yingli, to PV system integrators and distributors located in various markets around the world, including Germany, Spain, China and the United States.
FUNDAMENTALS:
Yingli has been no exception to the exceptional growth seen in the solar industry over the past two years with earnings growth nearly quadrupling in 2006. The company hit a bit of a snag with its earnings in the past two quarters but that is expected to be an abberation and the company is seen posting overall growth in 2007 of 82%, then another 90% growth in 2008. Profit margins are good and return on equity is off the charts after a big spike over the past year. Overall, despite the hiccup in the last two quarters, this is a company with great fundamentals and a ton of momentum.
TECHNICAL:
I’m a big fan of highly rated IPO’s like Yingli which tend to do extremely well in strong markets because they are off the radar of many and it isn’t until they have run up significantly that people start paying attention (be sure to see a recently posted IPO watch list of the highest rated IPO’s). Getting in on a breakout from the first base formation is an ideal entry point and that is exactly what the stock did today. It broke out from a short cup with handle base formation at 20.40 with strong volume to a new all time high. All indications point to further gains from here.
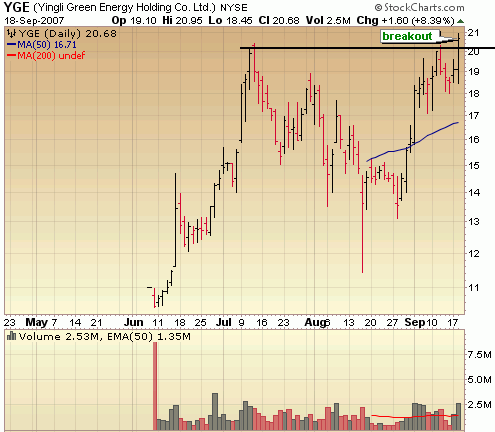
SELFINVESTORS RATING: With a total score of 51/60 (26/30 for fundamentals, 25/30 for technical), Yingli (YGE) is near the top of the SelfInvestors.com Breakout Watch list.
Full Disclosure/Disclaimer: The stock of the day is by no means a buy recommendation. Please do your own research and make a personal decision based on your own tolerance for risk. I currently do own a position in YGE.