Last week played out just about how it could have been expected as the market pushed a bit higher before exhausting its lengthy run right around key resistance levels following the big capitulation day on August 16th. This against a back drop of contrasting economic data last week as the typically poor housing start numbers were tempered by decent retail and manufacturing results. Doubts about whether the Fed would cut rates at all were beginning to creep in the minds of traders.. that is until the big miss in the jobs number on Friday which many think tips the scales to a certain Fed rate cut during its next meeting. Fed funds futures are even pricing in a 40% chance of a 50 basis rate cut.
The Fed has been saying that the impact of the credit/subprime issues on the overall economy has been relatively contained and that they won’t make any moves to help prop up the market or bail anyone out so I have to say I’m surprised that there is so much certainty out there that a rate cut will happen. While I definitely think the odds are in favor of a .25% rate cut on September 18th, we certainly can’t rule out that the Fed will continue to use other means (providing liquidity, cutting at the discount window) until it sees more definitive evidence that the broader economy is at risk. Can we really make any assumptions about one jobs report which has always been extremely volatile? From a trading standpoint it’s important to remember that the expectation of a fed rate cut has been the backbone of the rally off the lows with a 25 basis point cut priced into the market. I think the ONLY way this market doesn’t eventually test the August lows is if the Fed cuts by 50 basis points at the September meeting. In the scenario of a 25 basis point cut, we probably get a knee jerk run up reaction following the announcement before the market turns tail and continues lower, repairing the technical damage inflicted in mid August. If no rate cut takes place this September, look out below.
Running through these scenarios is a good reminder of just how tricky this current market is to make money in. The bears have the upper hand right now, but the almighty Fed can strike at any moment with news of a rate cut killing short positions. It all adds up to what I’ve been saying for several weeks now. The best place for most people to be right now is on the sidelines. That will probably remain so through this month and possibly into October.
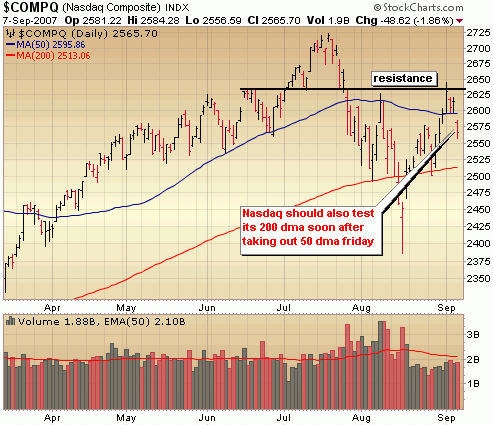
Let’s have a look at the charts. The Nasdaq pushed to the last level of resistance before resistance of multi year highs and it looked like for a moment it might hold at that 50 day moving average, but the jobs report sent the markets reeling a bit and the Nasdaq below this support level. Notice the selling volume wasn’t particularly intense on Friday but enough to call it a day of distribution. The Nasdaq will probably go on to test its 200 day moving average in the coming days.

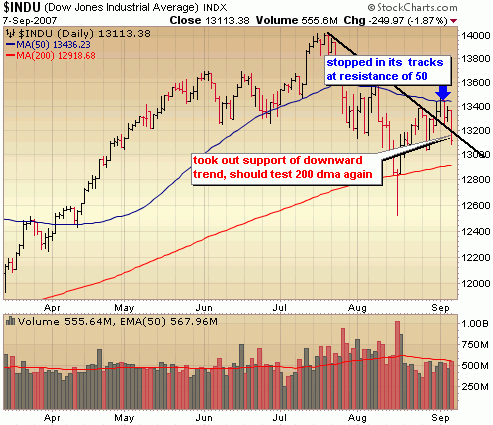
The Dow tested resistance of the 50 day moving average but never broke through like the Nasdaq did. On Friday it broke through support of the downward trend line and is also likely headed to that 200 day moving average.

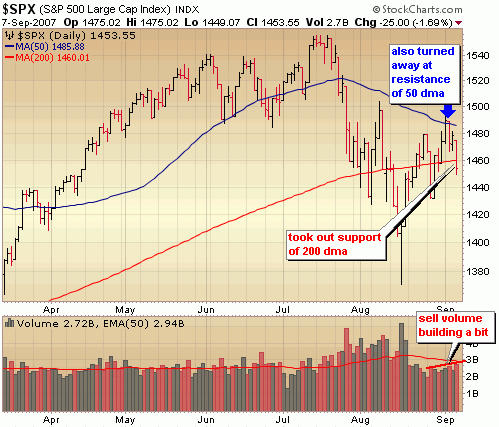
The S&P was also turned away at its 50 day moving average, but unlike the Dow and Naz has already taken out its 200 day moving average. There really isn’t much support in place until it gets back to near those August lows.. around 1400.

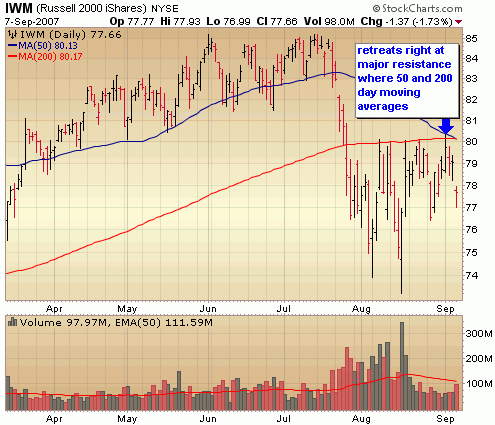
The tracking ETF of the Russell 2000 below is very telling. This is a classic breakdown, where the stock takes out key support levels, tests new resistance and then resumes the trend down. In this case, at the strong resistance level where the 50 and 200 day moving averages converge. In all likelihood the Russell will retest the August lows.

::: Best/Worst Performers :::
– Top 10 Performing Industries For the Week –
1. Silver: 10.65%
2. Gold: 9.55%
3. Drug Related Products: 7.60%
4. Dairy Products: 5.00%
5. Oil & Gas Drilling & Exploration: 4.85%
6. Broadcasting – Radio: 4.55%
7. Catalog & Mail Order Houses: 4.20%
8. Oil & Gas Equip & Services: 4.00%
9. Independent Oil & Gas: 4.00%
10. Music & Video Stores: 3.85%
– Top 10 Worst Performing Industries For the Week –
1. Recreaional Vehicles: -7.10%
2. Toy & Hobby Stores: -5.20%
3. Home Improvement Stores: -5.20%
4. Rubber & Plastics: -4.75%
5. Office Supplies: -4.70%
6. Specialty Retail: -4.60%
7. Staffing & Outsourcing: -4.40%
8. Residential Construction: -4.40%
9. Department Stores: -3.80%
10. Manufactured Housing: -3.60%
– Top 5 Best Performing ETFs For the Week –
1. Morgan Stanley China (CAF) 13.85%
2. Market Vectors Gold Miners (GDX) 12.75%
3. ASA Gold (ASA) 9.70%
4. Ishares Silver (SLV) 6.35%
5. SPDR Gold (GLD) 5.45%
– Worst 5 Performing ETF’s –
1. Thai Fund (TTF) -5.60%
2. Home Construction (ITB) -4.65%
3. Japan Small Cap (JOF) -4.40%
4. SPDR Homebuilders (XHB) -4.30%
5. Powershares Retail (PMR) -3.95%
::: IPO’s Worth Watching for This Week :::
No IPO’s scheduled for the next couple weeks.
::: Upcoming Economic Reports (9/10/07 – 9/14/07) :::
Monday: Consumer Credit
Tuesday: Trade Balance
Wednesday: Crude Inventories
Thursday: Initial Claims, Treasury Budget
Friday: Retail Sales, Capacity Utilization, Import/Export Prices, Business Inventories
::: Upcoming Notable Earnings Reports :::
None this week
::: In Case You Missed It – SelfInvestors Blog Entries of the Past Week :::
1. Credit Card Rental Car Insurance
2. Trades of the Day – Short Opportunities in Chordiant Software (CHRD) & United Online (UNTD)
3. Trade of the Day – Bullish Triangle Breakout in HMS Holdings (HMSY)
4. CANSLIM Inquiry; Model Portfolio Performance & Buy/Sell Alerts